
EV Charging As A Service Market Size and Share
Market Overview
| Study Period | 2019 - 2031 |
|---|---|
| Market Size (2026) | USD 236.12 Million |
| Market Size (2031) | USD 794.66 Million |
| Growth Rate (2026 - 2031) | 27.47 % |
| Fastest Growing Market | Asia-Pacific |
| Largest Market | North America |
| Market Concentration | Medium |
Major Players *Disclaimer: Major Players sorted in no particular order Image © Mordor Intelligence. Reuse requires attribution under CC BY 4.0. | |
EV Charging As A Service Market Analysis by Mordor Intelligence
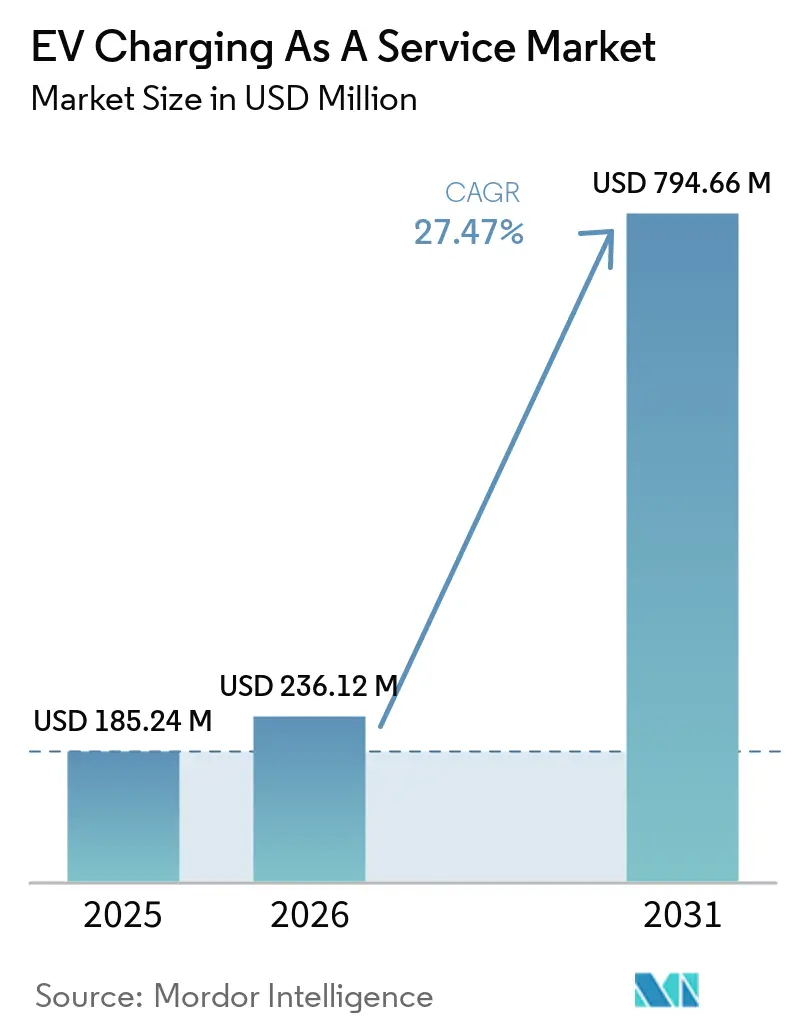
The EV Charging as a Service Market was valued at USD 185.24 million in 2025, and is projected to grow from USD 236.12 million in 2026 to USD 794.66 million by 2031, registering a CAGR of 27.47% during the forecast period (2026–2031). Fleet operators, landlords, and municipalities are increasingly turning to service providers to mitigate charger ownership risks. These providers offer a bundled package of hardware, software, and maintenance for a monthly fee. In the U.S., agencies are disbursing National Electric Vehicle Infrastructure (NEVI) grants to vendors, with a stipulation that they guarantee high uptime—a benchmark that's nearly unattainable for budget-strapped cities. Meanwhile, Europe is advancing the Alternative Fuels Infrastructure Regulation (AFIR), mandating a significant increase in public chargers relative to the number of battery-electric vehicles by the end of the decade. This regulation is nudging highway concessionaires towards long-term Charging-as-a-Service (CaaS) agreements, often featuring revenue-sharing clauses. In the Asia-Pacific region, momentum is largely driven by China's strategic move, allowing private operators to oversee a substantial number of existing chargers. In exchange, these operators receive fees based on utilization and additional income from grid services.
Key Report Takeaways
- By charger type, AC units led with 71.27% of the EV Charging As A Service market share in 2025, while DC fast chargers are projected to advance at a 27.49% CAGR through 2031.
- By fleet service, company vehicles and motor pools captured 27.65% of the EV Charging As A Service market share in 2025, whereas delivery fleets are forecast to expand at a 27.55% CAGR to 2031.
- By end-use, semi-public workplace and retail sites accounted for 71.38% of the EV Charging As A Service market share in 2025, and mobile on-demand charging is poised to rise at a 27.53% CAGR over 2026-2031.
- By power output, Level 1 and AC chargers below 22 kW controlled 78.34% of the EV Charging As A Service market share in 2025, yet ultra-fast systems above 150 kW are expected to grow at a 27.58% CAGR through 2031.
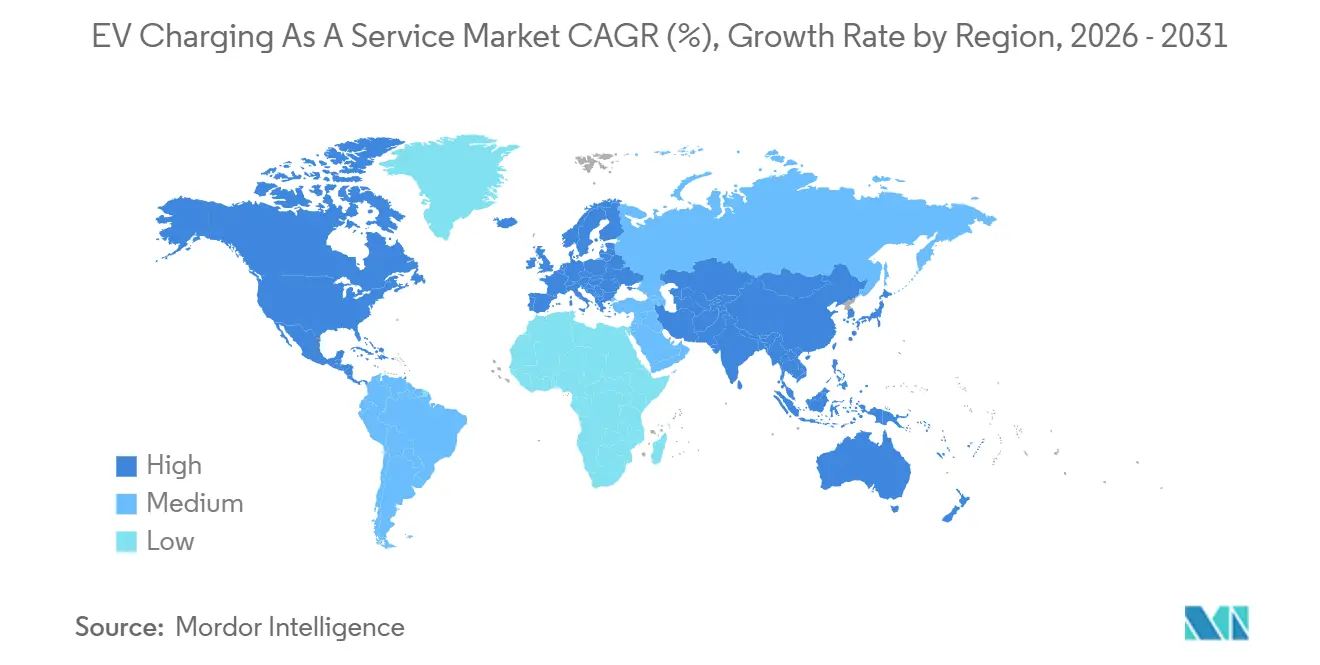
- By geography, North America dominated, accounting for 46.21% of the EV Charging As A Service market share in 2025, while Asia-Pacific is the fastest-growing region, forecast to grow at a 27.61% CAGR to 2031.
Note: Market size and forecast figures in this report are generated using Mordor Intelligence’s proprietary estimation framework, updated with the latest available data and insights as of January 2026.
Market Trends and Insights
Drivers Impact Analysis of EV Charging As A Service Market*
| Drivers | (~) % Impact on CAGR Forecast | Geographic Relevance | Impact Timeline |
|---|---|---|---|
| Government Subsidies and Mandates For Public Charging Roll-Outs | +6.2% | North America & EU core, spill-over to APAC | Medium term (2-4 years) |
| Corporate Fleet-Electrification Commitments | +5.8% | Global, concentrated in North America & Europe | Long term (≥ 4 years) |
| Rapid Build-Out of DC Fast-Charging Corridors | +5.4% | North America, Europe, China | Short term (≤ 2 years) |
| Subscription-Based CaaS Financing Models | +3.7% | Global, early traction in Europe | Medium term (2-4 years) |
| Mobile On-Demand Charging Services Gain Traction | +3.1% | Urban North America & Europe, pilot expansions in Asia-Pacific | Medium term (2-4 years) |
| Micro-Grid + Storage Pairing Cuts Operating Costs | +2.9% | North America & Europe, emerging in China | Long term (≥ 4 years) |
| Source: Mordor Intelligence | |||
Government Subsidies and Mandates for Public Charging Roll-Outs
Federal and regional programs are translating policy goals into mandatory procurement schedules, benefiting the EV Charging-as-a-Service market. NEVI, committing substantial funding through the mid-term, mandates that grant recipients install high-capacity chargers at regular intervals to ensure high uptime. This focus directs awards towards full-service providers equipped with remote diagnostics [1]“NEVI Formula Program,” U.S. Department of Transportation, transportation.gov . AFIR obliges EU states to install 400-kW pools every 60 km along core corridors by 2025, prompting highway operators to sign 10-year CaaS contracts that bundle capital and operations [2]“Regulation (EU) 2023/1804 on Alternative Fuels Infrastructure,” European Commission, europa.eu .
Corporate Fleet-Electrification Commitments
Global logistics and service companies are locking in multi-year CaaS deals to avoid stranded assets as charging standards evolve. Amazon purchased 100,000 Rivian vans and secured depot infrastructure that staggers charging to keep site demand below 2 MW, protecting against punitive tariffs [3]“Sustainability Progress Report 2026,” Amazon.com Inc., amazon.com . By the middle of the decade, UPS plans to electrify a significant portion of its new domestic fleet purchases. The company also employs managed charging at numerous facilities, synchronizing its power draw with real-time pricing. Ford Pro, targeting smaller operators without in-house engineering, provides a comprehensive fleet charging solution at a fixed cost per port, supplemented by a recurring fee. Octopus Energy, through its European fleet division, strategically times overnight AC charging to align with dynamic tariffs, taking advantage of wholesale prices during favorable conditions. Meanwhile, Volvo Trucks offers a bundled package for heavy-duty clients that combines depot infrastructure, predictive maintenance, and charging-as-a-service, with uptime penalties applied if performance falls below a certain threshold.
Rapid Build-Out Of DC Fast-Charging Corridors
As operators race to secure anchor real estate along highways, the window of opportunity is rapidly closing. In the near future, Electrify America plans to upgrade a significant number of stations to higher charging capacities, substantially reducing charge times for advanced electric vehicles. Tesla, with its extensive Supercharger network, has opened a majority of its ports to rival brands, broadening its revenue potential while maintaining control over its network. IONNA, in collaboration with Circle K, is set to introduce advanced charging hardware at numerous U.S. travel centers over the next few years, capitalizing on existing fuel-retail traffic. Europe's ChargeLeague is integrating thousands of chargers from multiple providers into a unified roaming platform, easing payment challenges for cross-border drivers. BP Pulse, aiming for a large-scale U.S. expansion over the next decade, has placed a significant order for Tesla hardware to establish new charging sites with enhanced capabilities.
Mobile On-Demand Charging Services Gain Traction
Portable systems are designed for venues where trenching or interconnection proves too costly or time-consuming. SparkCharge has developed modular battery packs that, when stacked on a cart, deliver significant power. This innovation substantially reduces roadside assistance times. Meanwhile, FreeWire’s Boost Charger combines a large battery with a high-capacity dispenser. This allows retail hosts to offer fast charging on light-duty panels, eliminating the need for costly transformer upgrades. In recent years, U.S. installations have been adding a considerable number of public fast-charging stations each month. Yet mobile units account for only a small fraction of ports, underscoring a burgeoning niche in the EV Charging As A Service market. During peak holiday seasons, logistics hubs deploy mobile chargers to sidestep the costs of oversized permanent infrastructure. These hubs have reported notable reductions in the total cost of ownership in pilot projects. Additionally, insurers are exploring mobile dispatch as a premium benefit for EV policyholders, contingent on battery packs adhering to established safety standards.
Restraints Impact Analysis of EV Charging As A Service Market*
| Restraints | (~) % Impact on CAGR Forecast | Geographic Relevance | Impact Timeline |
|---|---|---|---|
| High Cap-Ex for Fast Chargers & Grid Upgrades | -3.8% | Global, acute in North America & Europe | Short term (≤ 2 years) |
| Shortage Of Certified Field-Service Technicians | -2.6% | North America, emerging in Europe | Medium term (2-4 years) |
| Interoperability Gaps (CCS Vs NACS Vs CHAdeMO) | -2.1% | North America & Asia-Pacific | Medium term (2-4 years) |
| Volatile Peak-Tariff Exposure For CaaS Operators | -1.9% | North America & Europe | Short term (≤ 2 years) |
| Source: Mordor Intelligence | |||
High Cap-Ex for Fast Chargers and Grid Upgrades
Operators incur high costs to install a single high-capacity dispenser, and these costs increase further if transformers or switchgear require replacement. In some regions, such as parts of California and the UK, interconnection queues can extend for several years, forcing CaaS operators to manage debt obligations before generating revenue. Demand charges are often substantial, and even brief periods of high output can result in considerable monthly fees, despite low average utilization. Battery storage can help mitigate these peak charges, but it adds a notable expense to the site and experiences gradual capacity loss over time due to degradation. Some operators negotiate tariff relief by participating in demand-response programs. However, real-time curtailment under these agreements can limit charger availability during periods of high demand, such as evening peaks.
Interoperability Gaps (CCS Vs NACS Vs CHAdeMO)
Connector fragmentation forces CaaS vendors to stock multiple cable standards, complicating maintenance and inflating inventory. U.S. automakers have largely endorsed NACS since mid-2025, while Europe remains committed to CCS2, producing dual-standard uncertainty for global fleets. CHAdeMO still dominates Japanese public chargers and more than half of Thailand’s installations, requiring multi-protocol dispensers that cost 15% more than single-standard units. Software interoperability lags, too: OCPP 1.6 hosts cannot access new features such as smart-charging profiles available in OCPP 2.0.1, creating upgrade costs for legacy hardware. Cross-network roaming is improving, but latency and authentication failures remain common, lowering driver confidence and pushing some to stick with proprietary ecosystems.
*Our forecasts treat driver/restraint impacts as directional, not additive. The impact forecasts reflect baseline growth, mix effects, and variable interactions.
EV Charging As A Service Market Segment Analysis
By Charger Type:
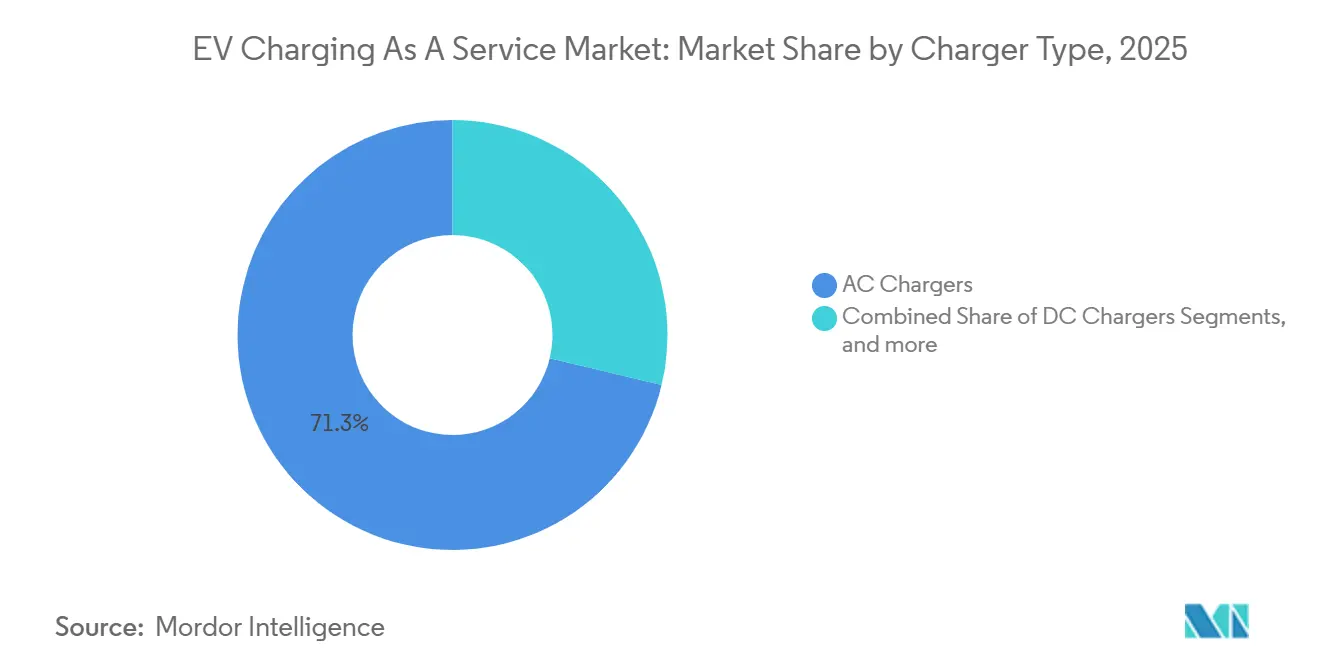
AC Units Dominate, DC Fast-Charging SurgesAC chargers accounted for 71.27% of the EV Charging As A Service market share in 2025 because hosts can plug Level 2 units into existing 208-volt panels for USD 2,000-5,000 in installed cost, a fraction of the investment required for 50 kW DC systems. The EV Charging As A Service market size for AC equipment is projected to scale steadily as workplaces and retail plazas expand curbside amenities that encourage longer dwell times. Lower upkeep—fewer high-voltage parts and passive cooling—enables service providers to offer aggressive uptime guarantees at modest subscription fees.
DC fast chargers are slated to grow at a 27.49% rate through 2031, fueled by 800-volt vehicle architectures such as the Hyundai Ioniq 5 and the Porsche Taycan that can accept 350 kW without throttling. Service providers combat high capex with power-sharing cabinets that distribute capacity among multiple dispensers, raising utilization and shortening payback.


By Fleet Service Type:
Delivery Fleets Drive GrowthCompany cars and motor pools accounted for 27.65% of the EV Charging As A Service market share in 2025, reflecting tax-advantaged benefit schemes that allow employees to charge without corporate capex. This cohort favors AC ports paired with smart cards that track personal versus business usage for reimbursement. The EV Charging As A Service market sees delivery fleets as the fastest-growing segment, projected to grow at a 27.55% CAGR because e-commerce players need predictable depot charging and carbon accounting for last-mile vans.
Passenger ride-hailing and rentals contribute a significant portion of overall revenue, heavily relying on roaming agreements. These agreements offer substantial discounts but require sharing driver data. Municipal transit fleets also account for a notable share of the revenue. Notably, cities like Los Angeles enforce stringent performance-based contracts, mandating high uptime and imposing penalties for any missed departures.
By End-Use:
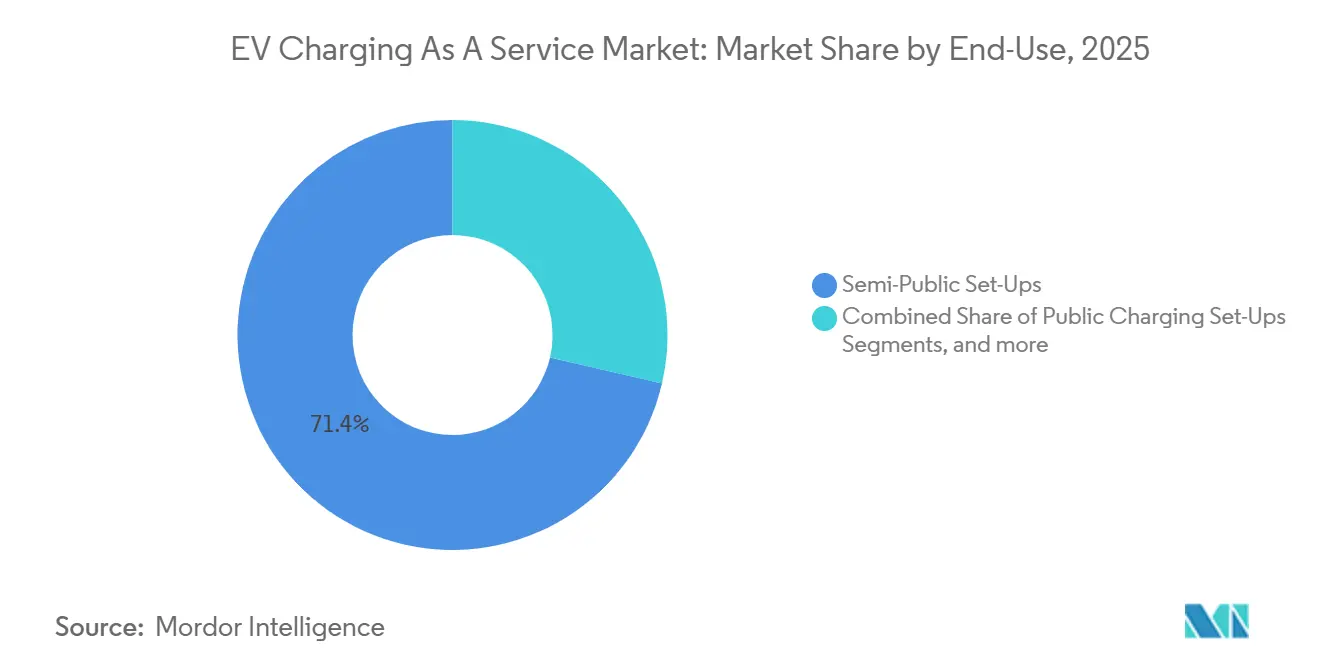
Mobile Charging Disrupts Traditional ModelsSemi-public installations at workplaces and retail sites accounted for 71.38% of the EV Charging As A Service market share in 2025, reflecting employers’ workplace-benefit policies and retailers’ strategies to lengthen shopping trips. Section 30C tax credits, which reimburse a significant portion of equipment and installation costs, are making subscription deals in the EV Charging-as-a-Service market more accessible. While public chargers on highways account for a smaller share of installations, they face longer permitting cycles and higher vandalism risks. As a result, operators are increasingly turning to tamper-resistant enclosures and remote-disabling features. Depot hubs catering to logistics fleets contribute a notable share of revenue. These hubs capitalize on lower electricity tariffs by shifting their load to overnight windows, taking advantage of wholesale prices that frequently drop to minimal levels.
Mobile on-demand charging is forecast to grow at a 27.53% CAGR and serves events, construction sites, and emergency roadside needs where fixed assets are impractical. SparkCharge’s modular platform trims response times while requiring no trenching or transformer upgrade, appealing to insurers that bundle roadside charging into premiums. FreeWire’s battery-buffered unit enables fast charging on sites served by 208-volt panels, opening revenue streams in brownfield lots that lack three-phase service. Because mobile fleets can redeploy assets as demand shifts, utilization risk remains lower than at fixed hubs. However, battery degradation remains a cost input that CaaS vendors must factor into subscriptions.
By Power Output:
Ultra-Fast Charging Reshapes InfrastructureLevel 1 and AC chargers below 22 kW captured 78.34% of the EV Charging As A Service market share in 2025 because they tap existing circuitry and need minimal permitting. The EV Charging As A Service market size for high-power hardware, however, is growing fastest; chargers above 150 kW are predicted at a 27.58% CAGR through 2031 because 800-volt vehicles can now absorb 350 kW without throttling. ABB's Terra HP Gen III modules dynamically distribute capacity across dispensers, significantly reducing per-port capital costs during rare simultaneous peak loads. Delta's HPC 350, utilizing a Vienna Rectifier topology, achieves high efficiency, minimizing energy losses that can diminish operator margins.
Level 2 systems with moderate power output are expected to account for a notable share of installations in the near future, striking a balance between overnight fleet needs and cost considerations. While fast chargers with higher power output represent a smaller portion of installations, they face increasing obsolescence risks as driver expectations evolve. Nonetheless, these mid-tier chargers remain relevant in urban retail areas, where dwell times coincide with shopping or dining. Ultra-fast installations that require substantial grid connections for multi-stall sites often necessitate utility studies, significantly inflating project budgets. To counteract this, operators employ battery energy storage, thereby limiting peak grid draw and facilitating deployment in areas with constrained substation capacity.
Geography Analysis
North America led with 46.21% market share in the EV Charging As A Service market in 2025. This surge was largely driven by a substantial government program, which funds corridor chargers mandated to achieve high uptime - a benchmark that aligns perfectly with specialized service providers. By early 2026, the U.S. was on a roll, adding a considerable number of DC fast-charging stations each month. This effort culminated in a vast network of ports spread across numerous sites. Notably, Tesla emerged as a frontrunner, commanding a majority of the DC stalls and achieving this milestone after opening a significant portion of its ports to brands beyond its own.
Asia-Pacific is forecast to expand at 27.61% CAGR through 2031. In China, a significant transition is underway. The nation's extensive network of chargers is moving from state oversight to private management. This shift empowers operators to integrate ancillary grid services with their utilization fees. Over in India, a major government initiative is championing corridor fast chargers and showing a clear preference for long-term managed-service contracts. Japan is playing its cards too, offering to subsidize a large portion of installation costs. However, there's a catch: vendors must commit to decade-long uptime agreements.
Europe, with its sights set on the future, is reaping the rewards of strategic mandates and alliances. Commanding a significant share of 2025 revenue, Europe's momentum is fueled by a directive to install one public charger for every set number of BEVs. Additionally, the ChargeLeague roaming alliance, which seamlessly integrates chargers across numerous nations, bolsters the continent's standing. The Middle East and Africa, currently holding a modest share, have ambitious targets. The UAE, for instance, is eyeing a substantial number of public fast chargers by 2030.
Mordor Intelligence provides coverage of the ev charging as a service market across other key regional markets, including Europe, each with their regulatory frameworks and demand patterns. Detailed country-level analysis extends to China, India, United States, and South Korea incorporating local coverage and market participation, as required.

Competitive Landscape
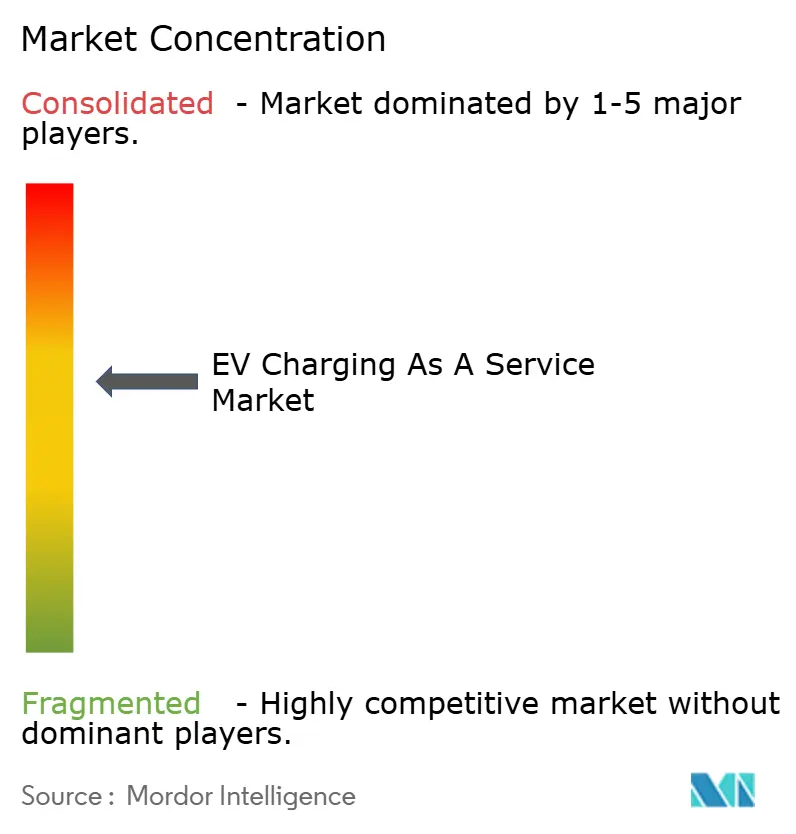
The EV Charging-as-a-Service market is dominated by the top five players—ChargePoint, Tesla, Electrify America, EVgo, and BP Pulse—which control a significant share of installed capacity. Tesla’s Supercharger network dominates the U.S. DC fast-charging market after the NACS opening. This dominance provides Tesla with unparalleled utilization data and energy purchasing power. ChargeLeague has consolidated a substantial number of European chargers under a single subscription, highlighting a trend towards roaming interoperability over direct ownership. IONNA, backed by multiple automakers, plans to install high-capacity dispensers at numerous Circle K locations in the coming years, showcasing OEMs' commitment to infrastructure that ensures brand-neutral reliability.
Vertical integration reigns supreme. ABB and Delta Electronics merge in-house power solutions with cloud tech, achieving significant improvements in predictive maintenance availability. BP Pulse accelerates its rollout by acquiring Tesla hardware, integrating it with its energy-trading desk to navigate tariff fluctuations. Innovators like SparkCharge and FreeWire tap into mobile and battery-buffered solutions, sidestepping interconnection delays—a boon for hosts averse to prolonged waits for grid upgrades. Software advancements now focus on dynamic load management, telematics, and demand-response market participation, unlocking revenues beyond mere kWh sales.
Mergers and partnerships are on the rise. Recently, Volkswagen integrated LOGPAY and Elli into Elli Mobility, streamlining European charging and payment services. This move echoes BP’s strategy of merging retail properties with energy trading benefits. Hardware manufacturers are eyeing software IP to secure long-term customer contracts, while utilities aim to be comprehensive energy and service hubs, maximizing downstream profits. Competitive dynamics are shifting: contracts stipulating penalties for uptime below a certain threshold are now standard in public tenders.
EV Charging As A Service Industry Leaders
ChargePoint Holdings Inc.
Shell Recharge Solutions
Tesla Inc.
ABB Ltd.
BP Pulse (Chargemaster Limited)
- *Disclaimer: Major Players sorted in no particular order
EV Charging As A Service Market Companies Covered in this Report
- ChargePoint Holdings Inc.
- Tesla Inc.
- Shell Recharge Solutions
- BP Pulse (Chargemaster Limited)
- ABB Ltd.
- Electrify America, LLC
- EVgo Services LLC
- TotalEnergies Charging Services, S.A.S.
- Blink Charging Co.
- Enel S.p.A.
- Ionity GmbH
- Fastned B.V.
- Tritium DCFC Ltd
- Pod Point PLC
- SparkCharge Inc.

Recent Industry Developments in EV Charging As A Service Market
- May 2026: Infrastructure specialist Voltera, backed by EQT Infrastructure, merged with urban fast-charging network Revel. Operating under the Voltera brand, the combined platform created a leading Charging-as-a-Service (CaaS) entity focused on high-performance urban charging hubs for ride-hailing operators, heavy logistics fleets, and autonomous vehicles across major US metropolitan areas.
- April 2026: EV charging provider Pod, part of the EDF family, acquired EO Charging to strengthen its commercial fleet and depot charging capabilities. The transaction integrated EO Charging's depot software and management tools with Pod's energy stack to support large-scale commercial operators.
- May 2025: SparkCharge secured USD 30.5 million to expand its mobile charging fleets. The company aims to enhance its operational capacity and cater to the growing demand for adaptable refueling services. The funding will enable the company to scale its infrastructure, improve service efficiency, and meet the increasing needs of electric vehicle users seeking convenient, flexible charging solutions.
- April 2025: ABB E-mobility unveiled the MCS1200 megawatt charger, A200/300 all-in-one units, and the ChargeDock dispenser, broadening solutions for light- and heavy-duty fleets.
- January 2025: Volkswagen merged LOGPAY Transport Services and Elli assets, forming Elli Mobility GmbH to unify charging and payment services across Europe.


Global EV Charging As A Service Market Report Scope
The scope of the report includes Charger Type (AC Chargers and More), Fleet Service Type (Company Vehicles & Motor Pools and More), End-Use (Semi-Public Set-Ups and More), Power Output (Level 1/AC (Below 22 kW) and More), and Geography.
Segmentation Overview
| AC Chargers |
| DC Fast Chargers |
| Wireless / Inductive Chargers |
| Company Vehicles & Motor Pools |
| Delivery & Logistics Fleets |
| Passenger Fleets (Ride-hail, Rental) |
| Municipal & Transit Fleets |
| Semi-Public Set-Ups (Workplace, Retail) |
| Public Charging Set-Ups (Highway, Urban) |
| Depot / Fleet-Hub Charging |
| Mobile On-Demand Charging |
| Level 1 / AC (Below 22 kW) |
| Level 2 (22 - 50 kW) |
| Fast (50 - 150 kW) |
| High-Power (Above 150 kW) |
| North America | United States |
| Canada | |
| Rest of North America | |
| South America | Brazil |
| Argentina | |
| Rest of South America | |
| Europe | United Kingdom |
| Germany | |
| Spain | |
| Italy | |
| France | |
| Russia | |
| Rest of Europe | |
| Asia-Pacific | India |
| China | |
| Japan | |
| Indonesia | |
| Malaysia | |
| Singapore | |
| Vietnam | |
| Philippines | |
| South Korea | |
| Rest of Asia-Pacific | |
| Middle East and Africa | United Arab Emirates |
| Saudi Arabia | |
| Turkey | |
| Egypt | |
| South Africa | |
| Rest of Middle East and Africa |
| By Charger Type | AC Chargers | |
| DC Fast Chargers | ||
| Wireless / Inductive Chargers | ||
| By Fleet Service Type | Company Vehicles & Motor Pools | |
| Delivery & Logistics Fleets | ||
| Passenger Fleets (Ride-hail, Rental) | ||
| Municipal & Transit Fleets | ||
| By End-Use | Semi-Public Set-Ups (Workplace, Retail) | |
| Public Charging Set-Ups (Highway, Urban) | ||
| Depot / Fleet-Hub Charging | ||
| Mobile On-Demand Charging | ||
| By Power Output | Level 1 / AC (Below 22 kW) | |
| Level 2 (22 - 50 kW) | ||
| Fast (50 - 150 kW) | ||
| High-Power (Above 150 kW) | ||
| By Geography | North America | United States |
| Canada | ||
| Rest of North America | ||
| South America | Brazil | |
| Argentina | ||
| Rest of South America | ||
| Europe | United Kingdom | |
| Germany | ||
| Spain | ||
| Italy | ||
| France | ||
| Russia | ||
| Rest of Europe | ||
| Asia-Pacific | India | |
| China | ||
| Japan | ||
| Indonesia | ||
| Malaysia | ||
| Singapore | ||
| Vietnam | ||
| Philippines | ||
| South Korea | ||
| Rest of Asia-Pacific | ||
| Middle East and Africa | United Arab Emirates | |
| Saudi Arabia | ||
| Turkey | ||
| Egypt | ||
| South Africa | ||
| Rest of Middle East and Africa | ||


Key Questions Answered in the Report
How fast is the EV Charging As A Service market expected to grow through 2031?
The Market was valued at USD 185.24 million in 2025, and is projected to grow from USD 236.12 million in 2026 to USD 794.66 million by 2031, registering a CAGR of 27.47% during the forecast period (2026–2031).
Which region will add the most new service revenue by 2031?
Asia-Pacific is forecast to be the fastest-growing region, expanding at a CAGR of 27.61% as China and India transition to private managed service models.
What charger type currently leads deployments?
AC Level 2 units held 71.27% of 2025 revenue because hosts can install them on existing 208-volt panels at minimal cost.
Which fleet segment drives the highest growth?
Delivery and logistics fleets are expected to advance at a 27.55% CAGR because e-commerce giants require depot bundles that include load management and renewable-energy certificates.
What is the main financial barrier for ultra-fast charging stations?
Total installed cost for a single 350 kW dispenser can reach USD 300,000 when grid upgrades are necessary, pushing many hosts to adopt subscription-based CaaS instead of ownership.
How fragmented is the competitive landscape?
The top five providers control about 37% of installed capacity, indicating moderate concentration and significant space for regional or niche entrants.
Page last updated on:


 Your data is secure and never sold or shared.


