
Europe EV Charging As A Service Market Size and Share
Market Overview
| Study Period | 2019 - 2031 |
|---|---|
| Forecast Data Period | 2026 - 2031 |
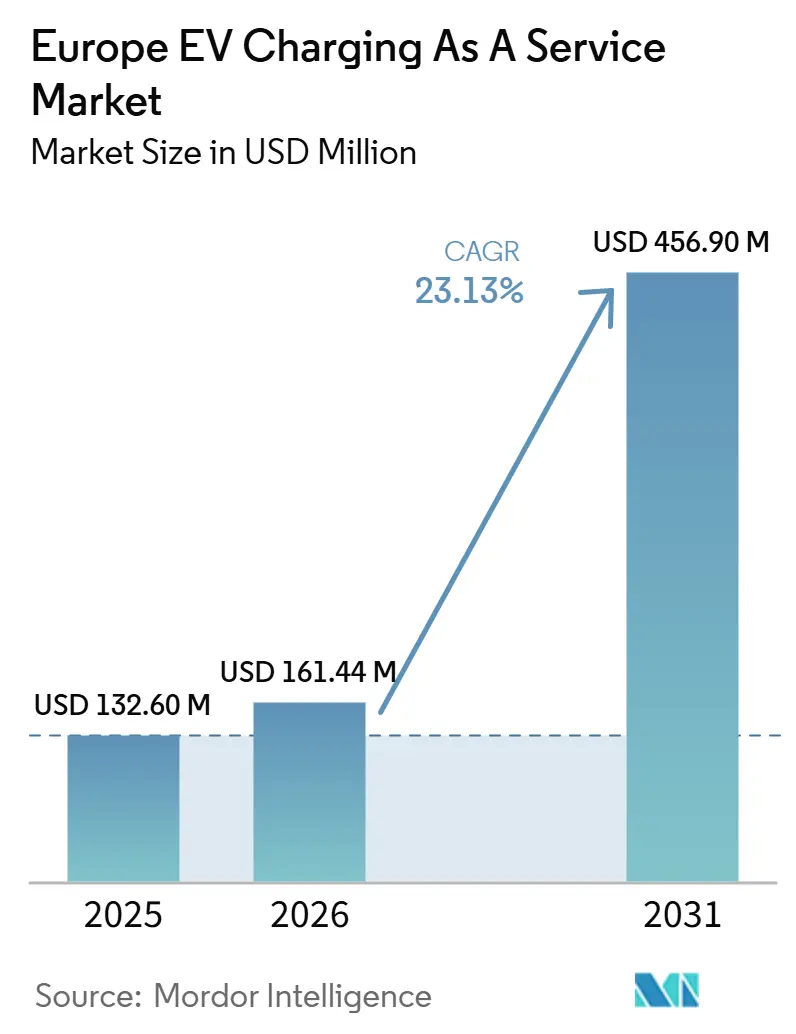
| Base Year Market Size (2025) | USD 132.60 Million |
| Market Size (2026) | USD 161.44 Million |
| Market Size (2031) | USD 456.90 Million |
| Growth Rate (2026 - 2031) | 23.13 % |
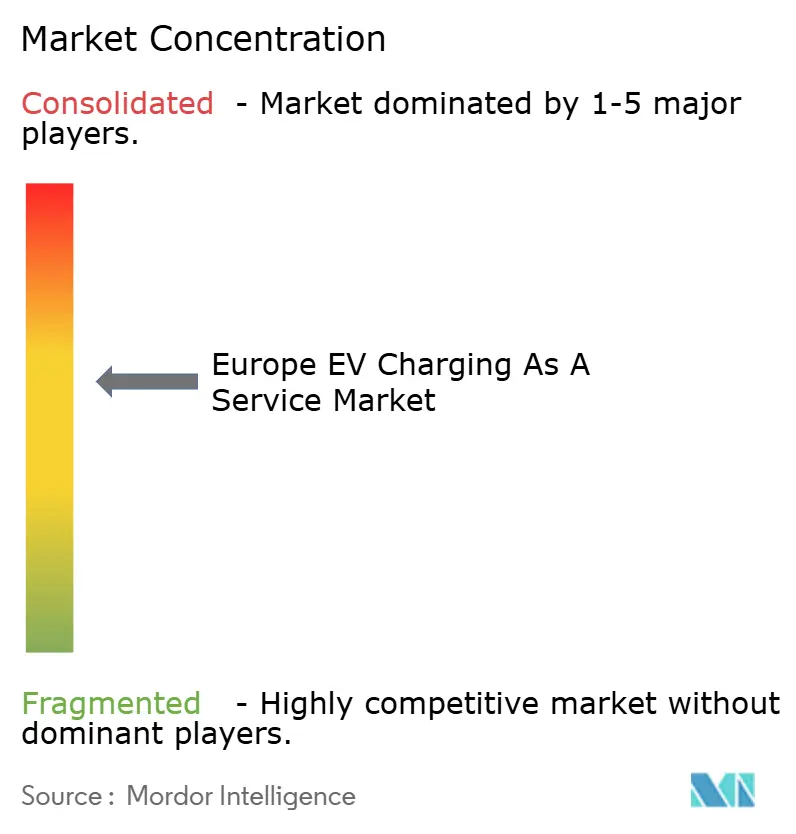
| Market Concentration | Medium |
Major Players *Disclaimer: Major Players sorted in no particular order Image © Mordor Intelligence. Reuse requires attribution under CC BY 4.0. | |
Europe EV Charging As A Service Market Analysis by Mordor Intelligence
The European EV charging as a service market size was valued at USD 132.60 million in 2025 and is estimated to grow from USD 161.44 million in 2026 to reach USD 456.90 million by 2031, at a CAGR of 23.13% during the forecast period (2026-2031). Uptake is accelerating as the EU’s Alternative Fuels Infrastructure Regulation (AFIR) compresses build-out timelines, automakers fund high-power corridors, and large corporates convert fleets to battery-electric models, tilting infrastructure from a capital asset to a recurring-revenue service model[1]“Regulation (EU) 2023/1804 on the Deployment of Alternative Fuels Infrastructure,” European Commission, european-commission.europa.eu. In 2024, the prices for 300-400 kW direct-current (DC) dispensers experienced a significant decline, driven by hardware cost deflation. Concurrently, AI-driven pricing engines enhanced average site utilization. Additionally, bidirectional pilots in Sweden, the Netherlands, and the UK demonstrated the potential to increase charging margins with frequency-regulation fees. Collectively, these developments position the European EV Charging As A Service market as one of the continent’s most rapidly expanding clean-technology sectors, with momentum expected to continue through 2031.
Key Report Takeaways
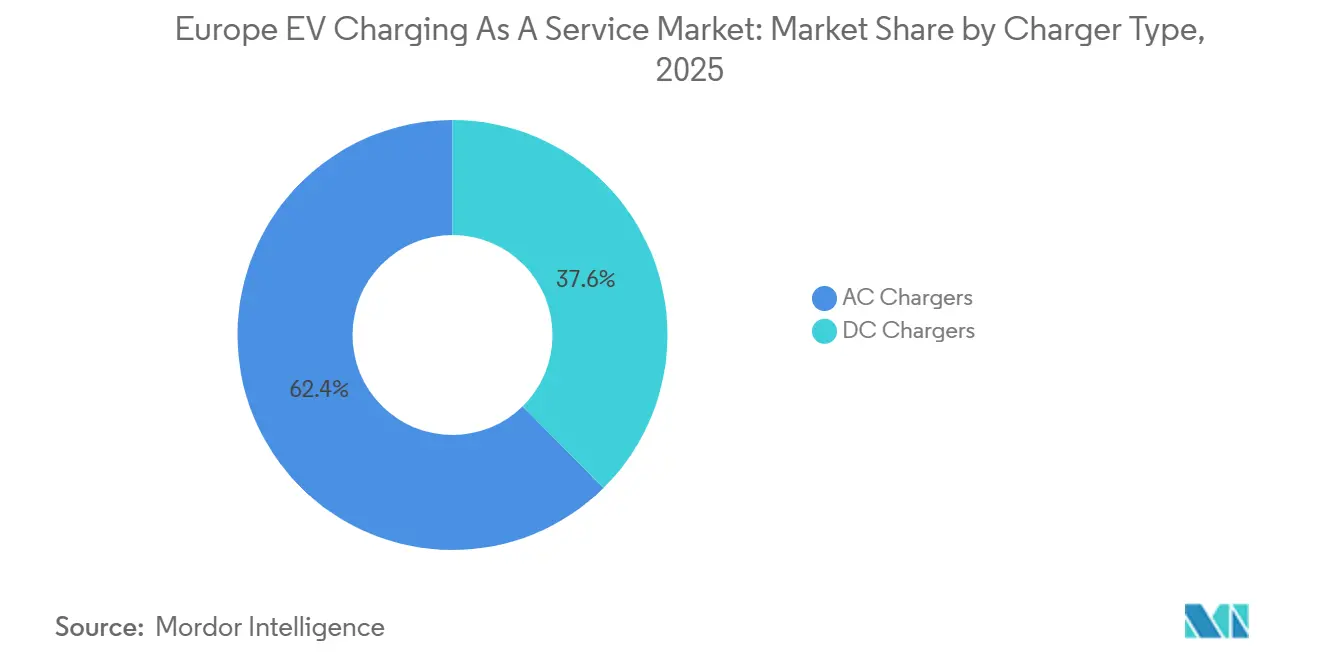
- By charger type, AC systems led with 62.41% of the European EV Charging As A Service market share in 2025, while DC units are forecast to advance at a 26.48% CAGR through 2031.
- By power output, sub-22 kW installations held 49.03% of the European EV Charging As A Service market size in 2025; high-power DC units above 150 kW are poised for the fastest expansion at a 35.28% CAGR.
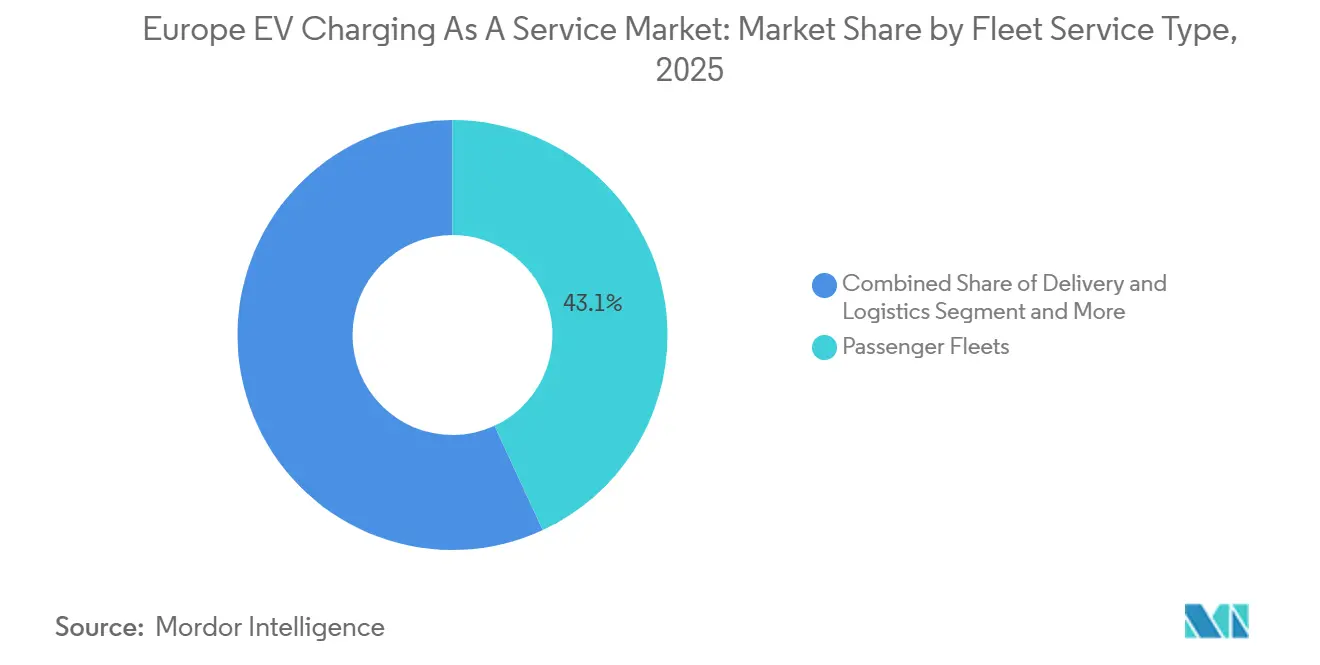
- By fleet service type, passenger fleets captured 43.11% of revenue in 2025, whereas delivery and logistics fleets are projected to grow at a 27.14% CAGR.
- By end-use, public networks accounted for 65.36% of revenue in 2025, while semi-public workplace and depot solutions are rising at a 25.13% CAGR.
- By country, Germany dominated with 24.08% share in 2025, yet Poland is set to record the highest growth at a 23.66% CAGR through 2031.
Note: Market size and forecast figures in this report are generated using Mordor Intelligence’s proprietary estimation framework, updated with the latest available data and insights as of January 2026.
Proportional positioning is established by comparing regional contributions against the global total, including that of Europe. The ev charging as a service market share in our global report expresses these relative weights.
Market Trends and Insights
Drivers Impact Analysis of Europe EV Charging As A Service Market*
| Driver | (~) % Impact on CAGR Forecast | Geographic Relevance | Impact Timeline |
|---|---|---|---|
| EU AFIR and “Fit-for-55” Rollout | +5.2% | Pan-European, strongest along TEN-T corridors | Short term (≤ 2 years) |
| Cost of Above 150 kW DC units | +4.5% | Germany, Netherlands, Norway; spreading across EU | Medium term (2-4 years) |
| OEM-Led Corridor Alliances | +4.1% | Germany, France, United Kingdom, Nordics; expanding east | Medium term (2-4 years) |
| Corporate-Fleet Electrification Mandates | +3.8% | Belgium, Netherlands, France, Germany, United Kingdom | Short term (≤ 2 years) |
| AI-Driven Dynamic-Pricing Engines | +2.9% | Germany, Austria, Netherlands, United Kingdom | Medium term (2-4 years) |
| Renewables Trading and V2G Stacking | +2.6% | Sweden, Netherlands, United Kingdom, Denmark; pilots in Germany | Long term (≥ 4 years) |
| Source: Mordor Intelligence | |||
EU AFIR and “Fit-for-55” Rollout Deadlines
By late 2025, the AFIR required the core Trans-European Transport Network (TEN-T) to establish recharging stations for light-duty vehicles every 60 km, with a minimum capacity of 400 kW. This requirement will be increased to 600 kW by 2027, replacing sub-150 kW hardware on key corridors. The regulation also mandates near-real-time data feeds and contactless payments, which standardize user experience and shrink roaming friction. Poland’s corridor-funding package illustrates how EU capital is filling financing gaps for lagging member states. Germany and France face the steepest compliance curves, yet the penalties for non-conformance beginning in 2026 are accelerating permit approvals and forward-capacity reservations. Overall, AFIR is turning regulatory certainty into a bankable revenue floor for the European EV Charging As A Service market.
Declining Levelized Cost of More Than 150 kW DC Chargers
In 2024, average prices for 300-400 kW dispensers declined, driven by scaled production of modular cabinet designs from Alpitronic, Kempower, and ABB. Kempower’s 1.2 MW Power Unit, which debuted in 2025, allows operators to incrementally boost capacity, significantly reducing per-port CAPEX. Meanwhile, Chinese manufacturers are experimenting with more affordable units, but face potential delays due to cybersecurity certification challenges. As hardware costs decline, project internal rates of return now exceed operator hurdle rates, even on secondary corridors. This shift expands the addressable market for Europe's EV Charging As A Service, reaching beyond just prime motorway locations.
OEM-Led Corridor Alliances (IONITY, CV-Charging Europe)
Automakers are underwriting multi-megawatt hubs to guarantee charging access for their customers. IONITY—backed by BMW, Mercedes-Benz, Ford, Hyundai, and Volkswagen—secured EUR 600 million (~USD 705 million) to expand from 5,000 to 13,000 plugs by 2030, more than 700 of which were already active in the United Kingdom by late 2025 [2]“Network Expansion Update 2025,” IONITY GmbH, ionity.eu. Parallel initiatives for heavy-duty vehicles, including Tesla’s Megacharger trials at up to 1.2 MW aim to capture emerging freight traffic. These alliances generate anchor traffic that independent operators can monetize through later roaming deals, but proprietary apps still fragment the user journey. Medium-term impact is concentrated in Western Europe, with growth corridors into Poland and the Baltic states.
Corporate-Fleet Electrification Mandates
National tax regimes and EU sustainability reporting rules are forcing fleets to shift to battery-electric vehicles, creating captive demand for depot and workplace solutions. Belgium’s requirement that all new company cars be electric from 2026 covers roughly 650,000 vehicles and is already triggering bulk charger procurement. France’s public-sector fleet must be 50% zero-emission by 2030, while Amazon has rolled out 360 kW chargers for a significant number of electric vans across Europe. Operators are responding with turnkey offerings that bundle energy management, maintenance, and dynamic pricing into per-kilowatt-hour contracts, shifting risk away from fleet owners. Short-term impact skews toward Northern and Western Europe, where fiscal penalties for internal-combustion use are highest.
Restraints Impact Analysis of Europe EV Charging As A Service Market*
| Restraint | (~) % Impact on CAGR Forecast | Geographic Relevance | Impact Timeline |
|---|---|---|---|
| Grid Delays and Capacity Bottlenecks | -3.7% | Poland, France, Italy, Spain; urban Berlin, Paris, Madrid | Short term (≤ 2 years) |
| Upfront CAPEX/ROI Risk | -2.9% | Rural Eastern Europe, Iberia; secondary German & French routes | Medium term (2-4 years) |
| Software-Stack Fragmentation/Roaming | -2.3% | Cross-border corridors, multi-operator hubs | Short term (≤ 2 years) |
| Swapping Stations as Substitute | -1.8% | Germany, Netherlands, Nordics | Medium term (2-4 years) |
| Source: Mordor Intelligence | |||
Grid-Connection Delays and Capacity Bottlenecks
In Poland, France, Italy, and Spain, distribution-system operators frequently take extended periods to approve medium-voltage upgrades for high-power sites. This delay stalls corridor deployment, especially as AFIR deadlines loom closer. In 2025, a significant portion of fast-charging applications in Berlin and Munich faced prolonged processing times. This led operators to either scale back their plans or abandon requests altogether. Italy allocated substantial funds from its post-pandemic recovery initiative for charging infrastructure. However, by the end of 2025, only a fraction of the designated sites gained grid access. While EU market-design reforms are set to expedite approvals by 2028, the repercussions of these delays are already evident in project backlogs and postponed revenues.
High Upfront CAPEX/ROI Risk at Low-Traffic Sites
While profitability relies on achieving adequate utilization rates, many rural and secondary-corridor hubs find it challenging to reach sufficient levels. In these areas, thin throughput can lead demand charges to consume a significant portion of operating costs. Although Spain’s MOVES III subsidy helps mitigate some capital expenses, the uptake in Castilla y León lags behind Madrid. To offset fixed costs, operators are increasingly clustering units at destination retail locations. A case in point is Powerdot’s hub situated just outside Barcelona. However, a financing gap remains for corridors that are truly in the “middle-of-nowhere.”
*Our forecasts treat driver/restraint impacts as directional, not additive. The impact forecasts reflect baseline growth, mix effects, and variable interactions.
Europe EV Charging As A Service Market Segment Analysis
By Charger Type:
AC Dominance Yields to DC VelocityAC posts held 62.41% of 2025 revenue, but their grip is loosening as fleets value faster turnaround times. At municipal curbsides and office carparks, low-power AC remains the lowest-cost path to coverage, especially where overnight dwell aligns with off-peak tariffs. Yet AFIR’s technical minimums and corporate uptime targets are tilting fresh investment toward high-power DC, most visibly on TEN-T core corridors. Operators prioritizing Europe EV Charging As A Service market size expansion are therefore reallocating capital from slow AC infill to corridor DC hubs that promise higher ticket sizes and ancillary grid-service revenue.
Ultra-fast DCs’ appeal rests on both user convenience and headline economics, and is set to expand at a 26.48% CAGR through 2031. IONITY’s expansion financing, Kempower’s modular cabinets, and Tesla’s 500 kW V4 dispensers combine to double site throughput without doubling land or connection costs. Operators that already command AC footprints are adding DC islands to defend share, while new entrants skip straight to high-power hardware. As these dynamics unfold, the share of AC in the European EV Charging As A Service market will continue to decline, even though absolute AC volumes will still inch upward alongside the region’s EV parc.


By Power Output:
High-Power DC Rewrites Corridor EconomicsSub-22 kW units represented 49.03% of 2025 revenue, but their utility on motorway routes is fading. AFIR’s 400 kW site-level mandate pushes operators toward 350–400 kW dispensers today to future-proof assets. The cost drop for 300–400 kW hardware has narrowed the price gap with 50–150 kW models, tipping many investors toward the higher-throughput option. Consequently, high-power DC (above 150 kW) will capture the largest share of new capital allocations in the European EV Charging-as-a-Service market, growing at a 35.28% CAGR.
Megawatt-scale charging is the next frontier. Kempower’s 1.2 MW cabinets and Tesla’s Megacharger trials signal readiness for long-haul trucks, while EU-backed CV-Charging Europe is standardizing the MCS 3.2 connector [3]“1.2 MW Power Unit Launch,” Kempower Oyj, kempower.com . Early pilot feedback indicates that megawatt hubs can reach profitability at as low as 7–8% utilization, largely thanks to premium tariffs justified by time savings. Over 2026–2031, high-power DC will therefore shoulder most of the growth in Europe's EV Charging As A Service market, compressing the mid-power segment into niche roles such as park-&-ride lots.
By Fleet Service Type:
Delivery and Logistics Outpace Passenger GrowthPassenger mobility dominated initial service revenues with 43.11% market share in 2025, reflecting ride-hailing electrification and corporate car policies. However, last-mile logistics fleets are scaling fastest, posting a 27.14% CAGR that outstrips passenger demand. Depot-centric charging bundles, demand-response software, and V2G revenue stacking make turnkey contracts attractive for parcel operators, which in turn deepens engagement for the European EV Charging As A Service market.
Passenger-fleet operators still lean on public networks for en-route “top-ups,” but logistics fleets increasingly require bespoke megawatt solutions that public players seldom host. That divergence is prompting network specialists to spin up dedicated business units for depots and warehouses. In the long run, logistics electrification will supply the highest incremental kilowatt-hours, anchoring utilization at sites that otherwise risk underuse outside commuter peaks, thereby safeguarding Europe's EV Charging As A Service market share for operators that pivot early.

By End-Use:
Semi-Public Gains as Corporates Internalize ChargingPublic networks collected 65.36% of 2025 revenue, a legacy of corridor build-outs and destination charging at retail centers. Yet semi-public solutions—restricted to specific user groups such as office staff or fleet drivers—are growing at 25.13% CAGR. Fiscal incentives in Belgium, France, and Germany reward employers for workplace infrastructure, and depreciation allowances shorten payback periods. Operators bundling renewable power purchase agreements with hardware leasing appeal to sustainability officers keen on Scope-2 emission reductions.
As a result, many retail-anchored networks are partitioning bays for loyalty-card holders, blurring public-versus-semi-public lines. For providers chasing Europe EV Charging As A Service market size, the next wave of contracts sits in this controlled-access category, where customer density is predictable, and payment default risk is low. By 2031, semi-public volumes are forecast to offset the public segment’s share dilution, even as total energy dispensed via open networks continues to expand.
Geography Analysis
Germany and Poland EV Charging As a Service Market
Germany’s corridor density and OEM sponsorship translated into 24.08% of 2025 revenues, yet the country’s operators are now optimizing pricing algorithms to squeeze margins rather than merely adding plugs. Shell’s real-time tariff system lifted average utilization, illustrating a nationwide pivot from build-out to yield management. Poland, meanwhile, is scaling from a far lower base but enjoys EU co-financing that de-risks high-power hubs along the A2 and S8 highways, underpinning a 23.66% CAGR projection through 2031.
Northern Europe EV Charging As a Service Market
In Northern Europe, Norway's dominance in EV sales has largely met its physical coverage needs. Now, the spotlight shifts to upgrading to advanced equipment and integrating Vehicle-to-Grid (V2G) technology for ancillary-service revenue. Meanwhile, Sweden, though smaller, plays a pivotal role in conducting bidirectional trials that benefit the broader region. The Netherlands leads Europe in charger density. However, grid congestion issues near Amsterdam and Rotterdam are steering new installations towards suburban logistics parks, altering traffic dynamics in the European EV Charging As A Service market.
Southern Europe EV Charging As a Service Market
Southern Europe is witnessing a surge, albeit from a lower starting point. France achieved a significant milestone in 2025. Yet, the nation grapples with utility approval delays for ultra-fast sites. Such delays pose a risk of non-compliance with the Alternative Fuels Infrastructure Regulation (AFIR) if timelines aren't expedited. Italy is channeling recovery funds to address its infrastructure shortfalls. In contrast, Spain's grants aim to offset the economic challenges posed by weak rural traffic. The United Kingdom, having stepped outside EU regulations post-Brexit, still aligns with AFIR power standards through its domestic mandates. This alignment not only ensures the viability of cross-Channel roaming but also bolsters the overall coherence of the European EV Charging As A Service market.
Mordor Intelligence examines the ev charging as a service market across diverse other regional markets as well, offering granular country-level perspectives for China, India, United States, and South Korea and more.
Competitive Landscape
The market remains moderately fragmented. Oil majors like Shell Recharge, BP Pulse, and TotalEnergies employ dense retail footprints to scale networks rapidly. Shell added significantly more points in 2025 and folded the estate into Hubject’s roaming platform to cut authentication failures. BP Pulse targets highly trafficked urban corridors, evidenced by its 180-stall NEC Birmingham Gigahub, underscoring capital intensity barriers to entry.
Pure-play operators Fastned, Allego, and IONITY differentiate on site quality and user experience. Fastned secured EUR 200 million (~USD 235 million) in January 2026, reserving half for rollouts in Belgium and Switzerland, while Allego leverages partnerships with Carrefour and Burger King to monetize retail dwell time [4]“EUR 200 Million Financing Announcement,” Fastned B.V., fastnedcharging.com. Technology specialists like Kempower and Virta are supplying modular hardware and cloud stacks. Virta, for instance, orchestrates chargers across multiple countries. This capability enables smaller landlords to engage in the European EV Charging As A Service industry without the need for outright infrastructure ownership.
Emerging contenders in the market include NIO’s battery-swap model and various software platforms that focus on aggregating idle vehicle capacity for grid services. Starting in 2027, all refurbished stations will need to comply with ISO 15118 standards. This compliance is poised to benefit early adopters who can offer the plug-and-charge convenience. The path to scaling in the European EV Charging As A Service market hinges on a blend of hardware cost leadership, software-driven utilization enhancements, and strategic land acquisitions. These elements collectively determine the long-term frontrunners in the industry.
Europe EV Charging As A Service Industry Leaders
Allego B.V.
IONITY
Fastned
Enel Group
BP Pulse
- *Disclaimer: Major Players sorted in no particular order
Europe EV Charging As A Service Market Companies Covered in this Report
- Allego B.V.
- IONITY
- Fastned
- Enel Group
- ChargePoint, Inc.
- BP Pulse
- Shell Recharge
- TotalEnergies Charging Services
- Tesla, Inc.
- Pod Point
- Mer Germany GmbH
- Electra
- GreenWay
- Virta
- Powerdot
- Kempower

Recent Industry Developments in Europe EV Charging As A Service Market
- April 2026: Renault Group consolidated all charging activities under the new “Plug Inn” brand to streamline infrastructure strategy across Europe.
- January 2026: Arrive partnered with Spirii to integrate parking and EV charging within the EasyPark app, expanding user reach across multiple EU countries.
- January 2026: Eleport secured EUR 35 million (~USD 41 million) from the European Investment Bank to build over 250 fast-charging hubs in eight Central and Eastern European nations.
- November 2025: ChargeEuropa and retail-park owner NAPOLLO agreed to deploy chargers at N-Park locations across Poland, with first installations scheduled for Q1 2026.


Europe EV Charging As A Service Market Report Scope
The scope includes segmentation by charger type (AC chargers and DC chargers), power output (level 1/ac (less than 22 kW), level 2 (22 to 50 kW), fast DC (50 to 150 kW), and high-power DC (more than 150 kW)), fleet service type (company vehicles and motor pools, delivery and logistics, and passenger fleets), and end-use (semi-public charging setup and public charging setup). The analysis also covers country-level segmentation, including Germany, the United Kingdom, France, Italy, Spain, the Netherlands, Norway, Sweden, Denmark, Poland, and the rest of Europe. Market size and growth forecasts are presented by value in USD.
| AC Chargers |
| DC Chargers |
| Level 1/AC (Less than 22 kW) |
| Level 2 (22 to 50 kW) |
| Fast DC (50 to 150 kW) |
| High-Power DC (More than 150 kW) |
| Company Vehicles and Motor Pools |
| Delivery and Logistics |
| Passenger Fleets |
| Semi-Public Charging Setup |
| Public Charging Setup |
| Germany |
| United Kingdom |
| France |
| Italy |
| Spain |
| Netherlands |
| Norway |
| Sweden |
| Denmark |
| Poland |
| Rest of Europe |
| By Charger Type | AC Chargers |
| DC Chargers | |
| By Power Output | Level 1/AC (Less than 22 kW) |
| Level 2 (22 to 50 kW) | |
| Fast DC (50 to 150 kW) | |
| High-Power DC (More than 150 kW) | |
| By Fleet Service Type | Company Vehicles and Motor Pools |
| Delivery and Logistics | |
| Passenger Fleets | |
| By End-use | Semi-Public Charging Setup |
| Public Charging Setup | |
| By Country | Germany |
| United Kingdom | |
| France | |
| Italy | |
| Spain | |
| Netherlands | |
| Norway | |
| Sweden | |
| Denmark | |
| Poland | |
| Rest of Europe |


Key Questions Answered in the Report
How large will the European EV Charging As A Service market be by 2031?
It is forecast to reach USD 456.90 million in value, reflecting a 23.13% CAGR from 2026 to 2031.
Which charger type is expanding fastest in Europe?
DC units above 150 kW post the strongest trajectory, rising at 26.48% CAGR as AFIR pushes minimum corridor power to 400 kW by 2028.
What role do AI-driven pricing engines play in charging economics?
Dynamic tariffs tuned to real-time grid and demand data have raised average site utilization by around 12%, directly improving operator margins.
Are battery-swapping stations a threat to charging-as-a-service models?
Swap sites offer two-minute energy replenishment, but high installation costs and limited vehicle compatibility confine them to dense fleet corridors for now.
Page last updated on:


 Your data is secure and never sold or shared.


