
United States EV Charging As A Service Market Size and Share
Market Overview
| Study Period | 2019 - 2031 |
|---|---|
| Forecast Data Period | 2026 - 2031 |
| Base Year Market Size (2025) | USD 82.70 Million |
| Market Size (2026) | USD 100.89 Million |
| Market Size (2031) | USD 263.01 Million |
| Growth Rate (2026 - 2031) | 21.12 % |
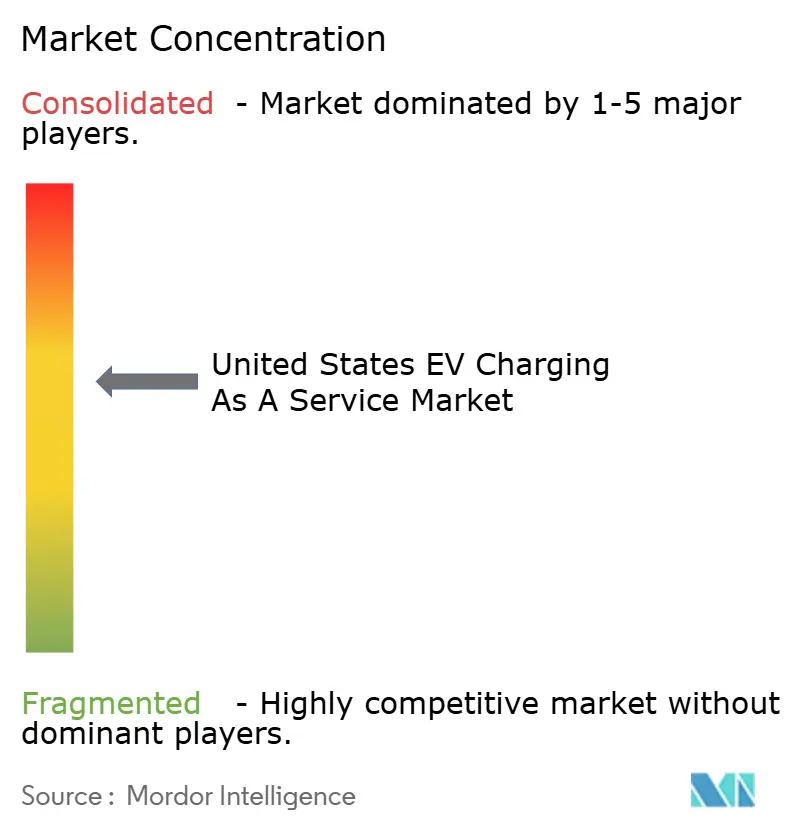
| Market Concentration | Medium |
Major Players *Disclaimer: Major Players sorted in no particular order Image © Mordor Intelligence. Reuse requires attribution under CC BY 4.0. | |
United States EV Charging As A Service Market Analysis by Mordor Intelligence
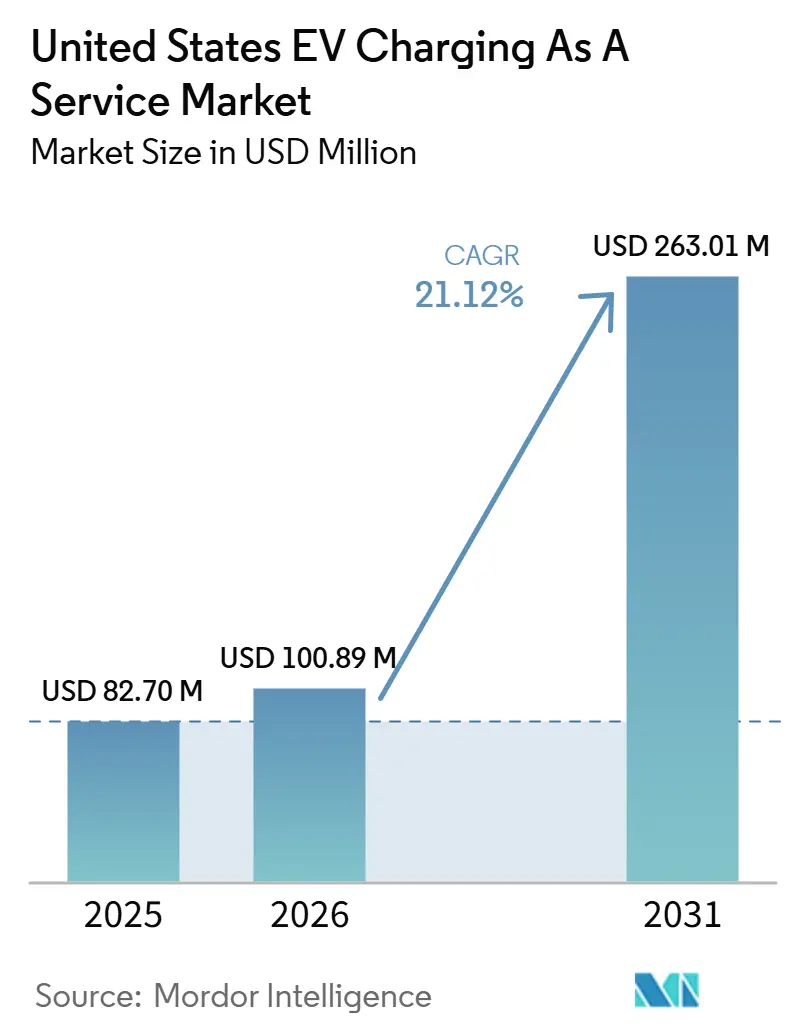
The United States EV Charging As A Service market size was valued at USD 82.70 million in 2025 and estimated to grow from USD 100.89 million in 2026 to reach USD 263.01 million by 2031, at a CAGR of 21.12% during the forecast period (2026-2031). The United States EV Charging As A Service market is benefiting from the USD 5 billion NEVI program that ties federal dollars to a 97% quarterly-measured uptime threshold, forcing operators to adopt predictive maintenance rather than reactive truck rolls [1]. Platform providers that aggregate diagnostics across thousands of chargers are capturing share because legacy petroleum retailers struggle to match software capabilities. Corporate ESG mandates are locking fleets into multi-year Charging-as-a-Service subscriptions that shield operators from electricity-market volatility, while connector commoditization following Tesla’s 2025 NACS licensing deal is shifting competitive focus to software and energy-management differentiation.
Key Report Takeaways
- By charger type, AC Level 2 led with 72.31% of the United States EV Charging As A Service market share in 2025; DC fast chargers are forecast to grow at a 25.36% CAGR through 2031.
- By power output, Level 2 (22-50 kW) accounted for 67.04% share of the United States EV Charging As A Service market size in 2025, while units above 150 kW are poised for a 29.45% CAGR to 2031.
- By fleet service type, company vehicles and motor pools held 46.34% revenue share in 2025; delivery and logistics fleets are the fastest-growing segment at a 27.16% CAGR to 2031.
- By end-use, semi-public installations captured 59.11% share in 2025, whereas public corridor sites are advancing at a 22.84% CAGR.
- By customer business model, subscriptions represented 48.16% of 2025 revenue, and hybrid plans are expanding at a 22.56% CAGR.
- By region, the West commanded 37.18% revenue in 2025; the South is the fastest-growing region with a 21.74% CAGR to 2031.
Note: Market size and forecast figures in this report are generated using Mordor Intelligence’s proprietary estimation framework, updated with the latest available data and insights as of January 2026.
Global valuation is built by aggregating outputs from multiple countries and regions, with United states being one of the contributors. Our global ev charging as a service market size represents that cumulative total.
United States EV Charging As A Service Market Trends and Insights
Drivers Impact Analysis*
| Driver | (~) % Impact on CAGR Forecast | Geographic Relevance | Impact Timeline |
|---|---|---|---|
| NEVI Federal-State Funding | +4.8% | National, early focus on the West and the South | Short term (≤ 2 years) |
| Corporate Fleet-Electrification Mandates | +3.9% | National, logistics hubs, Northeast, and West | Medium term (2-4 years) |
| Declining Battery-Pack Costs | +3.2% | National, price-sensitive Midwest and South | Medium term (2-4 years) |
| Subscription-Ready Tariffs Cut Capex | +2.7% | West and Northeast pilots | Long term (≥ 4 years) |
| Predictive Maintenance Boosts Uptime | +2.4% | National | Short term (≤ 2 years) |
| Idle-Fee Revenue-Sharing Models | +1.6% | National, with early adoption in the West and Northeast | Medium term (2-4 years) |
| Source: Mordor Intelligence | |||
NEVI Federal-State Funding Roll-Out
The NEVI program allocates USD 5 billion and requires each funded site to offer four 150 kW ports, 24/7 access, and 97% uptime, accelerating project schedules and excluding vendors without remote-monitoring depth. By early 2026, Texas allocated significant funding across numerous corridor locations, with several active sites and many more under development. Similarly, Ohio, New York, and Michigan established comparable targets, frequently linking awards to equity metrics to direct funds into underserved neighborhoods.
Corporate ESG Fleet-Electrification Mandates
Amazon, UPS, and DB Schenker have committed to electrifying their last-mile fleets by 2030. This move is spurring a demand for depot-charging solutions, particularly those that offer bundled services encompassing hardware, software, and maintenance. In California, WattEV's truck hubs are successfully recharging Class 8 tractors within a short time frame, underscoring the viability of high-power models for regional hauling.
Declining Battery-Pack Costs Reach TCO Parity
Argonne National Laboratory anticipates a significant reduction in lithium-ion pack costs by 2035, driven by supportive policies such as production credits introduced under the Inflation Reduction Act. This development is expected to accelerate the adoption of electric vehicles, particularly as the total cost of ownership becomes more favorable for medium-range delivery routes. As a result, the United States EV Charging As A Service market is increasingly targeting fleets that had previously postponed electrification due to financial constraints.
Utility Subscription-Ready Tariffs Cut Capex
Utilities in California and New York have introduced subscription tariffs. These tariffs integrate interconnection, upgrades, and fixed time-of-use rates into a single monthly fee. This approach significantly reduces the financial burden for site hosts by lowering upfront costs. However, depot economics in several regions continue to face challenges due to demand-charge increases during peak periods, which remain a concern for sustainable operations.
Restraints Impact Analysis*
| Restraint | (~) % Impact on CAGR Forecast | Geographic Relevance | Impact Timeline |
|---|---|---|---|
| High Grid-Upgrade Costs | -2.8% | West and Northeast | Short term (≤ 2 years) |
| Interoperability and Payment-Standard | -1.9% | National | Medium term (2-4 years) |
| Demand Charges in Utility Territories | -1.6% | West and Northeast | Long term (≥ 4 years) |
| Penalty Clauses in NEVI Contracts | -1.3% | National | Short term (≤ 2 years) |
| Source: Mordor Intelligence | |||
High Grid-Upgrade Costs for DC Fast Sites
In California, interconnection queues can take several years to process, and upgrading transformers involves significant financial and logistical challenges. These factors often lead to increased budgets and a focus on investments in areas with higher capacity. However, FreeWire's battery-integrated chargers, developed as part of a collaboration with BP Pulse, address some of these challenges by providing an efficient solution to manage peak demand and reduce dependency on extensive infrastructure upgrades.
Interoperability and Payment-Standard Fragmentation
Although Plug-and-Charge under ISO 15118 holds significant potential, its adoption continues to face challenges, resulting in inconsistent implementation across networks. At the same time, legacy networks are still navigating the transition between OCPP 1.6 and 2.0.1, which forces drivers to rely on multiple apps to access charging services. In addition, ChargePoint's decision to introduce a per-session network fee in recent years has triggered notable resistance from site hosts, emphasizing the ongoing concerns surrounding proprietary payment systems and their impact on stakeholders.
*Our forecasts treat driver/restraint impacts as directional, not additive. The impact forecasts reflect baseline growth, mix effects, and variable interactions.
Segment Analysis
By Charger Type: AC Dominance Yields to DC Speed
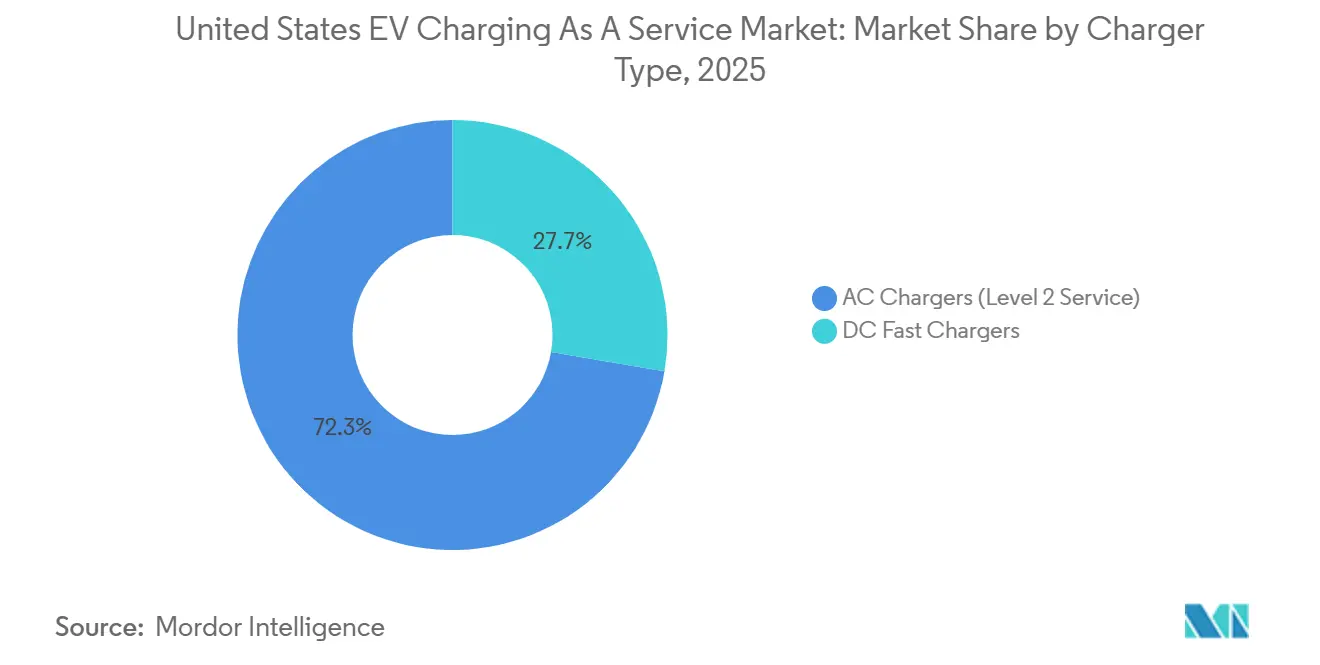
AC Level 2 units supplied 72.31% of 2025 revenue in the United States EV Charging As A Service market, anchored in workplaces and multi-family garages where 6-hour dwell times align with usage patterns. DC fast systems, however, are projected for a 25.36% CAGR as logistics fleets and corridor travelers demand sub-30-minute stops. Tesla’s 2025 decision to open NACS and its Supercharger network diverted differentiation toward software-layer services that optimize energy loads [2].
In semi-public lots, hardware economics continue to favor AC charging, which remains more cost-effective compared to DC fast charging. However, battery-integrated DC solutions from companies like FreeWire and Voltera are reducing grid footprints. This innovation allows for new deployment sites without the added expense of transformers. Consequently, the United States EV Charging As A Service market is seeing established players, such as ChargePoint, pivoting their strategies. ChargePoint has placed orders for advanced Omni Port units, targeting fleet customers.
By Power Output: High-Power Units Redefine Turnaround
Level 2 chargers rated 22-50 kW held 67.04% share of the United States EV Charging As A Service market size in 2025, driven by lower capex and grid friendliness. Chargers above 150 kW will post a 29.45% CAGR because battery-electric trucks must match diesel dwell times; WattEV’s 350 kW truck stops already replenish 80% SOC in 90 minutes.
Mid-range 50-150 kW systems appeal to light-commercial fleets where 15-45-minute sessions are acceptable. Rivian's network, spanning multiple sites, recorded high reliability in 2025, underscoring the importance of reliability alongside brand strength. With the evolution of battery chemistries, the United States EV Charging As A Service market is poised to harmonize ultra-high power installations with intelligent load sharing, optimizing site throughput.
By Fleet Service Type: Delivery and Logistics Accelerate
Company vehicles and motor pools accounted for 46.34% of 2025 revenue in the United States EV Charging As A Service market, owing to predictable duty cycles that simplify load management. Delivery and logistics fleets, however, will grow at a 27.16% CAGR, powered by Amazon’s 100,000-van commitment and UPS’s plan for 10,000 on-site chargers.
These customers favor integrated telematics, energy-management software, and single invoices—capabilities that smaller regional operators struggle to provide. Merchants Fleet and EVgo illustrate this shift with 200 managed-charging sites executed on subscription terms that convert capex into opex. As more last-mile carriers chase Scope 3 targets, the United States EV Charging As A Service industry is poised for rapid fleet-centric growth.
By End-Use: Semi-Public Sites Dominate, Public Corridors Gain
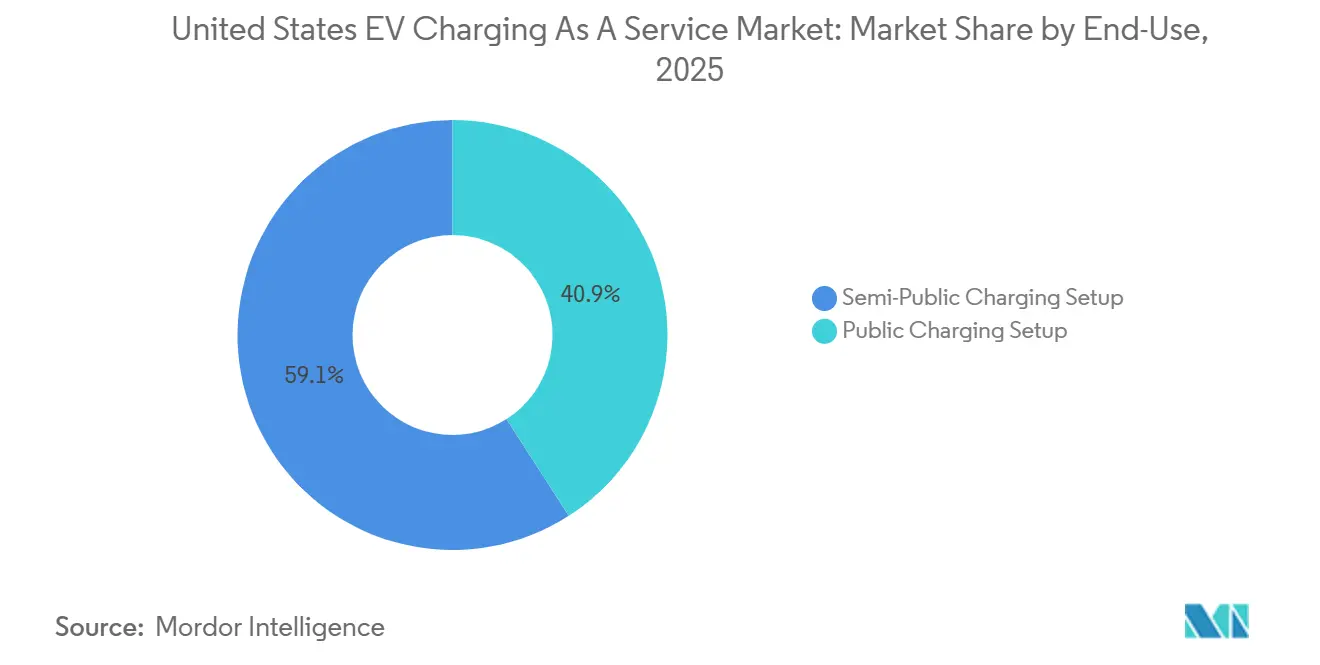
Semi-public sites, often at workplaces and multifamily housing, captured 59.11% of 2025 revenue within the United States EV Charging As A Service market. Their predictable user base lets operators deploy lower-cost AC hardware and negotiate idle-fee sharing with property owners. Public corridor installations will expand at 22.84% CAGR under NEVI, despite higher vandalism risk and capex, because corridor density is essential to alleviate range anxiety.
Shell Recharge leverages its fuel-retail real estate to locate 109-180 kW chargers on existing forecourts, while FLO’s 320 kW units backstop rural gaps via utility partnerships. Although public sites face variable utilization, per-kWh pricing offsets these risks and sustains continued investment.
By Customer Business Model: Subscriptions Lock Revenue, Hybrids Gain
Subscriptions generated 48.16% of 2025 customer revenue in the United States EV Charging As A Service market, appealing to fleets that need budget predictability. Hybrids blending a fixed fee plus usage are rising at 22.56% CAGR, allowing flexibility during seasonal peaks without forfeiting volume discounts. EVgo's PlusMax, offering reduced energy rates through a monthly subscription, serves as a prime example of the evolving model.
In areas with transient traffic, where anonymity curtails subscription adoption, a pay-per-use model prevails. ChargePoint's network fee adjustments in 2026 led to increased customer churn towards open-protocol competitors, highlighting the industry's price sensitivity. With diminishing switching costs, the U.S. EV Charging As A Service sector is poised to favor providers who can craft dynamic plans tailored to varied fleet needs.
Geography Analysis
The West maintained 37.18% of 2025 revenue in the United States EV Charging As A Service market, bolstered by California's ZEV mandate and favorable off-peak utility tariffs [3]. However, the region grapples with challenges: interconnection delays spanning months and high transformer costs, both hindering the swift deployment of DC fast chargers. While Oregon and Washington have adopted policies akin to California's, they confront rural coverage challenges, leading to the introduction of mobile battery-backed chargers.
The South is projected as the fastest-growing region at 21.74% CAGR. Texas has experienced a surge in EV registrations over the years and is heavily investing in NEVI corridor sites. Houston is actively working to expand its infrastructure with additional municipal chargers. Meanwhile, Florida and Georgia are focusing on enhancing EV infrastructure along key corridors, though they still trail California in charger density on a per-capita basis.
The Northeast capitalizes on its urban density and robust incentives. New York's EvolveNY initiative aims to significantly expand Level 2 and DC charging ports. Additionally, Consolidated Edison's subscription tariff ingeniously shifts the grid-upgrade risk onto the utility. Massachusetts and New Jersey are jointly investing in sites monitored for optimal uptime. In the Midwest, states are pivoting their manufacturing corridors, with Michigan leading efforts by allocating substantial resources across strategic locations.
Coverage of the ev charging as a service market by Mordor Intelligence spans a wide geographic footprint, with regional analysis available for Europe, alongside detailed country-level intelligence for China, India, and South Korea, each shaped by local operating conditions.
Competitive Landscape
In the United States EV Charging As A Service market, key players like Tesla, ChargePoint, Electrify America, and EVgo dominate the public DC capacity landscape. With Tesla's 2025 move to license NACS connectors, the focus has shifted from hardware to software innovations, dynamic load balancing, and fleet telematics. Meanwhile, ChargePoint's 2026 announcement of network fees led to site-hosts gravitating towards open-protocol providers, notably EV Connect, underscoring the market's price sensitivity.
Battery-integrated firms, like FreeWire, are making strategic moves, partnering with BP Pulse for a rollout, and zeroing in on grid-constrained locales. Companies like Voltera and Francis Energy are carving out a niche, setting up modular hubs in secondary markets often overlooked by industry giants. These modular hubs address the growing demand for charging infrastructure in underserved areas, providing a competitive edge to these companies. By targeting locations that incumbents often skip, these firms are expanding the accessibility of EV charging and addressing critical gaps in the market.
IONNA, a joint venture of automakers, has rapidly established its presence, launching 100 sites with over 1,100 bays by early 2026, signaling that OEMs see charging as pivotal for customer retention [4]. This strategy highlights the growing importance of charging infrastructure as a tool for enhancing brand loyalty and customer satisfaction. Additionally, Rivian's impressive uptime and usage by non-Rivian vehicles demonstrate that reliability can transcend brand boundaries, setting a benchmark for the industry. These developments emphasize the evolving dynamics of the market, where reliability, accessibility, and customer-centric strategies are becoming key differentiators.
United States EV Charging As A Service Industry Leaders
-
ChargePoint, Inc.
-
Tesla, Inc.
-
Electrify America
-
EVgo Inc.
-
Blink Charging Co.
- *Disclaimer: Major Players sorted in no particular order
Recent Industry Developments
- April 2026: Ohio DOT selected 64 new fast-charging sites backed by USD 51 million in NEVI funding.
- March 2026: New York City DOT and NYPA opened an eight-stall 360 kW public station in Flushing, Queens, the first of ten planned urban sites.
- January 2026: Washington State DOT awarded USD 12.16 million to build 14 stations along I-90, US 97, US 195, and US 395 under the NEVI program.
- January 2026: EVgo is committed to installing at least 150 fast-charging stalls annually at Kroger stores nationwide through 2035.
United States EV Charging As A Service Market Report Scope
The scope includes segmentation by charger type (AC chargers (level 2 chargers) and DC fast chargers), power output (level 1/AC (less than 22 kW), level 2 (22-50 kW), fast (50-150 kW), and high-power (more than 150 kW), fleet service type (company vehicles and motor vehicles, delivery and logistics, and passenger transportation fleets), end-use (semi-public charging setup and public charging setup), and customer business model (subscription-based (CaaS), pay-per-use, and hybrid models). The analysis also covers regional-level segmentation, including the Northeast, Midwest, South, and West. Market size and growth forecasts are presented by value in USD.
| AC Chargers (Level 2 Service) |
| DC Fast Chargers |
| Level 1/AC (Less than 22 kW) |
| Level 2 (22 to 50 kW) |
| Fast (50 to 150 kW) |
| High-Power (More than 150 kW) |
| Company Vehicles and Motor Pools |
| Delivery and Logistics |
| Passenger Transportation Fleets |
| Semi-Public Charging Setup |
| Public Charging Setup |
| Subscription-based (CaaS) |
| Pay-per-Use |
| Hybrid Models |
| Northeast |
| Midwest |
| South |
| West |
| By Charger Type | AC Chargers (Level 2 Service) |
| DC Fast Chargers | |
| By Power Output | Level 1/AC (Less than 22 kW) |
| Level 2 (22 to 50 kW) | |
| Fast (50 to 150 kW) | |
| High-Power (More than 150 kW) | |
| By Fleet Service Type | Company Vehicles and Motor Pools |
| Delivery and Logistics | |
| Passenger Transportation Fleets | |
| By End-Use | Semi-Public Charging Setup |
| Public Charging Setup | |
| By Customer Business Model | Subscription-based (CaaS) |
| Pay-per-Use | |
| Hybrid Models | |
| By Region | Northeast |
| Midwest | |
| South | |
| West |
Key Questions Answered in the Report
How big will EV charging-as-a-service spending get in the United States by 2031?
The United States EV Charging As A Service market is forecast to reach USD 263.01 million by 2031, growing at a 21.12% CAGR from 2026.
Which charger type is gaining the most revenue share momentum?
DC fast chargers are projected for a 25.36% CAGR through 2031, outpacing AC Level 2 units as fleets prioritize quick turnaround.
Why are subscriptions popular with fleet operators?
Fixed-fee plans simplify budgeting, convert capex to opex, and guard against electricity-price swings, fostering 48.16% of 2025 revenue.
What is the biggest regional growth hotspot?
The South, led by Texas, is set for a 21.74% CAGR as EV registrations and NEVI corridor funding accelerate new site deployments.