
Asia-Pacific Spectator Sports Market Size and Share
Market Overview
| Study Period | 2020 - 2031 |
|---|---|
| Forecast Data Period | 2026 - 2031 |
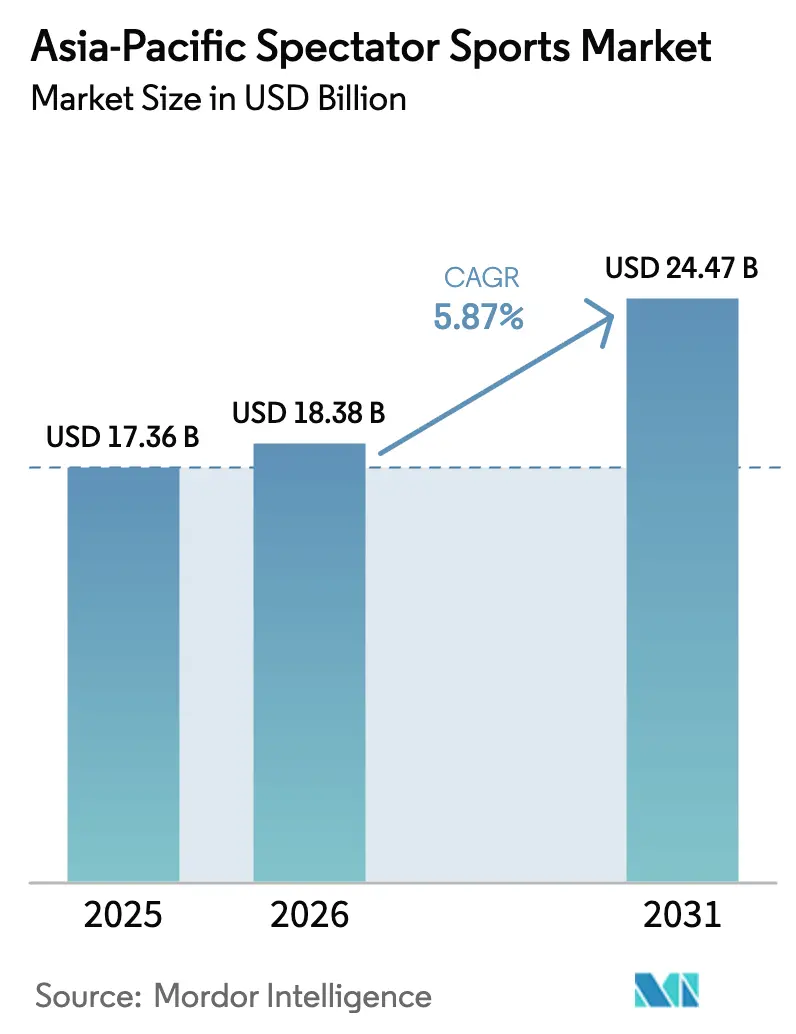
| Base Year Market Size (2025) | USD 17.36 Billion |
| Market Size (2026) | USD 18.38 Billion |
| Market Size (2031) | USD 24.47 Billion |
| Growth Rate (2026 - 2031) | 5.87% CAGR |
| Market Concentration | Medium |
Major Players *Disclaimer: Major Players sorted in no particular order Image © Mordor Intelligence. Reuse requires attribution under CC BY 4.0. | |
Asia-Pacific Spectator Sports Market Analysis by Mordor Intelligence
The Asia-Pacific spectator sports market size is expected to grow from USD 17.36 billion in 2025 to USD 18.38 billion in 2026 and is forecast to reach USD 24.47 billion by 2031 at 5.87% CAGR over 2026-2031. Growth reflects the confluence of rising disposable incomes, expanding 5G coverage, and government-funded mega-event pipelines that widen revenue opportunities. Streaming platforms continue to command premium pricing for exclusive live rights, while stadium modernization drives higher per-capita spending. Rapid urbanization broadens the fan base in tier-2 and tier-3 cities, and women’s professional leagues unlock a previously underserved demographic. Intensifying competition among pan-regional OTT platforms further inflates media-rights values, amplifying overall market momentum.
Key Report Takeaways
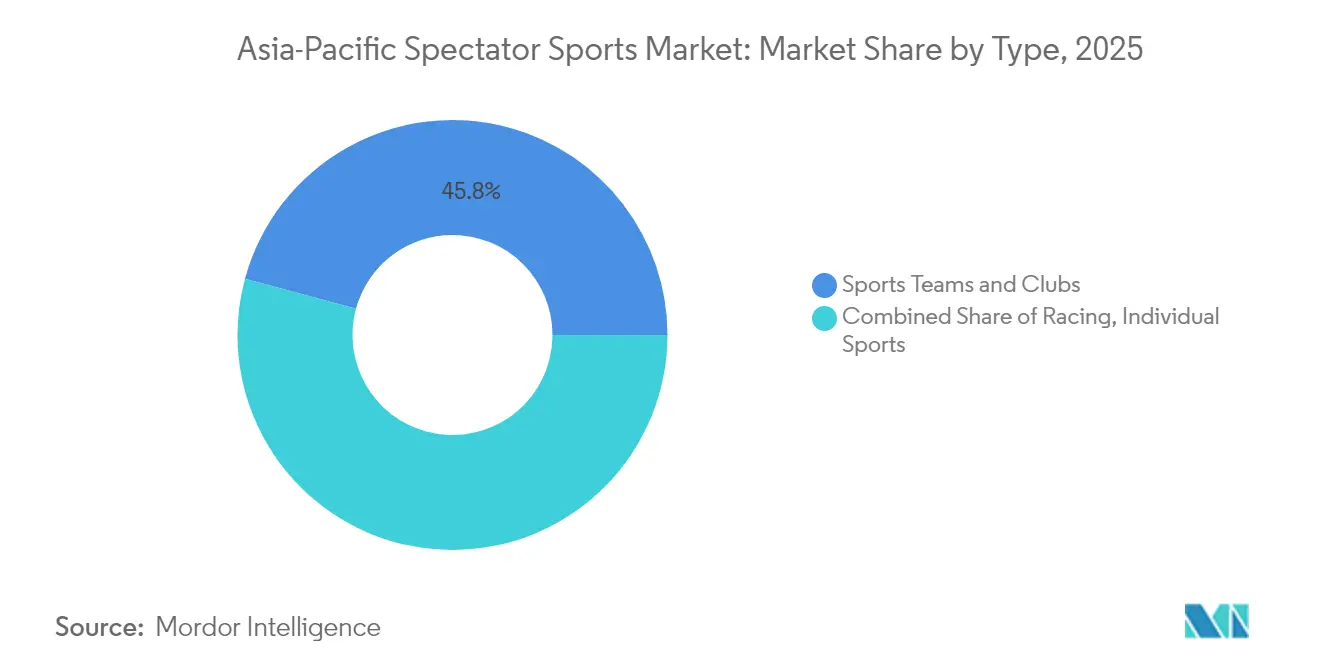
- By type, Sports Teams & Clubs held 45.78% of the Asia-Pacific spectator sports market share in 2025; Individual Sports are advancing at a 13.89% CAGR through 2031.
- By revenue source, Media Rights accounted for 33.10% of the 2025 revenue of the Asia-Pacific spectator sports market, while Sponsorship is growing fastest at 11.74% CAGR.
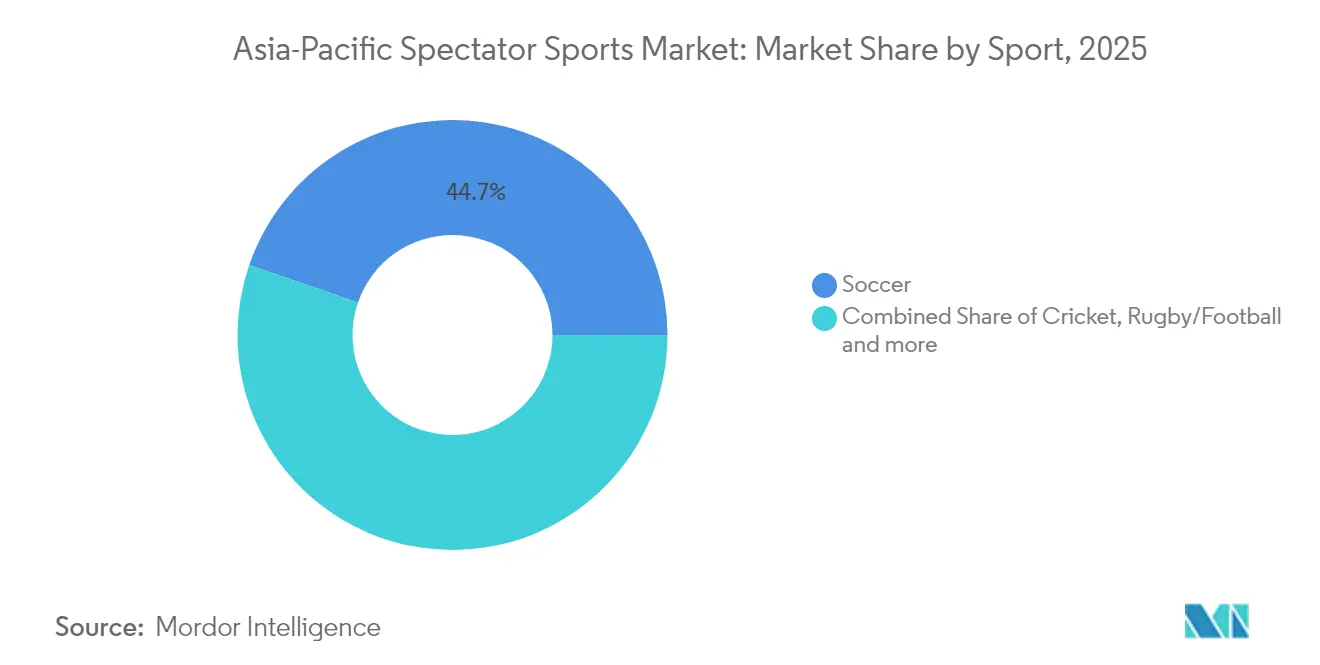
- By sports Type, Soccer led with a 44.72% share of the Asia-Pacific spectator sports market size in 2025; Cricket is expanding at a 9.84% CAGR.
- By geography, China commanded 29.15% of the regional revenue of the Asia-Pacific spectator sports market in 2025; India is projected to deliver the highest 12.76% CAGR to 2031.
Note: Market size and forecast figures in this report are generated using Mordor Intelligence’s proprietary estimation framework, updated with the latest available data and insights as of 2026.
Worldwide, activity is shaped by contributions from multiple regions, with Asia representing one of the more structurally developed among them. The global report on spectator sports market by Mordor Intelligence reflects how these regional layers combine into a single system.
Asia-Pacific Spectator Sports Market Trends and Insights
Drivers Impact Analysis*
| Driver | (~) % Impact on CAGR Forecast | Geographic Relevance | Impact Timeline |
|---|---|---|---|
| Surge in streaming and OTT sports consumption post-5G rollout | +1.2% | China, India, South Korea, Japan | Medium term (2-4 years) |
| The rise of women’s professional leagues is unlocking new fan segments | +1.8% | India, Australia, Southeast Asia | Long term (≥ 4 years) |
| Government-backed mega-events pipeline | +0.9% | China, India, Thailand, Indonesia | Short term (≤ 2 years) |
| Digital collectibles & fan-token monetization are accelerating revenue | +1.1% | Japan, Singapore | Medium term (2-4 years) |
| Rapid stadium modernization & mixed-use venue investments | +0.7% | China, India, and core Southeast Asian markets | Long term (≥ 4 years) |
| Cross-border media-rights inflation driven by pan-Asian platforms | +1.4% | China-India-Japan corridor | Short term (≤ 2 years) |
| Source: Mordor Intelligence | |||
Surge in Streaming and OTT Sports Consumption Post-5G Rollout
Asia-Pacific passed 1.6 billion 5G subscriptions in 2024, enabling low-latency live streaming that re-creates stadium-level immediacy for mobile viewers [1]Source: GSMA Intelligence, “Mobile Economy Asia Pacific 2024,” gsma.com. Operators in South Korea already cover 97% of the population, and China has deployed more than 3.92 million 5G base stations. OTT platforms leverage these networks to deliver multi-angle feeds, real-time statistics, and integrated micro-wagering features that deepen fan engagement. The ability to personalize viewing experiences drives a higher average revenue per user than legacy broadcast. As telcos bundle sports content with data plans, they effectively subsidize subscription costs, broadening access to premium events and accelerating the adoption of the Asia-Pacific spectator sports market’s digital tier.
Rise of Women’s Professional Leagues: Unlocking New Fan Segments
Inaugural women’s franchise leagues across cricket, football, and basketball demonstrate commercial viability through robust media-rights auctions and double-digit year-one attendance. India’s Women’s Premier League sold its first-cycle rights for more than USD 100 million, setting a new regional benchmark [2]Source: Board of Control for Cricket in India, “Media Rights Auction Press Release,” bcci.tv . Consumer surveys conducted in 2024 indicate a notable increase in intent to attend women's events, reflecting untapped market potential when compared to historical attendance trends. Younger demographics, particularly individuals aged 18-34, are demonstrating heightened engagement with women's sports content. This shift is attracting consumer brands focused on aligning with values such as authenticity and social impact. Additionally, corporate sponsors are increasingly allocating dedicated budgets to women's sports properties, signaling a structural change that is driving higher sponsorship returns across the Asia-Pacific spectator sports market. The interplay of increased visibility, strategic investments, and grassroots participation is positioning women's leagues as a key driver of long-term market growth.
Government-Backed Mega-Events Pipeline
National and city governments continue to deploy sports events as catalysts for infrastructure and tourism development. Thailand has allocated USD 0.06 billion (THB 2.055 billion) to stage the 2025 SEA Games, while Brisbane’s 2032 Olympics triggered USD 4.42 billion (AUD 7.1 billion) in venue and transport upgrades [3]Source: Olympic Council of Asia, “Thailand SEA Games Budget Declaration,” oca.asia . India will host multiple ICC events through 2031 and has earmarked a budget for new stadia and training centres. Such pipelines guarantee multi-year construction activity, raise sport-tourism capacity, and create residual assets for domestic leagues. They also spur technology upgrades—from 5G in-venue connectivity to contactless ticketing—that lift the Asia-Pacific spectator sports market’s overall monetization ceiling.
Digital Collectibles & Fan-Token Monetization Accelerating Revenue
Blockchain technology is transforming the way sports organizations generate revenue by enabling direct monetization of highlights and memorabilia with their fan base. Japanese football clubs leveraging fan tokens have reported substantial annual on-chain transaction volumes, granting token holders privileges such as voting rights on club jersey designs and access to exclusive merchandise. Manchester City, in partnership with Sony Music, has successfully capitalized on this trend through NFT releases, which have generated significant revenue from primary sales and ongoing royalties in the secondary market. According to analytics firm Chainalysis, the Asia-Pacific region experienced a notable increase in sports-related NFT trading activity in 2024, driven primarily by collectors in Singapore and Japan. These digital assets serve as a strategic complement to traditional revenue streams such as ticketing, merchandise, and sponsorships by offering verifiable ownership of scarce assets and capturing cross-border demand that is not constrained by physical venue capacities.
Restraints Impact Analysis*
| Restraint | (~) % Impact on CAGR Forecast | Geographic Relevance | Impact Timeline |
|---|---|---|---|
| High piracy rates eroding media-rights value | -0.8% | Indonesia, Vietnam, Philippines, India | Short term (≤ 2 years) |
| Fragmented regulatory landscape for sports betting & sponsorship | -0.6% | Southeast Asia | Medium term (2-4 years) |
| Rising athlete salary inflation squeezing smaller leagues | -0.4% | India, China, Japan, Australia | Long term (≥ 4 years) |
| Event scheduling congestion causing fan fatigue | -0.3% | China, India, major metros | Medium term (2-4 years) |
| Source: Mordor Intelligence | |||
High Piracy Rates Eroding Media-Rights Value
Unauthorized IPTV and streaming mirror sites siphon audiences from legitimate broadcasters, particularly in Indonesia, where AVIA estimates 87% of premium sports viewers accessed pirated feeds in 2024 [4]Source: Asia Video Industry Association, “Sports Piracy in Asia 2024,” avia.org. Illegal operators often deliver superior user interfaces at a fraction of the price, forcing rights-holders to discount. Social platforms struggle to remove infringing live streams in real time, allowing pirates to capture peak traffic during marquee events. Lost revenue constrains broadcasters’ ability to bid aggressively in future auctions, indirectly curbing the Asia-Pacific spectator sports market size obtainable from media rights. Governments have begun coordinating site-blocking and payment-gateway disruptions, yet enforcement gaps persist across fragmented jurisdictions.
Fragmented Regulatory Landscape for Sports Betting & Sponsorship
The Asia-Pacific betting market presents a complex regulatory environment, characterized by a blend of liberalized and restrictive frameworks. Markets such as Australia operate under fully liberalized conditions, while jurisdictions like Singapore enforce stringent controls. In India, regulatory oversight remains fragmented, with state-specific laws creating a patchwork of compliance requirements. Australia's recent prohibition on live-broadcast gambling advertisements, implemented in 2024, has significantly reduced the availability of sponsorship opportunities, impacting revenue streams for stakeholders. Concurrently, ongoing debates among Thai lawmakers regarding casino legalization have introduced uncertainty, complicating long-term partnership negotiations for sports clubs. The region's regulatory inconsistencies necessitate the development of customized compliance strategies by brands and rights-holders, leading to increased operational costs and deterring the formation of scalable, cross-border agreements that could enhance the Asia Pacific spectator sports market. Furthermore, smaller leagues, constrained by limited legal and financial resources, are unable to capitalize on betting-related revenue opportunities, thereby exacerbating the financial disparity between lower-tier and top-tier competitions.
*Our forecasts treat driver/restraint impacts as directional, not additive. The impact forecasts reflect baseline growth, mix effects, and variable interactions.
Segment Analysis
By Type: Individual Sports Drive Premium Monetization
Individual Sports contributed a smaller share but posted the fastest 13.89% CAGR, reflecting athletes’ ability to commercialize personal brands through direct-to-fan digital channels. Tennis and golf stars negotiate their own NFT drops and exclusive streaming clinics, generating revenue uncapped by team salary structures. Sports Teams & Clubs still commanded 45.78% of 2025 revenue, benefiting from entrenched loyalties, season-ticket bases, and venue monetization. Racing maintains a niche audience, leveraging immersive broadcast technology and VR simulators to offset high operating costs, but remains supply-constrained by limited circuits.
Consumer appetite for athlete-centric storytelling parallels the broader creator-economy trend, making Individual Sports attractive to sponsors seeking authentic engagement. Start-up platforms allow golfers to sell fractional ownership in future prize money, while tennis pros live-stream training sessions behind membership paywalls. Clubs respond by doubling down on community initiatives and mixed-use stadium developments to preserve their share of the wallet. Racing’s future hinges on electric and autonomous formats that promise sustainable, tech-forward narratives. Overall, rising individual monetization coexists with team-based fandom, expanding the Asia-Pacific spectator sports market rather than cannibalizing incumbent segments.


By Revenue Source: Sponsorship Accelerates Digital Integration
Media Rights retained leadership at 33.10% of 2025 turnover, aided by escalating cross-border bidding wars. Yet Sponsorship outpaced all other streams with a 11.74% CAGR, propelled by data-driven activation and brand demand for measurable ROI. The Asia-Pacific spectator sports market size attached to Sponsorship is forecast to add USD 2.48 billion between 2026-2031. Brands favour properties that integrate QR-enabled merchandise drops, in-app coupons, and blockchain loyalty tokens that convert impressions into attributable sales. Merchandising and Tickets remain resilient, although the rising cost of living in select markets caps volume growth; premium hospitality packages partially offset any softness in general admission demand.
As privacy regulations curtail third-party cookies, first-party fan data collected by clubs becomes a coveted asset. Sponsors negotiate access to anonymized purchase histories and engagement metrics, embedding themselves deeper into the fan journey. Media-rights owners simultaneously experiment with dynamic ad insertion tailored to viewer demographics and language preferences. Ticketing innovators package transport and experiences, smoothing friction for regional fans traveling to flagship events. Collectively, diversified revenue architecture fortifies clubs against single-stream volatility, enhancing long-run stability.
By Type of Sport: Cricket Innovation Drives Cross-Border Appeal
Soccer preserved its 44.72% share in 2025, resting on century-old league structures and omnipresent grassroots participation. Cricket, however, posted a 9.84% CAGR by combining shortened formats with Bollywood-style entertainment overlays that resonate with Gen Z audiences. The Asia-Pacific spectator sports market share for cricket could climb another 2.85 percentage points by 2031 as franchise models expand into Southeast Asia and the Middle East. Rugby remains robust in Pacific nations, buoyed by government funding and vocal expatriate communities. Tennis continues steady growth, leveraging year-round calendars and star-driven narratives. Emerging indigenous sports such as kabaddi prove that culturally rooted games can scale commercially when modern broadcast and analytics are applied.
Cross-border broadcasting agreements bring cricket finals to diaspora households from Vancouver to Dubai, enlarging rights fees. Soccer federations respond by staging preseason tournaments in Asia, capturing sponsorship from local consumer brands. Rugby capitalizes on Olympic inclusion to court non-traditional fans, while tennis explores mixed-team formats to freshen its proposition. For property owners, the lesson is clear: innovation in format and distribution unlocks incremental audiences without alienating purists, sustaining multi-sport expansion of the Asia-Pacific spectator sports market.
Geography Analysis
China generated 29.15% of regional revenue in 2025, benefiting from large-scale government sports promotion programs and mature streaming ecosystems that deliver bundled live events, gaming, and e-commerce. However, restrictions on gambling advertising and strict content censorship limit certain monetization levers compared with liberalized markets. Tier-2 and tier-3 city penetration offers the next leg of growth as infrastructural gap narrows and local franchises secure municipal backing.
India ranks as the fastest-expanding geography, on track for a 12.76% CAGR through 2031 on the back of digital payments ubiquity, low-cost data, and a bulging youth demographic. Franchise success in cricket and kabaddi validates the city-based ownership model, prompting similar initiatives in volleyball and football. Government programs such as Khelo India channel funding into grassroots facilities that feed professional talent pipelines, ensuring sustainable supply. State-by-state betting regulation remains a swing factor: harmonization could unlock incremental sponsorship, while uncertainty may impede cross-border investment flows. Notably, the Asia-Pacific spectator sports market share for India could rise 3.8 points by 2031 if broadcast and sponsorship yields converge with global averages.
Japan, Australia, and South Korea provide technology testbeds where 4K/8K broadcasts, AR overlays, and biometric ticketing debut before regional rollout. Each boasts high per-capita expenditure and corporate backing, enabling early adoption of premium products that push the innovation frontier. Australia’s balanced betting framework demonstrates how regulation can coexist with consumer protections, generating tax receipts that recycle into sport development. South Korea blends esports with traditional events, attracting hybrid audiences and forging new content genres. Collectively, mature markets contribute stable cashflow and R&D spillovers that ultimately uplift the wider Asia Pacific spectator sports market.
Mordor Intelligence provides coverage of the spectator sports market across other key regional markets, including Europe and North America, each with their regulatory frameworks and demand patterns. Detailed country-level analysis extends to India and United Kingdom incorporating local coverage and market participation, as required.
Regulatory Landscape
Regulation in Asia-Pacific spectator sports remains highly jurisdiction-specific, influencing monetization levers such as sponsorship, betting adjacency, club ownership, and league governance. In India, the National Sports Governance Act (2025) moved into an implementation phase with rules notified on 22 May 2026, introducing new institutional oversight mechanisms (National Sports Board and National Sports Tribunal) for national sports federations. Competition issues in leagues and rights packaging continue to fall under the Competition Act, 2002, administered through the Competition Commission of India (CCI). Across football, the Asian Football Confederation (AFC) Club Licensing Regulations (Edition 2026) and the CLAS platform tighten compliance expectations around licensing and governance for member associations and clubs.
Japan provides a mature reference point where the Japan Fair Trade Commission (JFTC) applies the Anti-Monopoly Act to sports bodies and has engaged publicly on league conduct, including around Nippon Professional Baseball (NPB) practices, alongside broader governance guidance linked to the Japan Sports Agency. China operates within the framework of the Sports Law and related administrative measures for professional leagues, with ongoing policy discussion on governance, commercial revenue distribution, and competition-law treatment of league coordination. Together, these regimes impose differing disclosure, licensing, and commercial-rule obligations that rights-holders and investors need to navigate when scaling media rights, sponsorship packages, and club-level transactions across the region.
Value Chain Analysis
The Asia-Pacific spectator sports value chain starts with rights origination by federations, leagues, teams, and event organizers. It then moves through commercialization (media rights, sponsorship, ticketing, merchandising, and licensing) and into distribution via broadcasters/OTT platforms, venue operators, and retail partners. Many properties are structurally centralized at league level for media-rights packaging and brand consistency. In Japan, for instance, match-footage copyrights are held at the J.League level and broadcast commercialization has been executed through major platform deals, while stadium operations often involve municipal ownership and third-party management via the Designated Administrator System.
Downstream economics depend on how leagues govern labor, revenue sharing, and club participation. NPB operates through formal league governance bodies (Commissioner, Owners Meeting, and constituent clubs) under core instruments such as the Baseball Agreement and Standard Player Contract, which shape cost structures and the product delivered to media and sponsors. In India, the BCCI controls marquee properties through governing-council structures that ring-fence league finances, while the Indian Super League (ISL) uses a formal governance and management committee model for the 2026-27 cycle, including defined decision thresholds on revenue redistribution and designated roles for commercial-rights partners. This institutional setup affects negotiation leverage with media platforms and sponsors, the ability to standardize inventory across clubs, and how quickly digital products (data feeds, collectibles, and loyalty mechanics) can be rolled out at scale.
Competitive Landscape
A fragmented ecosystem prevails: the top rights-holders capture only one-fourth of revenue, reflecting heterogeneous consumer preferences, linguistic diversity, and regulatory variance. Chinese state-owned entities dominate domestic rights but lack pan-regional reach. Indian franchises excel in entertainment-centric presentation, monetizing via integrated sponsorship, licensing, and digital collectibles. Japanese corporations leverage advanced production technology to command premium export valuations, while Australian bodies maximize global appeal through season scheduling that avoids Northern-Hemisphere clashes.
Technology forms the competitive fulcrum. Rights-holders investing in proprietary streaming, real-time data feeds, and AI-driven personalization report engagement gains. Blockchain platforms like Socios grant clubs direct-to-fan monetization, eroding dependency on intermediaries. Venue operators integrating IoT for crowd analytics achieve lower staffing costs and higher per-capita concession revenue, reinforcing competitive edges.
Consolidation likely centres on bolt-on acquisitions of niche rights to assemble scalable, multi-sport portfolios. The private equity sector continues to exhibit strong investment interest, as evidenced by the strategic collaboration between PAG and CVC. This partnership aims to acquire Australian Venue Co, reflecting a calculated move to strengthen their vertical integration within the hospitality industry. Such initiatives underscore the growing focus on leveraging synergies and expanding market presence in high-growth sectors. Anticipated synergies include bundled ticket-and-dining packages and data-sharing across properties. With women’s sports valuations still modest relative to growth potential, early movers may secure outsized returns, accelerating formal sector structure in the Asia-Pacific spectator sports market.
Asia-Pacific Spectator Sports Industry Leaders
Board of Control for Cricket in India (BCCI)
Chinese Super League Company Limited
Nippon Professional Baseball Organization (NPB)
Japan Professional Football League (J.League)
Korea Baseball Organization (KBO)
- *Disclaimer: Major Players sorted in no particular order


Market Opportunities and Future Outlook
Two visible whitespace areas are institutional investability and cross-border commercialization infrastructure. In India, the operationalisation of the National Sports Governance Act (2025) through 2026 rules creates a more standardized disclosure and accountability environment for national sports federations, while the ISL 2026-27 charter formalizes governance and management structures that integrate commercial rights partners into decision-making. Together, these steps support more repeatable contracting for sponsorship, media packaging, and league-level services (data, production, ticketing, and fan engagement), particularly for properties looking to move beyond single-season dealmaking.
A second opportunity set is club and venue-linked value creation through compliant ownership structures and professionalized stadium operations. Japan illustrates this pathway, where investment in J.League clubs involves navigating ownership approval, foreign investment clearances under FEFTA where applicable, and stadium operating models tied to the Designated Administrator System, which in turn shapes how investors structure deals and monetize matchday and non-matchday revenue. Regionally, tighter football governance via the AFC Club Licensing Regulations (Edition 2026) also pushes clubs toward clearer financial and operational standards, increasing demand for specialist services across compliance, finance, content production, and commercial activation that sit adjacent to core match revenue.
Recent Industry Developments
- July 2026: BCCI launched Invitation to Tender for Title Sponsor Rights and RFQ for Associate Partner Rights. The move extends the BCCI commercial rights cycle around the IPL, expanding asset monetization opportunities. The development signals a shift in sponsorship revenue dynamics for major AP leagues.
- May 2026: Mediapro retained international media and betting rights to the Chinese Super League after a competitive tender. The CSL international broadcast and betting rights are secured, expanding Mediapro's footprint in China. The arrangement supports elevated rights valuations through stronger regional reach.
- April 2026: Council for Promotion of the Sports Ecosystem (C-SEP) announced partnership agreements with six Nippon Professional Baseball clubs. Cross club ecosystem partnerships in AP baseball enhance collaboration across markets. The initiative expands monetization potential through coordinated Asia-Pacific baseball assets.


Research Methodology Framework and Report Scope
Market Definition and Coverage
This market includes revenues generated from spectator sports activity across Asia-Pacific, with revenue coming from live event attendance and the monetization streams tied to professional sports viewing and fan engagement, whether on-site or through media distribution.
Scope exclusions: We exclude sports equipment sales, casual participation sports spending, and non-sports live entertainment that is not linked to spectator sports events.
Segmentation Overview
- By Type
- Sports Team and Clubs
- Racing
- Individual Sports
- By Revenue Source
- Media Rights
- Merchandising
- Tickets
- Sponsorship
- By Type of Sport
- Soccer
- Cricket
- Rugby/Football
- Tennis
- Other Types of Sports
- By Geography
- India
- China
- Japan
- Australia
- South Korea
- South East Asia
- Singapore
- Malaysia
- Thailand
- Indonesia
- Vietnam
- Philippines
- Rest of Asia-Pacific
Data Sources, Market Sizing, and Validation
Desk Research
Desk research was used to set the first market boundaries and to gather country-level demand signals that can be checked consistently over time. We referenced public sources such as national statistics offices for household spend and leisure indicators, ministries of sports and tourism for event pipelines, and tax or revenue agencies where sports-related collections are reported. We also reviewed publications from bodies such as the International Olympic Committee (IOC), FIFA, and national Olympic committees to understand hosting calendars and venue activity trends.
To convert these signals into model inputs, we cross-checked league and venue announcements, annual reports, and investor presentations to identify major rights cycles, sponsorship trends, and attendance changes. Where needed, paid database subscriptions were used for company financials and intelligence, patent lookups for fan engagement technology, and shipment-level trade views for selected venue and broadcast hardware proxy checks. This list is illustrative only, and many other public, financial, and institutional sources were also used for data collection, validation, and clarification.
Primary Interviews and Surveys
Primary interviews were used to validate what drives revenue in each major country, and to test the realism of key assumptions such as attendance recovery, media-rights pricing, and sponsorship renewals. We spoke with a mix of league, venue, media, and service-side roles, then used follow-up surveys to pressure-test ranges for pricing, sell-through, and typical contract durations across APAC markets with different maturity levels.
Distribution of primary research fieldwork respondents
| Company type | Respondent position | Region |
|---|---|---|
| Top tier: 31% | CXOs: 12% | |
| Mid tier: 55% | Functional/Unit leaders: 33% | |
| Smaller Players: 14% | Managers: 55% |
Market-Sizing & Forecasting
Sizing starts from a top-down build that reconstructs the revenue pool by country using observable demand signals and monetization levers, then it is reconciled against what leagues, venues, and distributors can realistically deliver. In practice, we map the market to major revenue lines such as ticketing, media rights, and sponsorship, and then apply country and sport-level splits using a mix of public event calendars, reported attendance, and pricing benchmarks.
Key model inputs include event volume by sport and city, average attendance and stadium utilization patterns, ticket price tiers and premium seating share, media-rights renewal timing, and sponsorship intensity, including the shift toward digital inventory. Forecasting uses scenario analysis supported by expert consensus, since the outlook can change quickly with mega-event awards, policy support for sports, or rights-cycle resets. Bottom-up approximations are used as a check, including sampled ticket yield against attendance for large leagues, and selective roll-ups from reported revenue disclosures where coverage is strong, with gaps filled using peer-country analogs and conservative interpolation before totals are finalized.
Data Validation & Update Cycle
Validation is done through multiple checks so the final numbers align with real-world signals. Outputs are compared with independent indicators such as attendance momentum, rights-cycle news, and venue expansion announcements, and any outliers are re-worked until the assumptions behind them are clear. Before sign-off, the model and supporting logic are reviewed in more than one analyst pass, and respondents are re-contacted when a key variable moves outside the expected range.
The report is refreshed annually, and interim updates are triggered when major events occur, such as large media-rights renewals or significant regulatory changes that affect sports commercialization. Before delivery, a final update sweep is completed so clients receive the latest view based on newly available public data and field feedback.
Mordor Intelligence's Asia Pacific Spectator Sports Market Size Compared With Other Published Estimates
Published market sizes for spectator sports in Asia-Pacific often vary because revenue lines and geography cutoffs are not handled the same way across studies, and timing also matters when rights deals reset. Differences can also come from whether studies lean on announced deal values versus realized revenues, and how pricing and attendance are normalized across countries with different ticketing and media models.
The biggest gap drivers here are scope and what gets counted as spectator sports revenue, since some estimates fold in broader sports ecosystem items such as sports betting, sportswear, or general entertainment venue income. Another common driver is the forecast stance, where aggressive scenarios assume rapid streaming price increases and uninterrupted sell-out rates, even when schedules, capacity additions, and renewals suggest a slower ramp. This study stays tied to realized and near-term contractable revenues, keeps adjacent categories out of the total, and that is why the 2025 value lands at USD 17.36 B in the model used by Mordor Intelligence.
Benchmark comparison
| Source | Market Size | Gaps in Research Methodology |
|---|---|---|
| Mordor Intelligence | USD 17.36 B (2025) | |
| Trade Journal A | USD 58.88 B (2025) | Uses a broader definition that appears to bundle stadium infrastructure and wider sports-related commercial activity, which inflates the addressable revenue beyond spectator sports operations. |
| Regional Consultancy B | USD 50.00 B (2024) | Anchors the estimate to an engagement-led view with limited clarity on revenue recognition, base-year alignment, and how media-rights and sponsorship values are converted to realized annual revenues. |
Overall, the spread is explained mostly by what is included in the revenue basket and whether deal headlines are treated like earned revenues. By keeping the calculation traceable to ticketing, media rights, and sponsorship variables that can be checked country by country, the approach produces a practical number that can be replicated and refreshed with the same inputs each year.


Key Questions Answered in the Report
What is the current valuation of the Asia Pacific spectator sports market?
It stood at USD 18.38 billion in 2026 and is on course to reach USD 24.47 billion by 2031.
Which revenue stream is expanding fastest?
Sponsorship is growing at a 11.74% CAGR, fueled by data-driven digital activations.
Why is India the fastest-growing geography?
The report covers the undefined historical market size for years: 2020, 2021, 2022, 2023, 2024 and 2025. The report also forecasts the undefined size for years: 2026, 2027, 2028, 2029, 2030 and 2031.
How are digital collectibles influencing revenues?
NFT drops and fan tokens create direct-to-consumer income streams, adding incremental royalty and trading revenue.
What challenges hinder market growth?
High piracy, fragmented betting regulation, and athlete salary inflation collectively shave roughly 2.1% off the forecast CAGR.
Page last updated on:






