
Oman Used Car Market Size and Share
Market Overview
| Study Period | 2020 - 2031 |
|---|---|
| Forecast Data Period | 2026 - 2031 |
| Base Year Market Size (2025) | USD 1.02 Billion |
| Market Size (2026) | USD 1.06 Billion |
| Market Size (2031) | USD 1.27 Billion |
| Growth Rate (2026 - 2031) | 3.72 % |
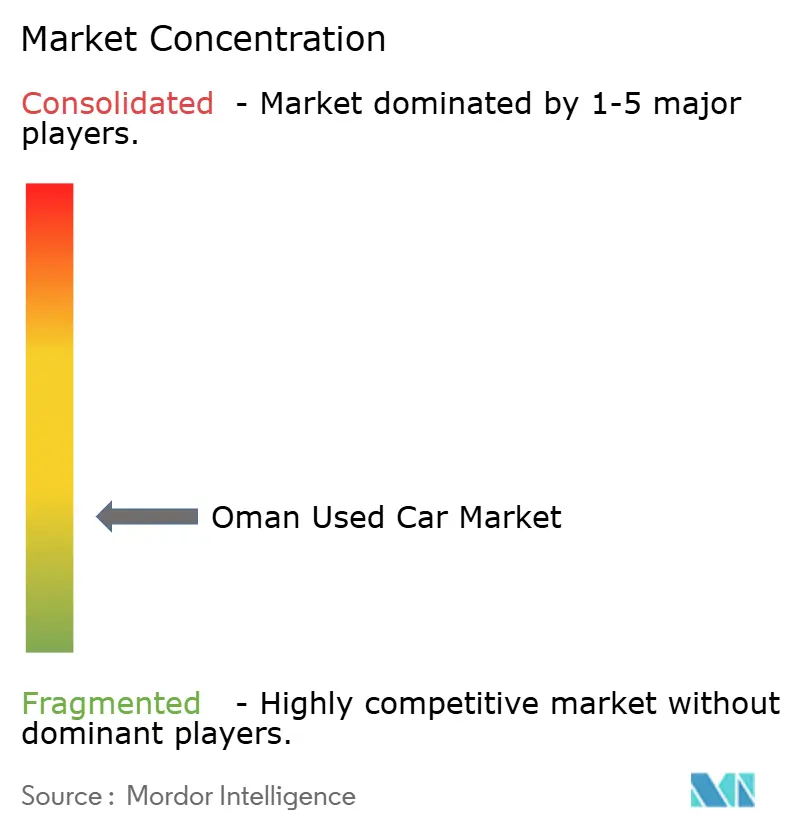
| Market Concentration | Low |
Major Players *Disclaimer: Major Players sorted in no particular order Image © Mordor Intelligence. Reuse requires attribution under CC BY 4.0. | |
Oman Used Car Market Analysis by Mordor Intelligence
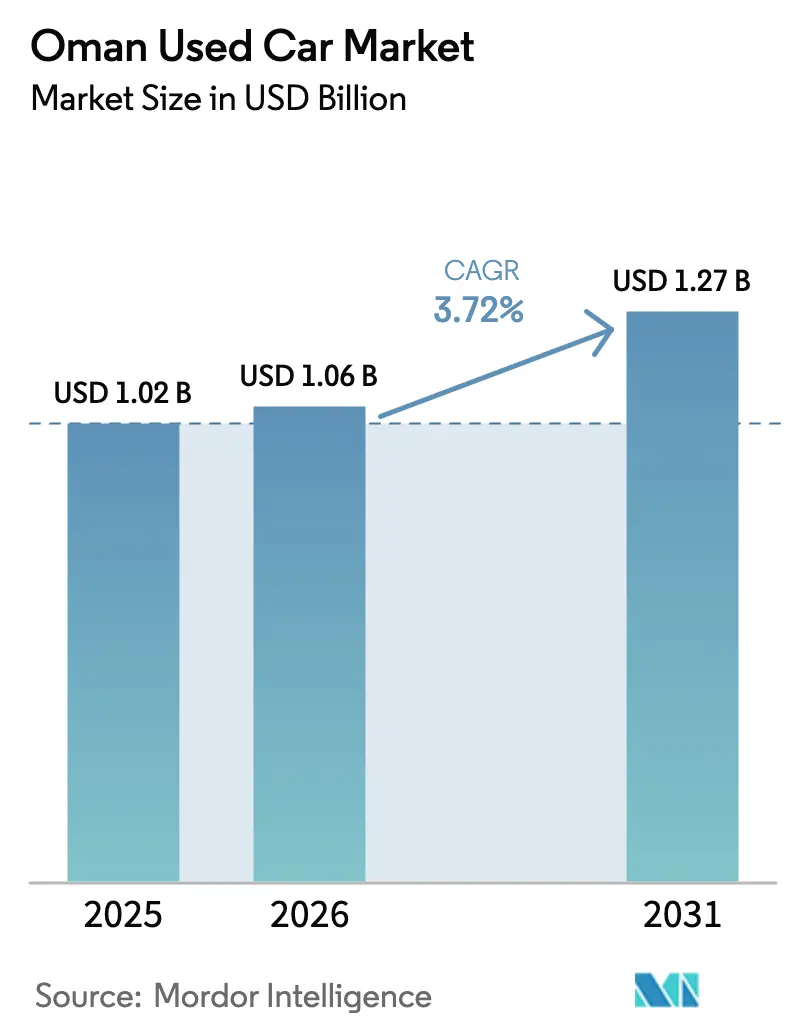
Oman Used Car market size in 2026 is estimated at USD 1.06 billion, growing from 2025 value of USD 1.02 billion with 2031 projections showing USD 1.27 billion, growing at 3.72% CAGR over 2026-2031. Robust non-oil GDP growth that topped 4% in 2024 and an expected 3% GDP expansion for 2025 underpin demand resilience, while disciplined fiscal management keeps inflation in check and preserves household purchasing power. Digital platforms now facilitate nearly seven in every ten transactions, with a surge in mobile payments that has made online purchasing convenient and trusted. Certified-pre-owned (CPO) programs introduced by leading dealer groups feed premiumisation trends. Re-exports of late-model fleet Sports Utility Vehicles from neighbouring GCC states broaden inventory without customs duties when vehicles are under two years old. Meanwhile, it mandates that all new fuel stations add EV chargers to accelerate electric vehicle (EV) adoption and signal long-run structural change.
Key Report Takeaways
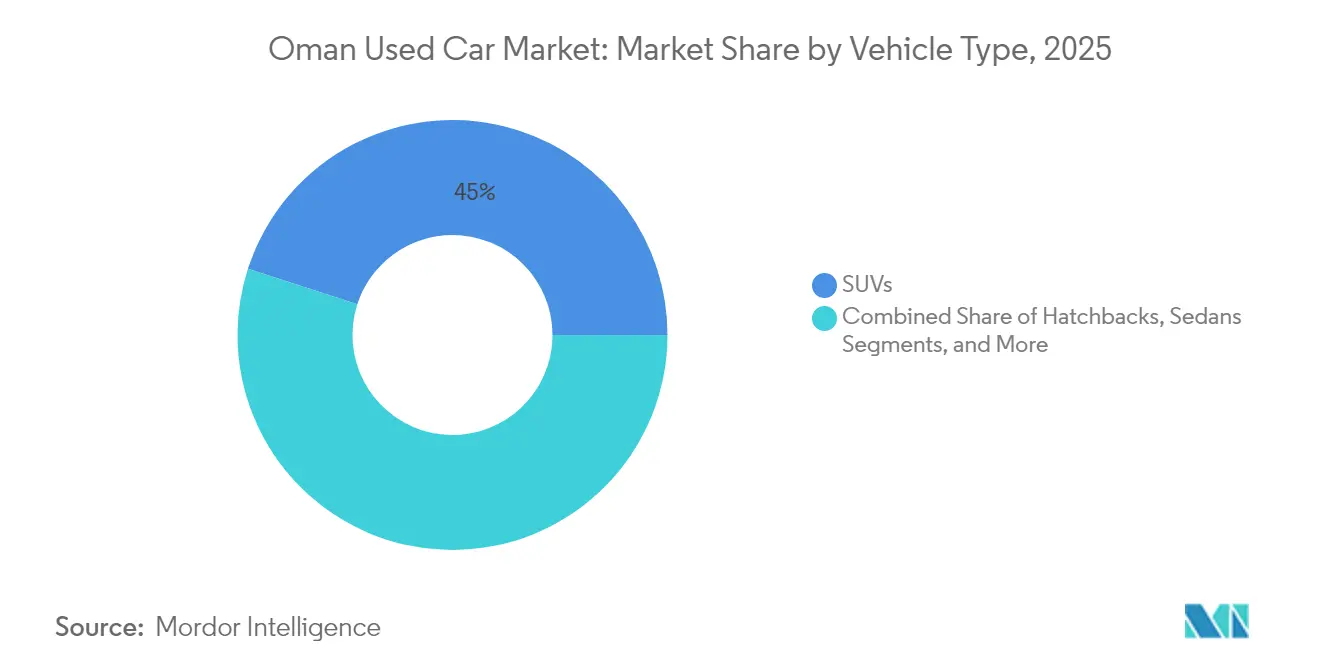
- By vehicle type, SUVs led with 45.02% of the Oman used car market share in 2025; the same segment is forecast to expand at an 8.35% CAGR to 2031.
- By vendor type, the unorganized segment held 55.90% of the Oman used car market share in 2025, while organized dealers are climbing at a 7.05% CAGR through 2031.
- By fuel type, petrol vehicles dominated at 52.10% of the Oman used car market share in 2025, whereas electric segment post the quickest pace at a 8.41% CAGR to 2031.
- By vehicle age, the 3-5-year bracket accounted for 68.60% of the Oman used car market size in 2025; 0-2-year units are advancing at an 8.18% CAGR.
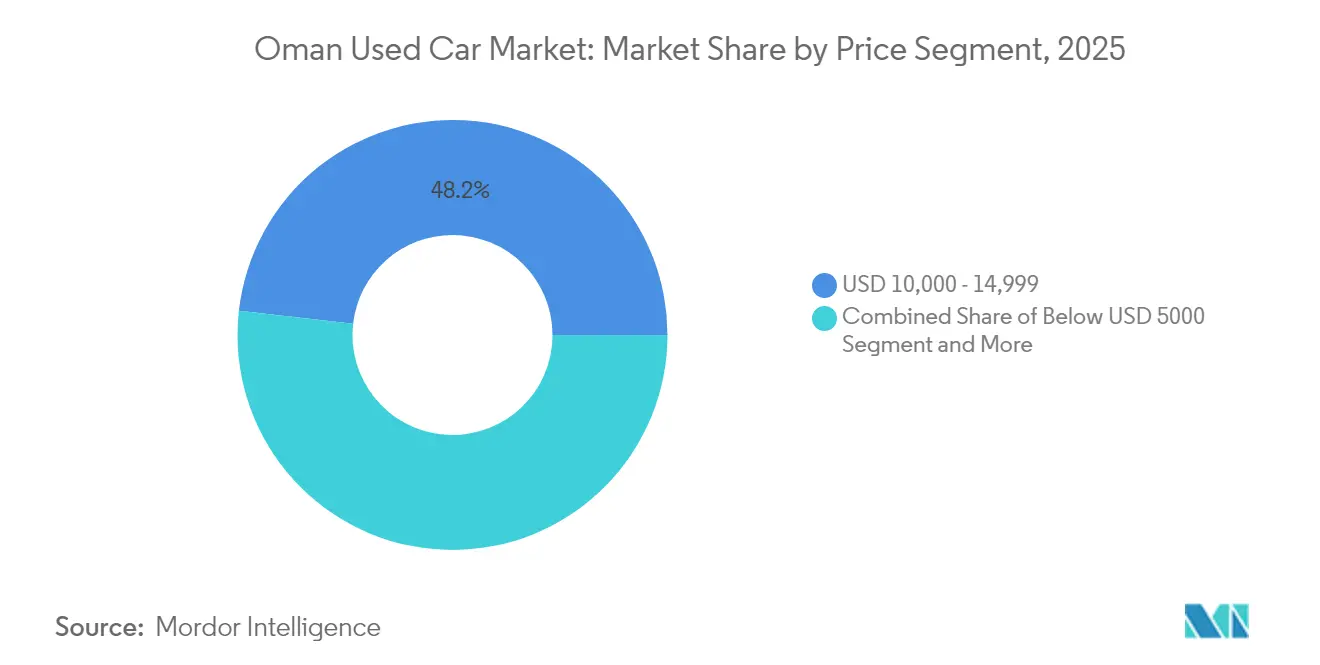
- By price segment, USD 10,000–14,999 accounted for 48.21% of the Oman used car market size in 2025; USD 20,000–29,999 is growing at a 7.22% CAGR.
- By sales channel, online portals captured 68.10% of the Oman used car market share in 2025 and are projected to widen at a 8.79% CAGR through 2031.
Note: Market size and forecast figures in this report are generated using Mordor Intelligence’s proprietary estimation framework, updated with the latest available data and insights as of 2026.
Viewed independently, Oman offers depth on local conditions but not full coverage of the overall global system. Mordor Intelligence's coverage on the used car market brings the wider geographic picture into focus.
Oman Used Car Market Trends and Insights
Drivers Impact Analysis*
| Driver | (~) % Impact on CAGR Forecast | Geographic Relevance | Impact Timeline |
|---|---|---|---|
| High New-Car Prices and Affordability Gap | +1.5% | National, concentrated in urban centers | Medium term (2-4 years) |
| Rapid Growth of Digital Classified Portals | +1.2% | National, higher penetration in Muscat and Salalah | Short term (≤ 2 years) |
| Easier Access to Used-Car Financing Options | +0.8% | Nationwide, banking-sector backed | Medium term (2-4 years) |
| Expansion of Certified-Pre-Owned Programs | +0.5% | Urban hubs, expanding to secondary cities | Long term (≥ 4 years) |
| Re-Export Inflow of Ex-Rental GCC Fleet | +0.4% | Border regions and major ports, spillover nationwide | Medium term (2-4 years) |
| AI-Based Inspection and Certification | +0.3% | Initially urban, scaling nationwide | Long term (≥ 4 years) |
| Source: Mordor Intelligence | |||
High New-Car Prices Create Structural Demand Shift
Escalating prices continue to outpace wage growth, prompting households to treat the Oman used car market as the default avenue for personal mobility. Customs tallies show imports tilting toward higher-value trims as entry-level new-car options thin out. IMF modelling puts 2025 consumer-price gains at 1.5%, so affordability concerns remain acute despite a steady real GDP growth. Vehicles priced USD 10,000–14,999 already represent 48.52% of the market revenue, underscoring the central role of value shopping. With Vision 2040 continuing to create non-oil jobs that lift—but do not significantly spike - income levels, demand pivots structurally toward quality, mid-priced pre-owned cars rather than new metal. The widening gap simultaneously persuades OEM-affiliated dealers to expand CPO fleets to recapture customers otherwise lost to independents.
Rapid Expansion of Digital Classified Portals Transforms Transaction Dynamics
Online platforms now mediate 68.51% of all purchases and are expanding at 9.23% a year, positioning the Oman used car market firmly on a digital footing. A USD 400 million public outlay earmarked for AI and advanced tech infrastructure by 2030 is accelerating the shift, particularly across logistics and mobility services. The Central Bank logged a 551% rise in mobile payments between 2021 and 2022, dramatically lowering friction for high-value e-commerce, including automobiles.[1]“Digital Economy Strategy,” Ministry of Transport, Communications and Information Technology, mtcit.gov.omBuyers in Sohar and Nizwa now tap Muscat-concentrated inventory with a smartphone search, while AI-powered inspection reports neutralise the historic need for physical viewings. The result is compressed price dispersion and greater transparency, forcing offline-only dealers to embrace omnichannel models or cede share.
Banking-Sector Expansion Enables Broader Financing Access
According to the IMF, healthy capital buffers and better asset quality have emboldened banks to widen auto-loan books, notably for pre-owned stock, sparking a 0.8 percentage-point boost to projected market CAGR. Updated consumer-credit rules emphasise fair lending and disclosure, allowing organised dealers to bundle financing at the point of sale.[2]“Financial Stability Report 2024,” Central Bankof Oman, cbo.gov.omLonger tenors, smaller down-payments, and bundled insurance packages now pull middle-income households into higher vehicle brackets, with the USD 20,000–30,000 slice growing faster. Financing also underpins the shift toward organised retail by rewarding players who can offer on-the-spot loan approval.
Certified Pre-Owned Programs Gain OEM omentum
OEM groups such as Saud Bahwan (Toyota) and Suhail Bahwan (Nissan) have scaled CPO operations to hold customers in-brand. Vehicles under seven years qualify under Oman's import codes, creating a natural quality floor that meets certification rules. On-site reconditioning centres, factory-grade diagnostics, and limited warranties now differentiate authorised outlets from unorganised lots, nudging brand-loyal consumers to pay moderate premiums. Over time, rising EV volume will add depth to this channel, since battery-state validation is difficult for informal sellers but essential for risk-averse buyers.
Restraints Impact Analysis*
| Restraint | (~) % Impact on CAGR Forecast | Geographic Relevance | Impact Timeline |
|---|---|---|---|
| Import Duties & Age-Based Restrictions | -0.7% | National | Long term (≥ 4 years) |
| Oil-Price-Linked Macro Volatility Affecting Disposable Income | -0.4% | National, higher impact in oil-dependent regions | Short term (≤ 2 years) |
| Absence of a National Vehicle-History Registry | -0.3% | National | Medium term (2-4 years) |
| Slow EV-Charging Roll-Out Limiting Used-EV Uptake | -0.2% | Urban centers, gradually expanding to rural areas | Long term (≥ 4 years) |
| Source: Mordor Intelligence | |||
Import Restrictions Constrain Supply Chain Flexibility
A 5% customs levy plus 5% VAT on non-GCC imports, compounded by a seven-year age cap and a left-hand-drive rule, squeezes low-income choice and trims dealer margins. Sub-USD 5,000 vehicles -critical for first-time buyers are hardest hit, because many older models aged eight to ten years are barred outright. Inventory scarcity escalates price volatility when a popular model nears the age cutoff, nudging overall affordability downward. Although duty-free entry for GCC vehicles under two years old helps organised dealers stock late-model SUVs, it does little to relieve the mass-market bottleneck.
Oil-Price Volatility Threatens Consumer Spending Stability
Even after diversification gains, hydrocarbons still finance 68% of the 2025 budget, exposing disposable income to Brent swings.[3]“Country Commercial Guide – Oman Automotive,” U.S. Department of Commerce, trade.gov Project delays ripple through employment when prices dip, eroding household confidence and deferring big-ticket purchases such as cars. IMF stress tests warn that external shocks could tighten credit conditions, undermining the financing lifelines supporting organised dealer expansion. During downturns, inventory turns slow, and floor-plan costs rise, pressuring margins and discouraging restocking of varied trims or fuel types.
*Our forecasts treat driver/restraint impacts as directional, not additive. The impact forecasts reflect baseline growth, mix effects, and variable interactions.
Segment Analysis
By Vehicle Type: SUVs Extend Dominance With Multi-Terrain Appeal
SUVs accounted for 45.02% of the Oman used car market share in 2025 and are projected to advance at a vigorous 8.35% CAGR between 2026 and 2031. Buyers value their higher ground clearance for wadis and mountain routes, spacious cabins for family travel, and prestige within social circles. The segment also benefits from a steady stream of two-year-old ex-rental models arriving duty-free from neighbouring GCC states, which keeps inventory fresh and pricing competitive. Sedans still appeal to cost-conscious commuters prioritizing fuel efficiency, while hatchbacks satisfy first-time urban owners looking for easy parking and lower operating costs.
Government road-building projects under Vision 2040 and expanding digital marketplaces reinforce SUV momentum by making listings more accessible to interior-region shoppers. Certified-pre-owned programs offered by leading dealer groups add warranties that tilt buyers toward mid-priced SUVs over uncertified alternatives. Growing interest in electric variants is visible as new fuel-station licences mandate charger installations, although petrol powertrains remain dominant today. MPVs retain a niche among large families and tourism operators, and specialty models in the "Others" bracket serve affluent enthusiasts. Overall, the segment's broad utility, social cachet, and improved supply position will remain the core drivers of Oman's used car market growth through 2031.


By Vendor Type: Organized Dealers Gain Consumer Trust
Unorganised sellers accounted for 55.90% of the Oman used car market share in 2025, as organised brands roll out digital storefronts, transparent pricing, and bundled financing. The Oman used car market registers a 7.05% CAGR for organised vendors, syndicating listings across Dubizzle, YallaMotor, and proprietary platforms to broaden customer reach. In contrast, street-lot operators depend on foot traffic and informal word-of-mouth, restricting scale economies. Banks routinely pre-approve dealer partners, pushing credit-seeking customers toward the organised ecosystem. In the Muscat district, satellite reconditioning hubs let dealers refurbish inbound GCC stock quickly, further sharpening their competitive edge.
Yet unorganised players retain influence in villages and small towns by offering flexible payment schedules and accepting trade-ins that organised groups often reject. Many also specialise in higher-mileage commercial pickups and 4×4 models needed by contractors. Over time, however, regulatory nudges- such as mandatory electronic invoicing- and consumer protection rules are expected to squeeze margins for informal sellers, accelerating formalisation.
By Fuel Type: EVs Accelerate From a Low Base
Petrol’s 52.10% command of the Oman used car market share reflected refuelling convenience in 2025. Nevertheless, EV registrations are compounding at 8.41% CAGR as the charging infrastructure spreads along the Batinah coastal corridor. Authority for Public Services Regulation modelling suggests price parity with internal-combustion cars is imminent, setting the stage for second-hand EV supply to expand when first-wave adopters trade up. Diesel units largely fill commercial roles: refrigerated trucks, long-haul pickups, and public transport minibuses.
Hybrids draw commuters logging heavy annual mileage who still fear charging shortfalls on inter-city runs. Alternative fuels—CNG, LPG, or bio-ethanol—represent a sliver, tied mostly to municipal fleets. Organised dealers are already training technicians in battery-thermal-management diagnostics, anticipating a future in which warranty-backed battery health certificates become as vital as odometer readings.
By Vehicle Age: 3-5-year Stock Balances Price and Reliability
Vehicles aged three to five years captured 68.60% of the Oman used car market size, offering the optimal depreciation spot. Loan underwriters prefer cars under five years, granting lower interest rates that reduce monthly instalments and widen buyer pools. Segment growth is further cushioned by GCC fleets that rotate vehicles at the 24- or 36-month mark, producing a steady pipeline of mid-age inventory available at auction. By contrast, cars older than eight years face import barriers and rising reconditioning costs, limiting stock and pushing buyers toward newer options or keeping existing vehicles longer.
Demand for near-new 0-2-year cars is rising at 8.18% CAGR, primarily among executives who value the latest safety tech and infotainment packages but want to dodge first-year depreciation. Insurance premiums for this bracket remain modest because warranty coverage reduces expected claims. Meanwhile, the 9-12-year and 13-plus cohorts fulfil ultra-low-budget needs, predominantly in interior governorates where annual mileage is lower and maintenance can be owner-performed.
By Price Segment: Middle Band Rules But Premium Climbs
The USD 10,000–14,999 range represented 48.21% of the Oman used car market size in 2025, combining attainable monthly payments with reasonable mileage and spec. Strong financing approval for salaried staff earning OMR 600–1,000 places this bracket within reach. However, the USD 20,000–29,999 tier is the fastest climber at 7.22% CAGR, supported by managerial promotions in logistics, fintech, and tourism ventures spawned by Vision 2040. These buyers target CPO SUVs and crossovers with advanced driver-assist features. Below USD 5,000, inventory thinning from import curbs forces shoppers to accept higher odometers, while the USD 5,000–9,999 pocket still caters to first-jobbers and ride-share drivers.
Above USD 30,000, luxury saloons and performance SUVs attract cash buyers and well-bonused expatriates. Some units arrive courtesy of diplomatic staff turnover, offering low-mileage Mercedes-Benz and Lexus models. With organized dealers partnering with insurers to sell bundled maintenance and gap-coverage add-ons, the total cost of ownership in the premium band often undercuts the buyer’s initial perception, nudging more aspirational consumers upward.
By Sales Channel: Online Overtakes Bricks-and-Mortar
Online sales channel dominated 68.10% of the Oman used car market share in 2025, while growth remains a vibrant 8.79% CAGR through 2031. Therefore, the Oman used car market has become an e-commerce exemplar in the wider Gulf. Classified portals deliver inventory aggregation; pure-play e-retailers add 360-degree interior imaging, seven-day return windows, and home pick-up for trade-ins. OEMs now mirror consumer apps with digital storefronts that lock units for 24 hours while a loan application processes. Physical showrooms, however, preserve relevance for tactile appraisal and immediate drive-away of in-stock units.
Offline multi-brand dealers remain important in interior governorates where consumers value long-standing local relationships. Auction houses service dealers chasing bulk stock, particularly ex-rental batches. Click-and-collect hybrid models have sprouted in tandem: buyers finalise payment online and simply collect the vehicle from a depot, cutting transaction times by half.
Geography Analysis
Due to its dense population, higher median incomes, and concentrated dealer infrastructure, the Muscat governorate accounts for the lion's share of Oman's used car market activity. Salalah in Dhofar ranks second because tourism inflows swell demand for SUVs and MPVs during the khareef season. Industrial zones around Sohar and Duqm have stimulated a third demand cluster; rising blue-collar employment underpinning sustained turnover of pickups and compact sedans. Interior hubs such as Nizwa and Ibri exhibit brisk growth as new road links shrink travel times to Muscat, allowing rural buyers to commute while living outside the capital.
Cross-border trade patterns amplify regional sales. Al-Buraimi benefits from the seamless UAE border crossing, letting buyers shop a broader inventory before clearing Omani registration formalities. Musandam's enclave status similarly pulls inventory from Ras Al-Khaimah into local lots. Dealers in these border areas capitalise on duty-free inflows of near-new GCC stock, then resell nationwide via digital marketplaces. These intertwined flows entrench the Oman used car market as a conduit between supply-rich UAE and demand-rich interior Oman.
Road-building and industrial diversification under Vision 2040 continue to tilt regional dynamics. Once fully operational, Duqm refinery and the port's related petrochemical complex are expected to lift migrant employment, broadening the buyer base in Al Wusta governorate. As corporate leasing fleets mature, organized dealers envisage satellite branches in Duqm to manage trade-ins locally, strengthening the geographic diffusion of organized dealers.
Mordor Intelligence evaluates the used car market across all key regional markets, including Africa, with deeper country-level insights covering Tanzania, South Africa, Portugal, Egypt, Ethiopia, Hong Kong, Finland, and New Zealand.
Regulatory Landscape
The Royal Oman Police (ROP), through the Directorate General of Traffic, anchors the regulatory framework for used-vehicle transactions, covering technical inspection, registration renewal, and ownership transfer using its eTraffic services. A key compliance shift was implemented on July 1, 2025, when Oman stopped accepting the clearance certificate mechanism for importing vehicles from GCC markets. The change moved the documentation approach to export-certificate based requirements from the country of origin and tightened traceability for cross-border supply.
Technical roadworthiness controls have also broadened with Resolution No. 2024/88, which allows qualified, Omani-owned private maintenance and repair centers to provide vehicle technical inspection services under ROP oversight. The framework includes requirements for approved tools, electronic databases connected to traffic systems, and certified technicians, along with enforcement measures such as fines of 100 OMR, escalation for repeat violations, and possible suspension or cancellation of inspection licenses. As a result, documented inspections and compliant reconditioning before resale have become more valuable for used-car operators.
Value Chain Analysis
Supply formation in Oman used cars combines domestic trade-ins and fleet de-fleets with inflows from neighboring GCC markets, alongside structured import processes administered by the Directorate General of Customs. Import permitting for second-hand vehicles supports batch trading, while age-based restrictions, including the seven-year threshold for private vehicles referenced in the market context, steer the supply mix toward newer inventory. This reinforces the prominence of 0-2 year and 3-5 year stock in organized channels.
Midstream activities are centered on inspection, reconditioning, and valuation. ROP-controlled technical inspection is a gating step for many transactions and has expanded beyond government lanes via licensed private inspection facilities, creating a wider base of compliant service providers around hubs such as Sandan Industrial City. Downstream, vehicles are marketed and transacted through organized dealer groups with CPO programs and bundled financing, as well as high-volume digital marketplaces such as YallaMotor and OpenSooq that aggregate listings and accelerate price discovery. Final ownership transfer is completed through ROP processes (in-person or eTraffic) and requires valid insurance, tying insurers, inspection providers, and dealers into a shared transaction workflow.
Competitive Landscape
Competition remains moderately fragmented. Organised giants—Saud Bahwan Group (Toyota), Suhail Bahwan Group (Nissan), Al-Jenaibi International (BMW), and Zawawi Trading (Mercedes-Benz)—leverage OEM alliances to guarantee parts and offer CPO warranties, widening their moat. Digital marketplaces like Dubizzle Oman, YallaMotor, and CarSwitch aggregate listings from dealers and individuals alike, compressing price arbitrage and empowering buyers to compare across brands with a single app. Independent urban dealers counter with aggressive price bundles, often absorbing registration and insurance fees to lure footfall from online channels.
Strategic emphasis is shifting toward data. Dealers integrate AI valuation models that refine price quotes using live market data, accelerating stock turnover and minimising holding costs. Some have begun to pilot subscription packages that pair a vehicle with maintenance, insurance, and telematics, echoing mobility-as-a-service trends emerging in more mature markets. EV-specific diagnostic capacity is another battleground; workshops investing in high-voltage battery testing gear advertise results alongside traditional inspection reports to calm buyer anxiety.
Cross-border sourcing remains a competitive lever. Firms with logistics arms in Dubai can secure bulk consignments of de-fleeted SUVs and enjoy scale advantages during customs clearance. Conversely, border-town independents occasionally undercut Muscat prices by capitalising on GCC registration exemptions for two-year-old vehicles. Regulatory developments—such as tighter VAT compliance and potential digitised title transfers—will likely raise entry barriers over time, favouring capitalised, technology-savvy enterprises poised to consolidate share.
Oman Used Car Industry Leaders
YallaMotor.com
OpenSooq
OTE Group
Kavak
Omanicar
- *Disclaimer: Major Players sorted in no particular order

Market Opportunities and Future Outlook
The main opportunity is a gap in compliant inspection, certification, and reconditioning capacity that matches ROP controls and digital-first retailing. Resolution No. 2024/88, which authorizes Omani-owned private centers to conduct vehicle technical inspections under strict conditions, creates room for scalable networks that combine inspections, standardized condition grading, and documented repairs. This is especially relevant as online portals mediate most transactions and buyers increasingly seek machine-readable inspection outputs.
Cross-border sourcing also creates operational openings where documentation requirements are clear and tightening enforcement raises the value of specialist handling. The July 1, 2025 shift away from clearance certificates for GCC imports increases demand for services that manage export-certificate documentation, customs workflows, and batch procurement for dealers. In parallel, the market is building electrification capabilities, supported by the mandate in the report context that new fuel stations add EV chargers. That, in turn, raises demand for used-EV battery health checks, high-voltage workshop tooling, and warranty-backed EV remarketing programs within organized dealer and third-party service ecosystems.
Recent Industry Developments
- July 2026: Sooq Cars surpassed 1 million subscribers, marking a major milestone for the domestic digital automotive sales and services market. The platform uses AI to enhance user experience and plans to expand its service coverage beyond Oman.
- April 2025: Royal Oman Police (ROP) announced that from July 1, 2025 it will discontinue accepting vehicle imports through the clearance certificate system. The policy change affects used-car imports and tightens regulatory and market-entry barriers, supporting domestic market discipline and CPO demand growth.
- January 2025: Oman Government announced 2025 budget confirms a 3% GDP growth target with fuel-price-stabilisation funding. The macro backdrop for financing and demand in used cars is supported, boosting buyer affordability and used-car demand.


Research Methodology Framework and Report Scope
Market Definition and Coverage
For this methodology, the Oman used car market covers the resale value of pre-owned passenger and light commercial vehicles that are transacted within Oman through dealer and marketplace channels.
Scope exclusions: This sizing excludes brand-new vehicle sales, heavy trucks and buses, and non-vehicle services such as insurance, repair, or extended warranty sold separately.
Segmentation Overview
- By Vehicle Type
- Hatchbacks
- Sedans
- SUVs
- MPVs
- Others (Convertibles, Coupes, Crossovers, Sports cars)
- By Vendor Type
- Organized
- Unorganized
- By Fuel Type
- Petrol
- Diesel
- Hybrid
- Electric
- Others (CNG, Fuel Cell, etc.)
- By Vehicle Age
- 0 - 2 Years
- 3 - 5 Years
- 6 - 8 Years
- 9 - 12 Years
- Above 12 Years
- By Price Segment (USD)
- Below 5,000
- 5,000 - 9,999
- 10,000 - 14,999
- 15,000 - 19,999
- 20,000 - 29,999
- Above 30,000
- By Sales Channel
- Online
- Digital Classified Portals
- Pure-Play E-Retailers
- OEM-Certified Online Stores
- Offline
- OEM-Franchised Dealers
- Multi-Brand Independent Dealers
- Physical Auction Houses
- Online
Data Sources, Market Sizing, and Validation
Desk Research
Desk work started with country mobility and vehicle stock signals, followed by price and transaction behavior indicators that explain how fast used-car value can move in Oman. We referenced public statistical releases and transport datasets, such as those from Oman NCSI, customs and trade statistics, and road safety or registration series published by relevant ministries and regulators.
To anchor assumptions, we also used supporting sources such as central bank macro data, import and re-export commentary from port and logistics bodies, and public documents from industry associations and auctions where available. Company filings, press interviews, and dealer disclosures were used to sanity-check shifts in mix, financing availability, and online share, with select paid subscriptions used only to speed up company financial checks and shipment-level trade lookups. The sources listed here are illustrative, and many other public and paid references were also used for data collection, validation, and clarification.
Primary Interviews and Surveys
Primary work focused on validating how prices are set and discounted in real deals, and how quickly supply turns for common models, age bands, and mileage brackets. We spoke with used-car dealers, marketplace operators, fleet remarketing contacts, lenders, and service partners across key demand centers in Oman, then used follow-up checks to close gaps found in desk assumptions.
Distribution of primary research fieldwork respondents
| Company type | Respondent position |
|---|---|
| Top tier: 28% | CXOs: 20% |
| Mid tier: 51% | Functional/Unit leaders: 31% |
| Smaller Players: 21% | Managers: 49% |
Market-Sizing & Forecasting
The model starts from a top-down rebuild of Oman used-vehicle transaction value, where registration transfers, import and re-export flow patterns, and fleet replacement cycles are translated into annual units and then priced. Once that demand pool was shaped, it was corroborated with selective bottom-up approximations, such as dealer throughput checks and sampled average selling price (ASP) by vehicle class and age bucket, which are then adjusted for channel mix.
Inputs used to keep the math realistic include used-to-new affordability gaps, average depreciation by age and mileage, share of cash versus financed purchases, online listing intensity as a proxy for liquidity, and SUV versus sedan mix changes. Forecasting was handled using scenario analysis supported by simple multivariate regression, where macro indicators (population growth, non-oil GDP trend, and interest-rate direction) were tested against expected turnover and ASP progression. Where coverage gaps appeared in smaller informal channels, the shortfall was bridged using conservative penetration assumptions, and these were rechecked through interview feedback before finalizing totals.
Data Validation & Update Cycle
Results were cross-checked against independent signals such as vehicle parc movement, import clearance patterns, and observed price dispersion across major cities, before internal review sign-off. Outliers were flagged when implied transaction value per vehicle drifted from what dealers and lenders described, and those cases triggered re-contact and assumption tightening.
The report is refreshed annually, and interim updates are done when material events shift demand or pricing (for example, policy changes affecting imports or financing). Before delivery, a final analyst pass is completed so clients receive the latest updated view.
Mordor Intelligence's Oman Used Car Market Estimate Compared With Other Published Estimates
Published numbers for Oman used cars can differ even when the country and timeframe look similar, because the value can be counted at different points in the transaction and not every source treats re-exports, dealer margins, and taxes the same way. Differences also come from how each publisher converts local currency, chooses a base year, and decides which demand signals are strong enough to use.
In practice, the largest gaps usually come from whether market value is built from transfer activity and observed pricing by age and vehicle class, or whether it is inferred from a broader automotive spending proxy. Some estimates also apply aggressive ASP increases without testing them against financing mix and real listing discounts, which can lift the headline number in the short term. When transaction value is tied to observed transfer activity and realized price checks, with re-exports removed when they do not reflect domestic consumption, the total stays more traceable, as modeled by Mordor Intelligence.
Benchmark comparison
| Source | Market Size | Gaps in Research Methodology |
|---|---|---|
| Mordor Intelligence | USD 1.02 B (2025) | |
| Regional Consultancy A | USD 1.17 B (2024) | Uses an earlier base year and applies a broad used-share to total registrations, which can overstate value when ASP and vehicle mix shift year to year, and when re-exports are not cleanly removed. |
| Industry Portal B | USD 0.98 B (2025) | Leans on listing and asking-price signals with limited adjustment for actual deal discounts, higher-mileage mix, and offline transactions, which can undercount realized market value. |
The spread in the table is mainly explained by transaction definition and the pricing lens used, not by a single growth assumption. When transfer activity, mix, and realized discounting are tracked together, the resulting market value becomes easier to reproduce and update as conditions change.


Key Questions Answered in the Report
How large is the Oman used car market today?
The Oman used car market is valued at USD 1.06 billion in 2026 and is on track to reach USD 1.27 billion by 2031, expanding at a 3.72% CAGR.
Which vehicle type attracts the greatest demand?
SUVs hold 45.02% share and are also the fastest-growing category, advancing at a 8.35% CAGR through 2031 due to their versatility on Omani terrain.
How important are online channels for used-car sales in Oman?
Online platforms now capture 68.10% of transactions and are scaling at 8.79% annually, reflecting widespread mobile-payment adoption and government investment in digital infrastructure.
What is driving electric-vehicle growth in the secondary market?
Government mandates for universal charger installation at new fuel stations, electricity subsidies and improving battery diagnostics contribute to a 8.41% CAGR in used EV revenue.
Page last updated on:


 Your data is secure and never sold or shared.


