
Ethiopia Used Car Market Size and Share
Market Overview
| Study Period | 2020 - 2031 |
|---|---|
| Forecast Data Period | 2026 - 2031 |
| Base Year Market Size (2025) | USD 482.77 Million |
| Market Size (2026) | USD 493.97 Million |
| Market Size (2031) | USD 554.97 Million |
| Growth Rate (2026 - 2031) | 2.32 % |
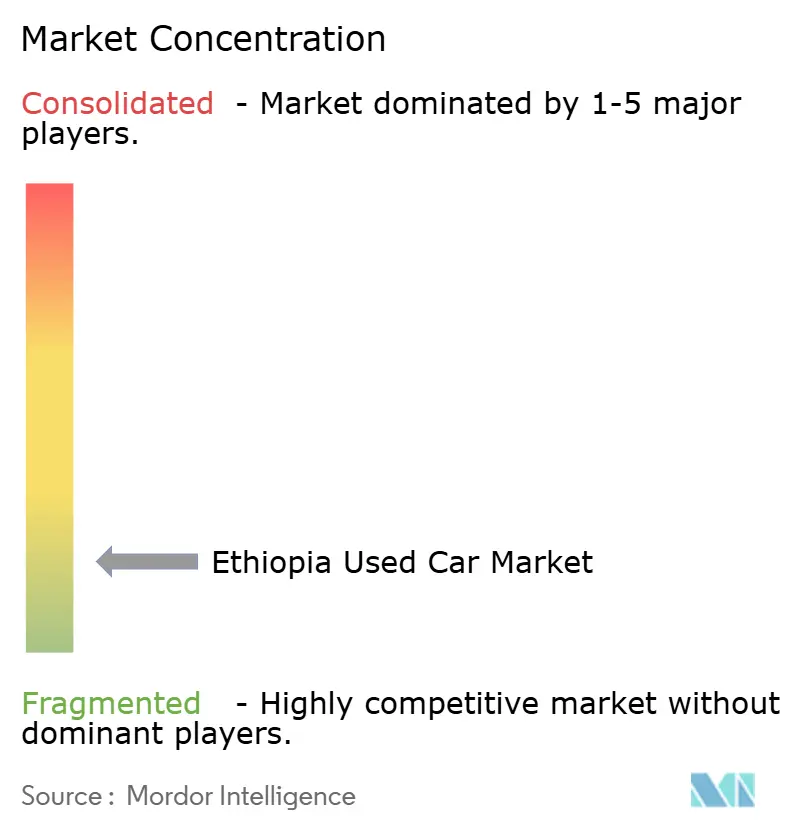
| Market Concentration | Low |
Major Players *Disclaimer: Major Players sorted in no particular order Image © Mordor Intelligence. Reuse requires attribution under CC BY 4.0. | |
Ethiopia Used Car Market Analysis by Mordor Intelligence
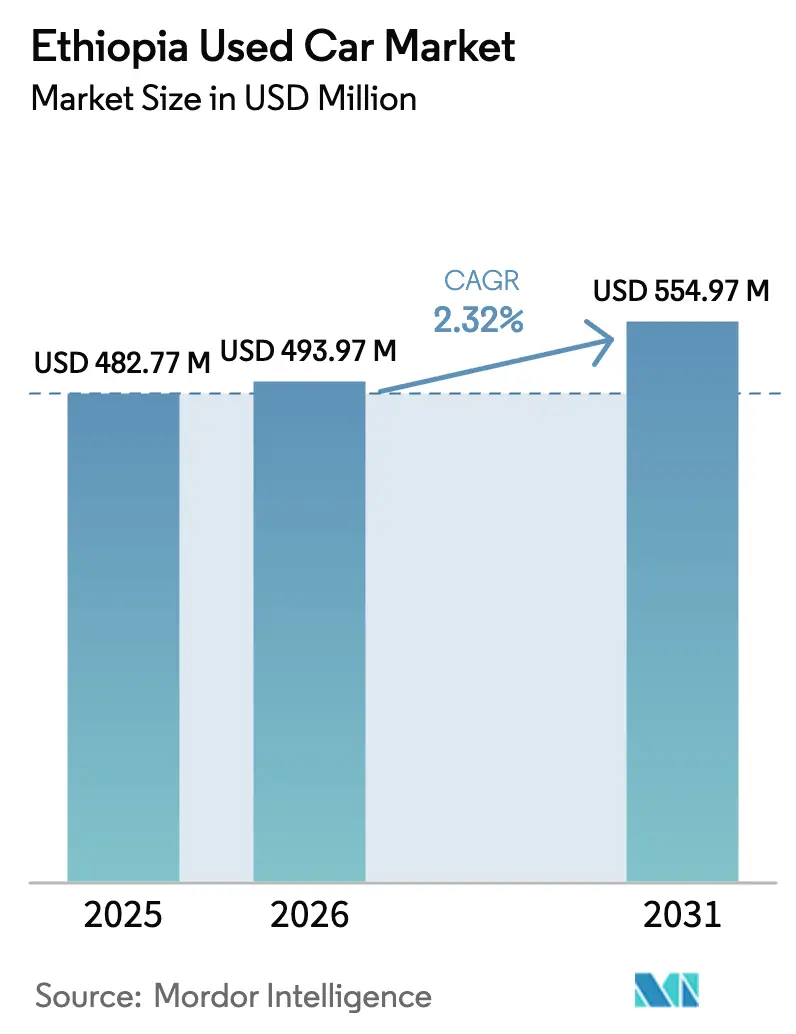
Ethiopia used car market size in 2026 is estimated at USD 493.97 million, growing from 2025 value of USD 482.77 million with 2031 projections showing USD 554.97 million, growing at 2.32% CAGR over 2026-2031. Growth is powered mainly by policy forces the nationwide ICE-import ban, high excise duties on new cars, and a July 2024 forex reform that loosened hard-currency access for importers, rather than by organic demand alone. The growing inflation-hedging motivations within Addis Ababa's urban middle class, combined with an increasing reliance on digital platforms, significantly bolster the demand for second-hand goods. Yet, despite this rising interest, persistent shortages in foreign exchange continue to limit the availability of inventory, creating a challenging landscape for both consumers and suppliers.
Key Report Takeaways
- By vehicle type, sedans led with 42.10% of the ethiopia used car market revenue share in 2025, while hatchbacks are forecast to expand at a 3.08% CAGR through 2031.
- By vendor type, the unorganized dealer segment controlled 58.30% of the ethiopia used car market share in 2025; organized dealers are the fastest-growing group, advancing at 2.71% CAGR.
- By fuel type, gasoline cars held a 63.90% of the ethiopia used car market share in 2025, whereas electric vehicles recorded the highest projected CAGR at 5.05% through 2031.
- By vehicle age, 6–8-year-old units commanded a 28.40% of the ethiopia used car market share in 2025, while 0–2-year vehicles grew the quickest at 3.06% CAGR.
- By price segment, units priced USD 5,000-9,999 captured 34.20% share in 2025, and models above USD 30,000 posted the fastest 5.21% CAGR.
Note: Market size and forecast figures in this report are generated using Mordor Intelligence’s proprietary estimation framework, updated with the latest available data and insights as of 2026.
Worldwide, activity is shaped by contributions from multiple countries and regions, with Ethiopia representing one among them. The global report on used car market by Mordor Intelligence reflects how these countries and regional layers combine into a single system.
Ethiopia Used Car Market Trends and Insights
Drivers Impact Analysis*
| Driver | (~) % Impact on CAGR Forecast | Geographic Relevance | Impact Timeline |
|---|---|---|---|
| High Excise Duties On New-Car Imports Widen Price Gap | +0.8% | Addis Ababa & major cities | Medium term (2-4 years) |
| Birr Devaluation Turns Cars Into Inflation Hedges | +0.5% | National, urban focus | Medium term (2-4 years) |
| Growing Urban Middle Class Uses Online Classifieds | +0.4% | Addis Ababa, Dire Dawa, Mekelle | Long term (≥ 4 years) |
| Influx of Re-exported GCC vehicles | +0.3% | Djibouti corridor & national | Short term (≤ 2 years) |
| Micro-Finance Expansion For Second-Hand Cars | +0.3% | Urban & peri-urban | Medium term (2-4 years) |
| ICE-Import Ban Boosts Demand For Affordable Used EVs | +0.2% | National, early in capital | Long term (≥ 4 years) |
| Source: Mordor Intelligence | |||
High Excise Duties On New-Car Imports Widen Price Gap
Excise bands introduced by Proclamation 1287/2023 push effective tax rates on engines above 1,800 cc to 100%, while 15% VAT and assorted surcharges can raise the landed cost of a new vehicle to more than five times its import value. This structure keeps the Ethiopia used car market attractive by pricing many first-owner vehicles beyond the reach of middle-income households. Demand settles most strongly in the USD 5,000-15,000 bracket where the absolute tax differential between new and pre-owned units is widest. The same duty burden, however, incentivizes informal import routes and odometer fraud that suppress government revenue and complicate market formalization [1]“Odometer Fraud in East African Vehicle Imports,” ENACT Africa, enact-africa.org.
Growing Urban Middle Class Uses Online Classifieds
Rising disposable incomes and smartphone penetration—Internet subscriptions in Addis Ababa climbed above 27 million in 2025—are normalizing digital search behaviour. Classified portals such as Qefira and Megebeya compress discovery costs and expose price mark-ups, nudging customers toward organized dealers with clear inspection records. Although the Ethiopia used car industry still closes most deals offline, lead-generation has shifted online, giving digitally enabled dealers incremental share in the Ethiopia used car market.
Birr Devaluation Turns Cars Into Inflation Hedges
The Birr lost 18% against the USD between 2024 and 2025. As bank savings erode in real terms, middle-class households channel funds into assets with both utility and resale value. Resale-friendly Japanese brands thus command price premiums, and turnover cycles shorten because owners treat cars as quasi-liquid hedges. Dealers that stock models with stable residuals gain pricing power, reinforcing the Ethiopia used car market’s role as a financial haven during currency volatility[2]“Birr Devaluation Spurs Asset-Seeking Middle Class,” African Business, african.business.
ICE-Import Ban Boosts Demand For Affordable Used EVs
Ethiopia outlawed every ICE import in January 2024, targeting 148,000 passenger EVs on its roads by 2032. Used-EV importers capitalize on zero-duty provisions, and Chinese OEMs led by GAC are already exploring local knock-down assembly. Yet adoption is gated by a nascent charging network—just 60 public stations cover a country of >120 million, so short-range compact EVs dominate initial volumes. With gasoline models still legal to resell, the Ethiopia used car market currently runs a dual-fuel inventory that cushions buyers through the policy transition [3] “Ethiopia – Automotive Industry Update,” U.S. International Trade Administration, trade.gov.
Restraints Impact Analysis*
| Restraint | (~) % Impact on CAGR Forecast | Geographic Relevance | Impact Timeline |
|---|---|---|---|
| Chronic FX Shortages Tighten Import Supply | -0.6% | National, inland regions | Medium term (2-4 years) |
| Trust & Transparency Gaps In Vehicle History | -0.4% | National, organized channels | Short term (≤ 2 years) |
| Planned Age-Based Emissions Testing May Scrap Oldest Stock | -0.3% | Urban centers first | Medium term (2-4 years) |
| Sparse EV-charging Network Heightens Residual-Value Risk | -0.2% | National, rural focus | Long term (≥ 4 years) |
| Source: Mordor Intelligence | |||
Chronic FX Shortages Tighten Import Supply
The July 2024 move to a managed float widened official-parallel spreads, but exporters still generate insufficient currency to fund robust vehicle inflows. Banks rank automotive letters of credit below priority goods, extending delivery lead times to 120 days or more. Importers increasingly use franco-valuta terms that require upfront hard currency, squeezing working capital and limiting model diversity. This scarcity inflates prices, reduces sales elasticity, and trims the Ethiopia used car market size growth outlook.
Trust & Transparency Gaps In Vehicle History
The absence of a national mileage-tracking registry and limited third-party inspection capacity allow odometer roll-backs and accident concealment to persist. Buyers discount organized-dealer pricing because they distrust certification seals, giving unorganized lots a cost advantage. Although the Ministry of Transport introduced a pilot digital registration module in 2025, uptake remains under 15% of annual transfers. Until verification systems mature, reputation risk continues to cap formal dealer share in the Ethiopia used car market.
*Our forecasts treat driver/restraint impacts as directional, not additive. The impact forecasts reflect baseline growth, mix effects, and variable interactions.
Segment Analysis
By Vehicle Type: Sedan Dominance Faces Hatchback Challenge
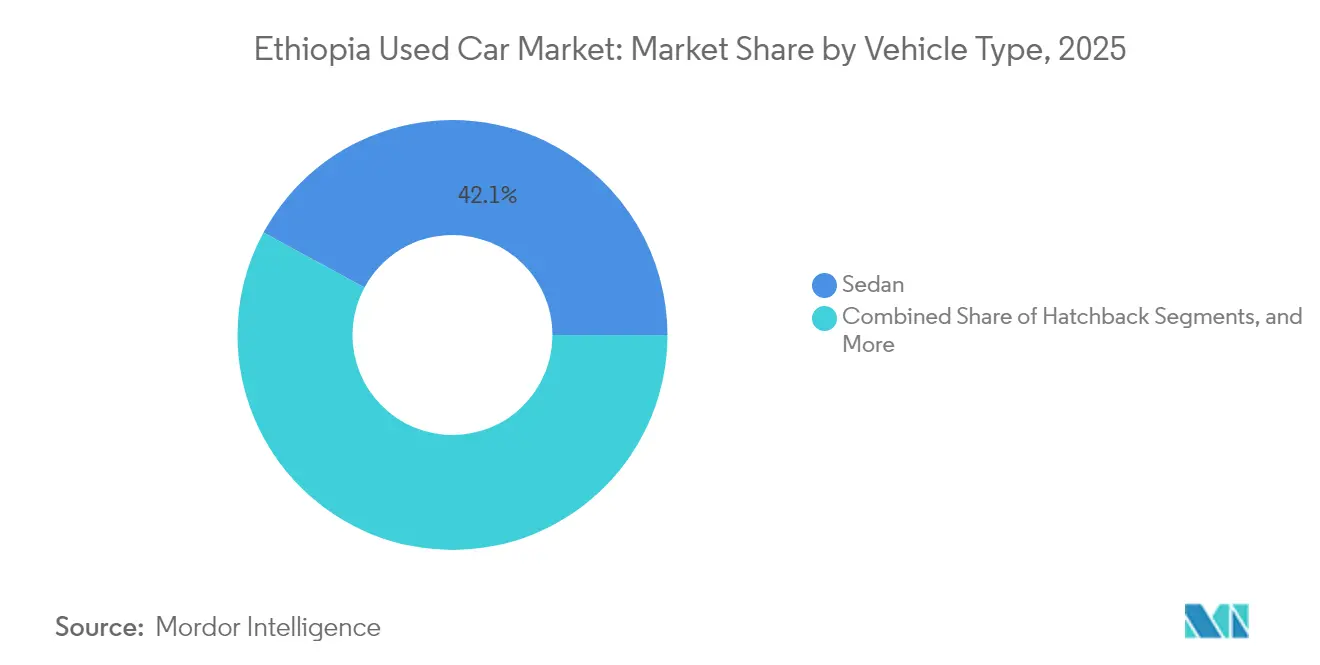
Sedans captured 42.10% of the Ethiopia used car market in 2025, buoyed by Addis Ababa commuters who value cabin space for ride-sharing and family transport. Hatchbacks, however, post the fastest 3.08% CAGR as fuel-conscious buyers migrate to lighter bodies that handle congested roads and rising fuel prices. Compact EV hatchbacks further strengthen this trend because they deliver better range per kilowatt than their sedan counterparts.
Cost-of-ownership calculus is shifting: sedan tires and body parts cost up to 18% more, eroding the prestige premium that once defined urban aspirations. As the ICE ban steers new stock toward compact electric formats, the Ethiopia used car market size for hatchbacks could narrow the sedan gap within the decade. Dealers that pre-position spares for popular Toyota Vitz or BYD Dolphin models stand to outperform peers relying on legacy mid-size sedans.


By Vendor Type: Unorganized Dealers Resist Digital Disruption
Unorganized lots controlled 58.30% of the Ethiopia used car market size in 2025 volume because they bypass formal VAT invoicing and flexible payment schedules that fit cash-based buyer habits. Organized players grow at 2.71% CAGR, leveraging bank partnerships that offer installment plans and insurance bundles. Hybrid models—where traders advertise on classifieds but close deals in curb-side yards—blur segments yet still tilt toward informality.
Policy pressure favors registration and tax compliance, but crackdowns often trigger a temporary supply shock as small traders retreat to the informal fringe. Unless authorities complement enforcement with financing incentives and low-fee licensing, the Ethiopia used car market share of unorganized vendors will remain above 50% by 2031.
By Fuel Type: Gasoline Resilience Despite Policy Pressure
Gasoline cars retained a 63.90% of the Ethiopia used car market share in 2025 because existing inventory remains legal and refuel infrastructure is universal. Electric units accelerate at 5.05% CAGR, but their penetration stays urban-centric, given charging gaps in secondary cities. Diesel pickups serve agro-logistics but face tighter emissions scrutiny and a higher diesel excise tax.
As used EV volumes rise, buyers worry about battery life and module replacement costs that still exceed USD 3,500. Dealers mitigate fears by importing cars with state-of-health certificates, yet warranty enforcement is weak. The Ethiopia used car market size for gasoline models will therefore erode slowly rather than collapse abruptly.
By Vehicle Age: Mid-Age Preference Reflects Value Optimization
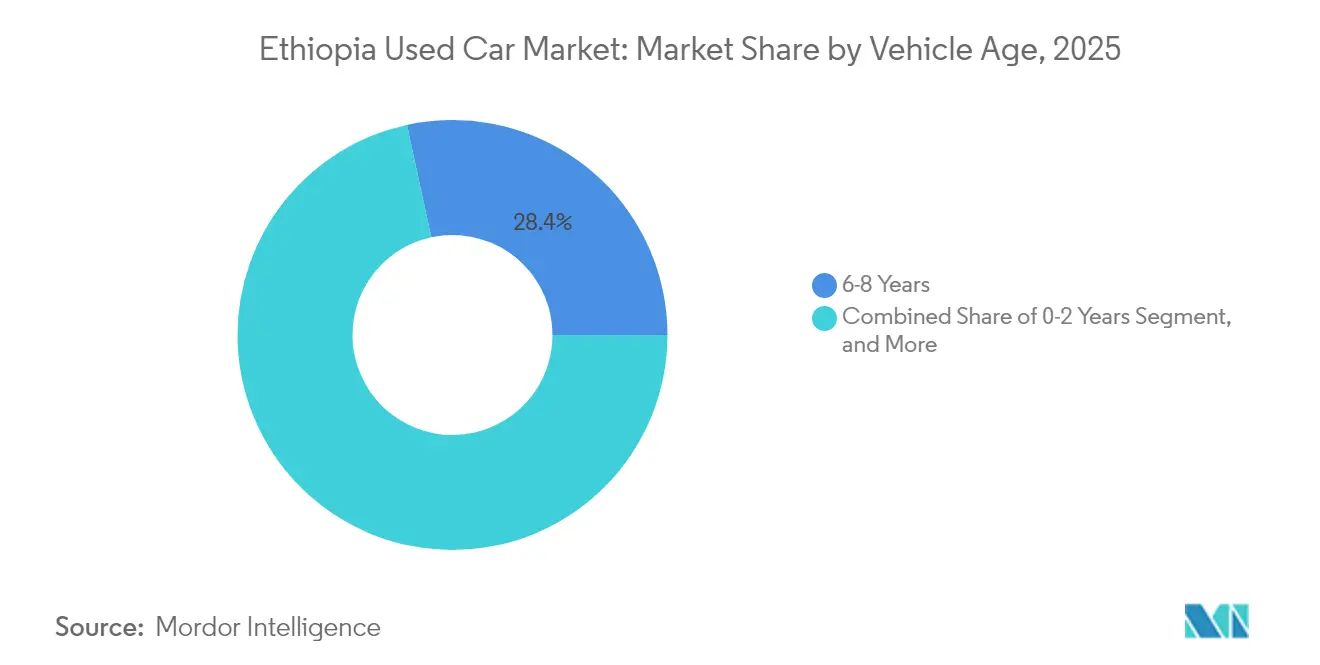
Cars aged 6–8 years commanded a 28.40% of the Ethiopia used car market share in 2025, striking the sweet spot where depreciation flattens but reliability remains high. New foreign-exchange rules and asset-backed micro-finance push 0–2-year models up at 3.06% CAGR, yet loan tenures seldom exceed 36 months, curbing uptake among lower-middle-income buyers.
Planned emissions checks threaten 15-year-plus imports, prompting traders to pivot inventories toward under-10-year stock. The Ethiopia used car market share of these mid-age units should therefore stay resilient even as newer cohorts grow faster.
By Price Segment: Middle-Market Dominance with Premium Growth
Units priced USD 5,000-9,999 captured 34.20% of the Ethiopia used car market in 2025 turnover, where financing burdens remain manageable and excise-driven mark-ups are moderate. Premium brackets above USD 30,000 log 5.21% CAGR as executives, diplomats, and repatriates seek luxury SUVs omitted from the new-car roster after the ICE ban.
Middle-income households still face a 35% import duty even on used cars, so credit cost, not sticker price, often dictates purchase ceiling. As banks pilot Sharia-compliant asset leasing, mid-range affordability could expand, cementing Ethiopia's used car market position as a mobility ladder for the emerging middle class.
Geography Analysis
Addis Ababa generates more than half of Ethiopia’s used-car turnover, supported by concentrated wealth, ride-hailing fleets, and embassies that refresh vehicles frequently. Transaction values in the capital average higher than the national mean because premium SUVs and near-new EVs cluster around diplomatic quarters.
Secondary hubs, Dire Dawa, Mekelle, and Bahir Dar, collectively drive a quarter of national volume, favouring utility pickups and compact hatchbacks. These cities benefit from better road links to the Djibouti corridor, shaving logistics costs for coastal imports.
Rural markets remain thin; vehicle density outside urban areas is low, with financing scarcity, poor maintenance networks, and limited electricity reliability slowing EV adoption. The national road-and-power build-out could gradually deepen penetration, particularly for commercial vehicles that support agro-value chains.
Mordor Intelligence provides coverage of the used car market across other key regional markets, including Africa, each with their regulatory frameworks and demand patterns. Detailed country-level analysis extends to Kenya, Tanzania, Finland, New Zealand, Norway, Myanmar, Switzerland, and Sri Lanka incorporating local coverage and market participation, as required.
Competitive Landscape
Ethiopia’s used-car arena is highly fragmented, with traditional roadside traders, emerging digital platforms, and organized dealerships all vying for customers. Offline lots still dominate discovery in lower-income districts, but platforms such as Megebeya aggregate inventory, provide reputational scoring, and lift buyer confidence.
Strategic moves increasingly revolve around vertical integration: local assembler Belayneh Kindie Metal Engineering is investing in EV lines that could feed certified “as-new” stock into dealer networks, while Chinese automaker GAC’s May 2025 launch of two EV models plus knock-down assembly plans shows OEM appetite to embed locally.
Organized dealers differentiate through service bundles—warranty extensions, battery-health certificates, and trade-in guarantees. Informal vendors counter with aggressive pricing and flexible settlement. The resulting price-service barbell keeps most buyers visiting multiple channels before closing a deal, sustaining high search costs and preserving room for transparent, data-rich platforms to expand.
Ethiopia Used Car Industry Leaders
Megebeya.com
Nyala Motors
Proxima Auto Car Dealer
Marathon Motors Engineering
Cars 4 Africa
- *Disclaimer: Major Players sorted in no particular order

Market Opportunities and Future Outlook
Ethiopia's January 2024 ICE-import ban has set up a transition window in which the used market keeps circulating a largely gasoline fleet (63.90% share in 2025) while buyers and dealers test affordable EVs in Addis Ababa. That mix creates whitespace for organized used-vehicle retail, but differentiation depends on closing trust gaps that persist without a national mileage-tracking registry and with limited third-party inspection capacity. The Ministry of Transport's pilot digital registration module introduced in 2025 saw uptake under 15% of annual transfers, leaving room for platforms and dealers to stand out with inspection records, battery state-of-health certificates, and more complete transfer documentation.
Digital discovery and brokerage-led sourcing are also taking hold as inventory access remains constrained by chronic FX shortages and import lead times. Local platforms such as Megebeya and classifieds like Qefira are already generating leads and surfacing price signals, while EV availability is being broadened through listings and brokerage activity, including BYD models, that align with the current charging footprint (about 60 public stations cited in the report context). On the supply side, capability-building and service-led models, alongside assembly interest signaled by players such as GAC exploring knock-down assembly and local industrial investment in EV lines, support a route toward more certified, near-new stock entering organized channels even as import rules and FX allocation keep overall volumes tight.
Recent Industry Developments
- June 2026: Megebeya.com facilitated sale of 2026 BYD Yuan Up Smart Driving Edition. The sale added to online EV inventory in the Ethiopia used-car market. It also increased consumer exposure to EV options through the platform.
- May 2026: Megebeya.com offered zero-kilometer 2025 BYD Sealion 05 electric vehicles for sale. The availability of new-form EV stock through the marketplace supports EV adoption in the used segment. The platform also reinforced its positioning as a source for more certified EV inventory.
- April 2026: Nyala Motors S.C. inaugurated a new modern commercial truck showroom in Addis Ababa. The showroom expanded the company's commercial distribution footprint. It also strengthened after-sales capacity in the truck segment.


Research Methodology Framework and Report Scope
Market Definition and Coverage
For this study, the market is defined as the value of used passenger and commercial vehicles sold within Ethiopia through organized dealers and informal resale channels, counted at transaction prices in USD for each year.
Scope exclusions: It excludes new vehicle sales, parts and maintenance services, and vehicle financing or insurance fees.
Segmentation Overview
- By Vehicle Type
- Hatchback
- Sedan
- Sport Utility Vehicles (SUVs)
- Multi-Purpose Vehicles (MUVs)
- By Vendor Type
- Organized
- Unorganized
- By Fuel Type
- Gasoline
- Diesel
- Hybrid
- Electric
- Others (LPG, CNG, etc.)
- By Vehicle Age
- 0 - 2 Years
- 3 - 5 Years
- 6 - 8 Years
- 9 - 12 Years
- Above 12 Years
- By Price Segment (USD)
- Up to 5,000
- 5,000 - 9,999
- 10,000 - 14,999
- 15,000 - 19,999
- 20,000 - 29,999
- Greater than equals 30,000
Data Sources, Market Sizing, and Validation
Desk Research
Desk research was used to set the Ethiopia country context and to anchor the demand and supply signals that affect second-hand vehicle availability and pricing. We reviewed public datasets and publications such as customs and trade statistics, the Ethiopian Statistics Service for macro indicators, the National Bank of Ethiopia for foreign exchange and inflation signals, and road transport and registration releases from relevant transport authorities.
To connect these signals to market value, we also used sources like trade association updates, peer-reviewed transport and emissions papers, and reputable press coverage of import policy changes. Company websites, product listings, and investor-style materials from active dealers and marketplaces were reviewed to understand typical vehicle types, asking price bands, and how quickly pricing changes after currency moves. Where needed, we supplemented with paid subscriptions for company financials and intelligence, plus import and export shipment-level data to sanity-check vehicle inflow trends. The sources listed here are illustrative only, and additional references were used to collect, validate, and clarify data points.
Primary Interviews and Surveys
We use interviews and surveys with Ethiopia-based importers, organized and informal dealers, financing specialists, fleet operators, and vehicle buyers. Respondents clarify price levels, vehicle turnover, vehicle age, and the differences between dealer, private-seller, and digital-classified activity. Their input is compared with secondary data before assumptions and the final analysis are set.
Distribution of primary research fieldwork respondents
| Company type | Respondent position |
|---|---|
| Top tier: 25% | CXOs: 15% |
| Mid tier: 55% | Functional/Unit leaders: 30% |
| Smaller Players: 20% | Managers: 55% |
Market-Sizing & Forecasting
Sizing started from a top-down build where import and registration signals, adjusted for used-vehicle share and resale circulation, were used to reconstruct the annual pool of used vehicle transactions in Ethiopia. After that demand pool was built, it was converted into market value using price bands that reflect the mix of passenger cars and commercial vehicles, vehicle age ranges, and typical negotiation discounts observed in the market.
To keep the model realistic, a few inputs were treated as key drivers rather than trying to over-build the dataset. These included the level of foreign exchange availability for importers, the pace of exchange rate movement, import duties and compliance rules that affect landed cost, the share of imports routed through common corridors, and observable shifts in consumer preference toward lower running-cost vehicles. Where data gaps existed, assumptions were made conservatively and then stress-tested through calls, followed by selective bottom-up approximations using sampled listings and dealer throughput checks to adjust totals.
For forecasting, scenario analysis was used, supported by short series trend fitting on the main drivers, so the outlook reflects different paths for currency conditions and import policy enforcement. Forecast assumptions were reviewed with market participants, and then the final trajectory was selected based on the most consistent set of signals across interviews and public indicators.
Data Validation & Update Cycle
Validation was done through triangulation across independent signals, followed by variance checks at each step of the model. We compared implied transaction volumes and average prices against import flow direction, registration momentum, and the pricing shifts reported by dealers, and then investigated outliers before accepting results.
A second analyst review is completed to confirm that key assumptions are consistent with the latest macro and policy context, and re-contacts are triggered if a major input moves sharply (for example, foreign exchange rules, import restrictions, or sudden price inflation). Reports are refreshed annually, with interim updates when material events occur, and a final pre-delivery pass is completed so the published numbers reflect the latest available information.
Mordor Intelligence's Ethiopia Used Car Market Size Versus Other Published Estimates
Published numbers for Ethiopia used car value can differ even when the topic name looks similar, because the counted transactions and price basis are not always the same. The biggest differences usually come from whether only imported used vehicles are counted, or if domestic resale cycles are included as well, along with how listing prices are converted into actual deal prices.
A second set of gaps comes from timing choices, such as using older exchange rates, assuming a straight-line price trend, or not reflecting step changes after policy shifts and foreign exchange loosening. When the model only takes customs value or only takes online advertised prices, the total can land lower or higher than a transaction-based view, and that is why the spread shows up in the table.
Benchmark comparison
| Source | Market Size | Gaps in Research Methodology |
|---|---|---|
| Mordor Intelligence | USD 482.77 M (2025) | |
| Trade Journal A | USD 160.00 M (2023) | Often closer to import-only valuation (declared customs value), which misses domestic resale turnover and also understates the pricing uplift from duties, fees, and dealer margins. |
| Industry Blog B | USD 482.77 M (2024) | Uses a different base year and commonly mirrors asking prices from listings without consistently applying transaction discounts, and it may carry forward earlier exchange rate assumptions. |
Overall, the gap pattern is mainly explained by what is being counted and how prices are translated from documents or ads into real sales. When domestic resale is included and price bands are refreshed around policy and forex shifts, the value line becomes easier to trace year by year, which is the approach applied by Mordor Intelligence.


Key Questions Answered in the Report
What is the current size of the Ethiopia used car market?
The market stands at USD 493.97 million in 2026 and is projected to reach USD 554.97 million by 2031.
Which vehicle type leads Ethiopia’s used-car market?
Sedans command the largest 42.10% share, while hatchbacks grow fastest at a 3.08% CAGR.
How will Ethiopia’s ICE-import ban influence used-car demand?
It initially sustains gasoline-car resale but gradually redirects demand toward used EVs, especially compact hatchbacks.
What restrains quicker expansion in Ethiopia’s used-car industry?
Foreign-exchange scarcity, odometer fraud, pending emissions tests and a limited charging network remain the main brakes.
Page last updated on:


 Your data is secure and never sold or shared.


