
Casino Gambling Market Size and Share
Market Overview
| Study Period | 2021 - 2031 |
|---|---|
| Market Size (2026) | USD 359.32 Billion |
| Market Size (2031) | USD 624.04 Billion |
| Growth Rate (2026 - 2031) | 11.67 % |
| Fastest Growing Market | Middle East and Africa |
| Largest Market | Asia-Pacific |
| Market Concentration | Medium |
Major Players *Disclaimer: Major Players sorted in no particular order Image © Mordor Intelligence. Reuse requires attribution under CC BY 4.0. | |
Casino Gambling Market Analysis by Mordor Intelligence
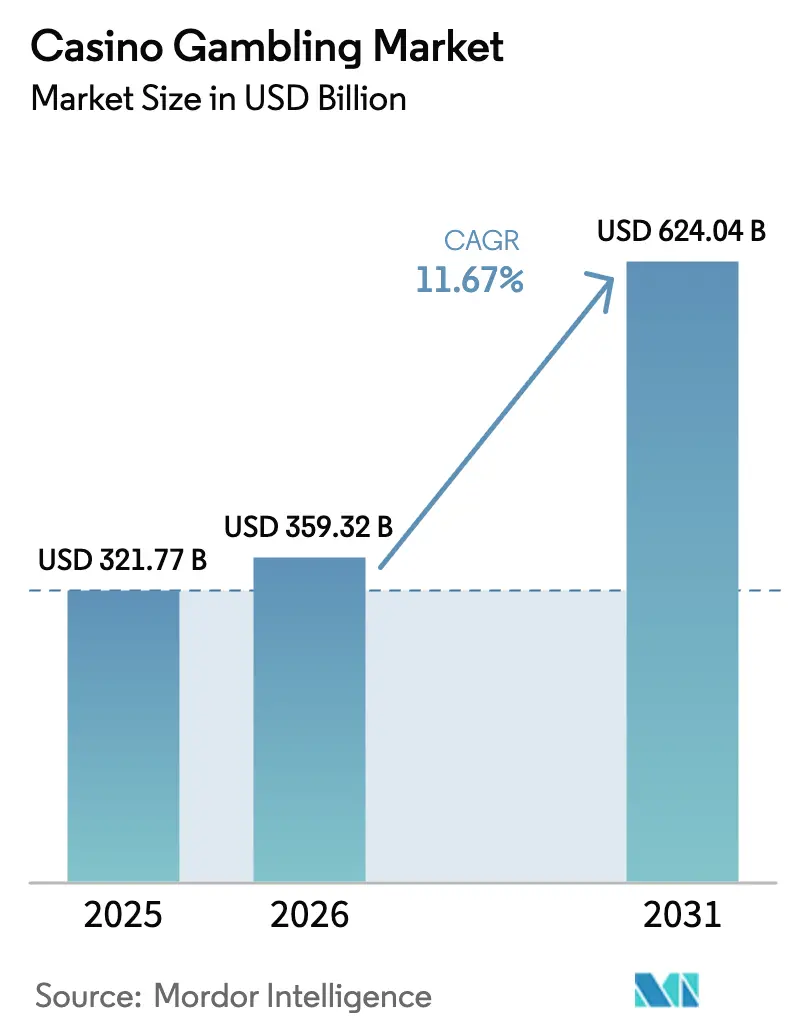
The Casino Gambling Market size was valued at USD 321.77 billion in 2025 and is estimated to grow from USD 359.32 billion in 2026 to reach USD 624.04 billion by 2031, at a CAGR of 11.67% during the forecast period (2026-2031).
Operators continue to pivot from VIP-heavy models toward premium-mass and mass-market channels that capture more stable spend through integrated resort formats that combine gaming with hotels, MICE, retail, and entertainment. Product dynamics are shifting as live dealer content grows faster than legacy RNG formats, supported by studio investments and marquee collaborations that stream from iconic properties to elevate authenticity. Regional growth is strongest in Asia-Pacific, where Macau and Singapore anchor recovery, while selective greenfield projects in the Middle East set a new frontier for destination resorts that link gaming with high-end hospitality[1]. Competitive positioning favors a balance between on-property experiences and connected digital ecosystems that unify loyalty, payments, and compliance across touchpoints to protect share in the casino gambling market.
Key Report Takeaways
- By game type, slots held 52.76% of the casino gambling market share in 2025, while live casino gaming is projected to expand at an 11.83% CAGR through 2031.
- By facility format, integrated resort casinos accounted for 47.39% of the casino gambling market share in 2025, while cruise-ship facilities are forecast to grow at a 10.76% CAGR between 2026 and 2031.
- By ownership model, commercial operators captured 61.74% of revenue in 2025, while tribal and indigenous casinos in the United States are projected to grow at a 9.39% CAGR from 2026 to 2031.
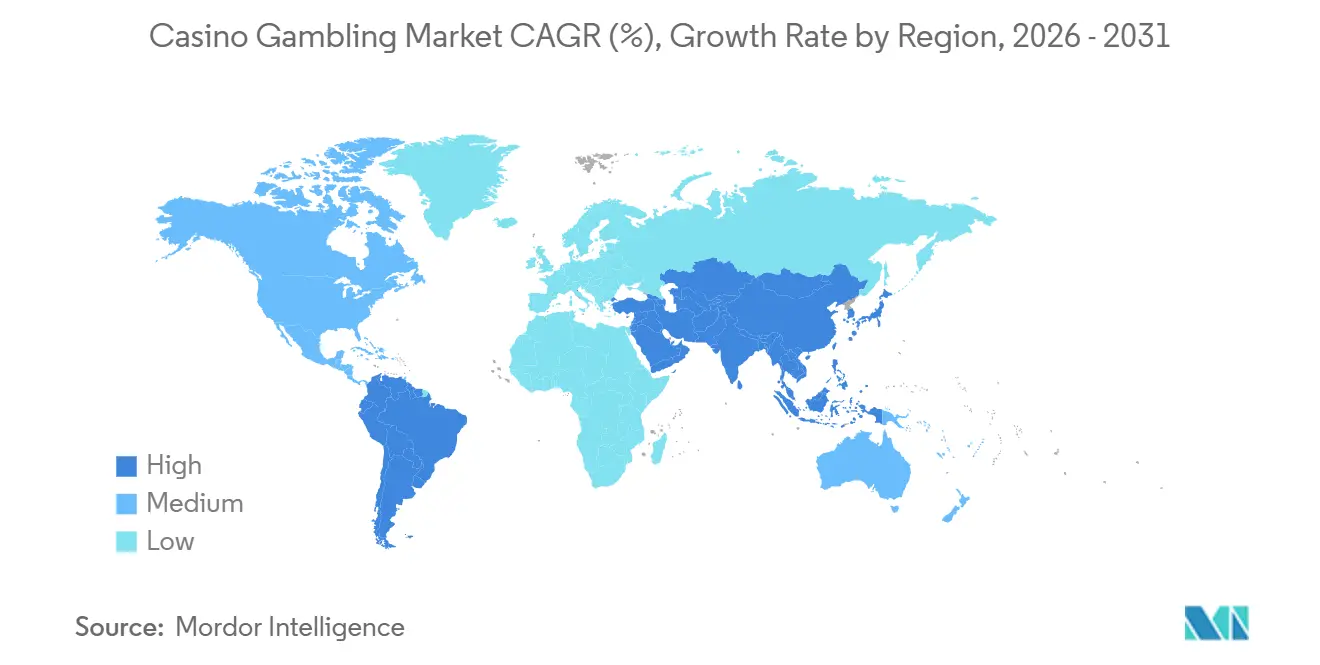
- By geography, Asia-Pacific contributed 38.38% of 2025 revenue, while the Middle East and Africa segment is forecast to grow at an 8.39% CAGR to 2031.
Note: Market size and forecast figures in this report are generated using Mordor Intelligence’s proprietary estimation framework, updated with the latest available data and insights as of January 2026.
Market Trends and Insights
Drivers Impact Analysis of Casino Gambling Market*
| Driver | (~) % Impact on CAGR Forecast | Geographic Relevance | Impact Timeline |
|---|---|---|---|
| Integrated-resort visitation uplift | 2.1% | Global, strongest in the Asia-Pacific core (Japan, Thailand, Philippines) and Middle East & Africa (UAE, Saudi Arabia) | Medium term (2-4 years) |
| Regulatory expansion in the ASIA-PACIFIC | 1.8% | Asia-Pacific core (Japan, Thailand, Philippines, India), spill-over to global operators | Long term (≥ 4 years) |
| Post-COVID air-capacity rebound | 1.5% | Global, particularly North America and Europe, recovery corridors | Short term (≤ 2 years) |
| Cashless RFID analytics adoption | 1.3% | North America & Europe early-adopter jurisdictions, Asia-Pacific rollout (Macau, Singapore) | Medium term (2-4 years) |
| High-net-worth tourism in GCC | 0.9% | Middle East & Africa, with UAE and Saudi Arabia concentration | Medium term (2-4 years) |
| Skill-based table variants | 0.6% | Global, with United States and European millennial/Gen Z demographics | Long term (≥ 4 years) |
| Source: Mordor Intelligence | |||
Integrated-Resort Visitation Uplift
The core driver is the integrated resort model, where Marina Bay Sands reports 65% of revenue from non-gaming amenities that include luxury retail, Michelin-starred dining, and large-scale MICE, which stabilizes earnings relative to gaming-only venues in the casino gambling market. The Osaka integrated resort, developed by MGM and ORIX, targets 20 million annual visits, featuring large conference capacity, luxury hotels, and entertainment assets designed to compete directly with Singapore and Macau. In the Middle East, Wynn Al Marjan Island in Ras Al Khaimah will open with 1,530 rooms, an expansive gaming area, and dedicated VVIP access, targeting ultra-high-net-worth visitors from the Gulf and South Asia. [2] Cruise lines are also scaling gaming capacity, with Royal Caribbean’s July 2026 debut of Legend of the Seas adding a two-story Casino Royale that signals a broader fleet pivot toward gaming as a core entertainment pillar. Southeast Asia continues to validate the model as City of Dreams Manila recorded strong mass performance in 2025, while Galaxy Macau’s extensive non-gaming slate extends stays and widens on-property spend.
Regulatory Expansion in Asia-Pacific
Japan’s approval of the Osaka integrated resort is a watershed that caps casino floor space and mandates MICE, which aligns with a social license model and invites global participation in a high-barrier framework that supports the casino gambling market. In Singapore, the Gambling Regulatory Authority extended Marina Bay Sands’ license by three years while issuing a shorter extension for Resorts World Sentosa, highlighting performance-based renewals tied to tourism and non-gaming outcomes[3]. Macau requires USD 14.85 billion in collective non-gaming investment over 2023 to 2033, accelerating diversification away from VIP and strengthening the long-term appeal of integrated properties. In the Philippines, operators work within PAGCOR’s structure that enforces ownership, reporting, and responsible-gambling obligations that shape both expansion pace and operating practices[4]. South Korea’s mix of foreign-only casinos and Kangwon Land’s domestic access creates policy variability that operators monitor as they plan capital and brand deployment in Northeast Asia.
Post-COVID Air-Capacity Rebound
Air capacity normalization supports visitation for destination markets, with Singapore recording a steady tourism rebound that lifts gaming and non-gaming revenue bases at Marina Bay Sands. Operators on the Las Vegas Strip reported softer demand in 2025 and adjusted pricing to reset value perception as they recalibrated room rates and marketing to stabilize volumes. Macau’s 2024 momentum aligns with improved travel flows from mainland China and Southeast Asia, even as volumes have yet to match pre-pandemic peaks, which keeps the focus on premium-mass in the casino gambling market. Regional United States casinos with drive-to catchments show resilience, since these properties are less exposed to international flight dependency and capture recurring local play. Cruise itineraries add a complementary hedge by monetizing captive onboard audiences, which reduces reliance on airlift patterns that affect destination casinos.
Cashless RFID Analytics Adoption
Casinos are deploying RFID chips, computer vision, and digital wallets to reduce cash handling, automate AML reporting, and strengthen data-driven decision-making on the floor in the casino gambling market. MGM’s mobile ecosystem consolidates wallet functions, in-app service, and loyalty accrual to unify online and on-property journeys across BetMGM and Strip resorts. Wynn integrates cashless payments with compliance workflows to reduce manual reconciliation and accelerate audit readiness under Nevada and federal expectations. Tribal operators use sovereign frameworks to pilot biometric authentication, mobile funding, and early cashless rollouts ahead of commercial deployments, which supports faster innovation cycles. Loyalty programs at Genting, Galaxy, and Hard Rock tie cross-property spending to personalized offers that increase customer lifetime value and repeat visitation.
Restraints Impact Analysis of Casino Gambling Market*
| Restraint | (~) % Impact on CAGR Forecast | Geographic Relevance | Impact Timeline |
|---|---|---|---|
| Tax-rate escalation | -1.4% | North America and Europe | Medium term (2-4 years) |
| Responsible-gaming tightening | -0.8% | Global, led by the United Kingdom and Europe, with Brazil/India introducing stringent frameworks | Medium term (2-4 years) |
| Dealer-talent shortages | -0.5% | United States (hospitality sector), Macau (satellite casino closures), regional Asia-Pacific | Short term (≤ 2 years) |
| Loyalty-data cyber-risk | -0.3% | Global, with the highest exposure in digitally mature markets (United States, Singapore, Europe) | Short term (≤ 2 years) |
| Source: Mordor Intelligence | |||
Tax-Rate Escalation
Higher gaming taxes in select U.S. states, such as the tiered regime in Illinois, weigh on property EBITDA and reallocate dollars from reinvestment to remittance. Macau’s 40% composite levy, plus mandated non-gaming spending under concession terms, pushes operators to pursue mass-market yield and cost discipline at scale. Discussions in Massachusetts about raising online tax rates reflect a broader pattern of fiscal tightening in mature markets that operators monitor closely. These dynamics influence capital planning, as seen in operators signaling multiyear investment commitments to protect competitiveness under higher tax burdens in the casino gambling market. Tribal operators maintain a relative edge through sovereign status, which sustains structurally higher margins that support sustained reinvestment cycles.
Responsible-Gaming Tightening
The United Kingdom introduced stricter design standards for remote slots and enhanced affordability checks, which required software and monitoring changes across operator and supplier stacks. Singapore ties license duration and renewal terms to responsible-gambling outcomes, reinforcing the link between player protection and market access for integrated resorts. Brazil’s 2025 framework adds identity verification, capital reserve obligations, and license fees that increase the fixed-cost base for digital operators. Macau is pursuing tighter advertising and self-exclusion enforcement that adds operational costs and procedural oversight to everyday operations in the casino gambling market. Operators respond by expanding budgets for compliance, technology, and third-party assurance to maintain regulatory confidence and brand trust.
*Our forecasts treat driver/restraint impacts as directional, not additive. The impact forecasts reflect baseline growth, mix effects, and variable interactions.
Casino Gambling Market Segment Analysis
By Game Type:
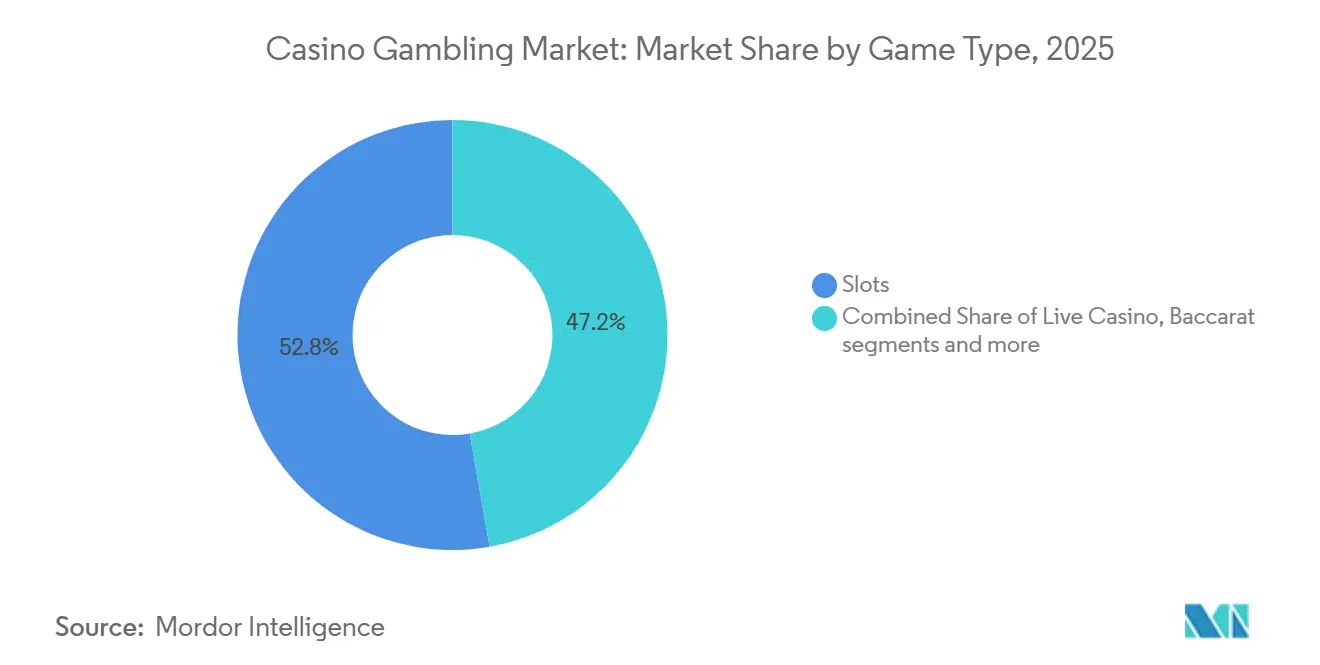
Live Casino Gains Ground Despite Slots’ DominanceSlots held 52.76% of revenue in 2025, underscoring the core role of high-velocity, low-labor formats that anchor floor productivity in the casino gambling market. Live dealer content is expanding at an 11.83% CAGR through 2031 as players seek dealer-led authenticity that elevates engagement beyond RNG outcomes. Major suppliers advance differentiated pipelines, with studio launches and high-limit tables that target premium-mass and VIP cohorts with tailored experiences. Baccarat’s large share in Macau validates the centrality of table games in certain hubs even as mass-market dynamics reshape the mix. These shifts support a balanced product strategy that aligns with changing preferences and the omnichannel direction of the casino gambling market.
The pipeline for live titles expanded, with leading studios and operator-branded streams building new reasons to play and stay within connected ecosystems. Select premium properties stream branded roulette and baccarat from iconic venues, merging destination appeal with digital reach across jurisdictions. The casino gambling market size for live dealer content scales alongside network effects from distribution, creator partnerships, and on-property cross-promotion that lifts take-rates. Equipment suppliers broaden portfolios to include multi-game cabinets and features that introduce choice and skill elements without breaking regulatory thresholds. Competitive gaming and esports activations create adjacent engagement vectors that support table game awareness and cohort expansion for the casino gambling industry.

By Facility Format:
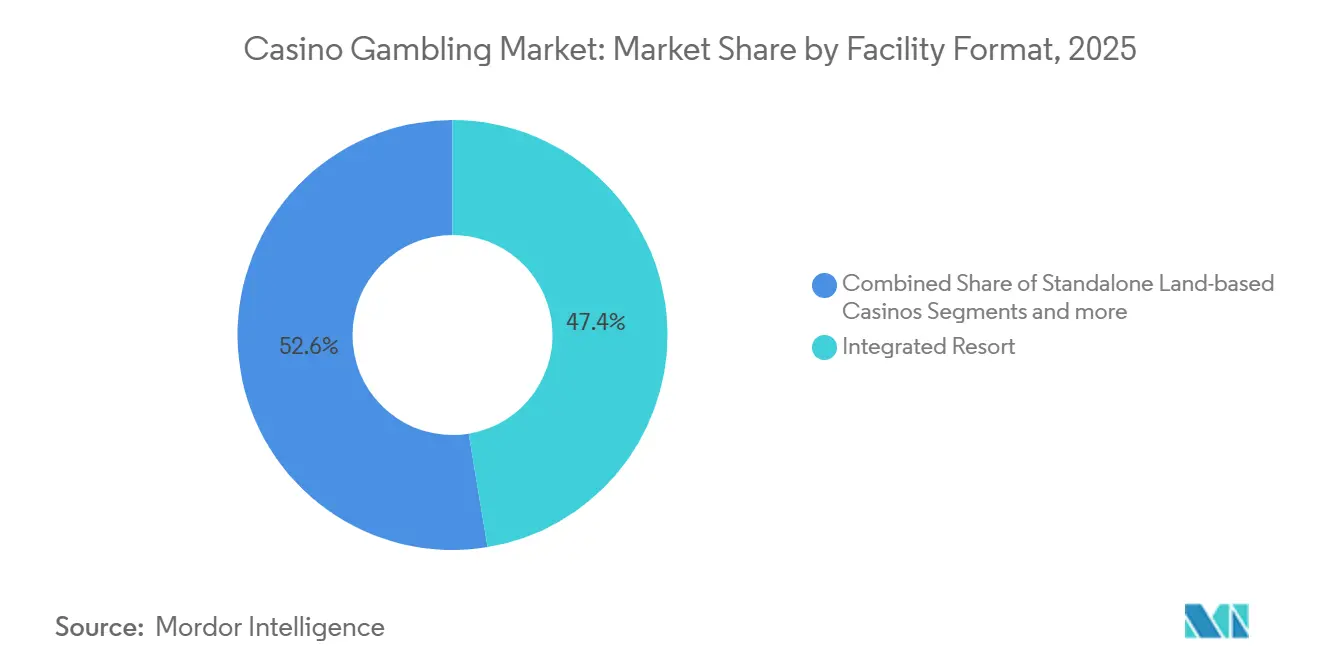
Cruise Ships Sail Past Growth ExpectationsIntegrated resort casinos commanded 47.39% of facility-format revenue in 2025, led by assets that pair gaming with hotels, retail, dining, entertainment, and major conference capacity in the casino gambling market. Cruise ships are set for a 10.76% CAGR from 2026 to 2031 as major lines reconfigure decks to deliver dedicated gaming zones with cashless payment pathways and broad content libraries. Cruise itineraries monetize captive demand and present new loyalty tie-ins that can convert land-based premium-mass players to sea-based premium cohorts. Regional casinos keep their role in drive-to markets by optimizing slots and promotions for repeat play, which complements destination resort demand cycles. This portfolio-wide diversification reinforces revenue stability and reach within the casino gambling market.
Cruise operators are adopting premium table pits, high-limit rooms, and live-dealer integrations to align with top land-based resort standards. The casino gambling market size benefits as cruise brands invest in product depth and loyalty reciprocity that translate into booking propensity and onboard spend. Land-based leaders maintain an edge in MICE-led destination travel by anchoring events, concerts, and culinary experiences that extend stays and boost per-visit spend. Regional and locals-focused properties leverage lower labor intensity and proximity to neighborhoods to sustain cash flow even in softer macro periods for long-haul travel. The combined effect is a broader network where formats bolster one another and preserve footprint relevance in the casino gambling industry.
By Ownership Structure:
Tribal Casinos Leverage Sovereignty EdgeCommercial operators held 61.74% of 2025 revenue, led by scaled portfolios with strong brands, loyalty reach, and diversified geography in the casino gambling market. Tribal and indigenous casinos in the United States are projected to grow at a 9.39% CAGR from 2026 to 2031, leveraging sovereign frameworks to accelerate innovation and manage compliance efficiently. Tribal gaming revenue reached USD 43.9 billion in FY 2024, which reflects resilience and continued reinvestment into property upgrades and new amenities. Partnerships that combine tribal governance with global operating expertise deliver world-class assets that compete effectively with commercial resorts. This balance sustains optionality for players and strengthens ecosystem depth in the casino gambling market.
Tribal properties advance cashless play, biometric authentication pilots, and integrated loyalty ties across retail and hospitality, supporting data-driven offers and engagement. Commercial portfolios continue to scale omnichannel links between on-property and digital betting to defend share, lift cross-sell, and improve yield. The casino gambling industry sees both ownership groups investing in technology, privacy, and fraud controls to protect customer trust and regulatory standing. Regional diversity mitigates volatility from tax or policy shifts by balancing exposure across multiple regimes and demand drivers. Together, this mix enhances stability and supports multi-year planning for capex and workforce development in the casino gambling market.
Geography Analysis
APAC Casino Gambling Market
Asia-Pacific accounted for 38.38% of 2025 revenue, with Macau’s 2024 gross gaming revenue at USD 28.35 billion, as the market matured toward mass and premium mass. Singapore maintained high occupancy and record property-level performance at Marina Bay Sands, supported by a three-year license extension aligned with future expansion. Japan’s Osaka IR is advancing with significant capital and visitation goals that place it among the region’s most anticipated future destination hubs in the casino gambling market. Manila’s Entertainment City continues to see strong mass-market metrics, while project schedules can shift in response to construction and financing factors. South Korea balances foreigner-only venues with a single domestic-access property that is executing approved expansions to enhance its offer.
North America and Europe Casino Gambling Market
North America blends destination and regional footprints, with Strip properties recalibrating price and value in 2025 while regional properties deliver steadier results through drive-to demand. Tribal gaming contributes a large and structurally resilient revenue base that supports modernization of payments, loyalty, and security. Europe’s regulatory environment continues to evolve, with the United Kingdom enhancing responsible-gaming controls and design rules for remote slots to reduce harm. Suppliers with strong compliance capabilities and pan-European studio infrastructure lead live-dealer distribution and platform integrations across regulated markets. These conditions foster competitive intensity and encourage omnichannel strategies that protect share in the casino gambling market.
MEA and South America Casino Gambling Market
The Middle East and Africa are an emerging growth node, led by Wynn Al Marjan Island’s 2027 opening with scaled rooms, VVIP access, and a large gaming floor anchored to a broader luxury destination vision. Ras Al Khaimah’s master developer has also signaled potential for a second integrated resort parcel to build a cluster effect over time. South Africa shows a shift in spending toward online betting, guiding incumbent operators to invest in digital capabilities and advocate for tax harmonization. South America’s path features Brazil’s 2025 regulated online framework with identity and reserve requirements that set high entry bars but open access to a large addressable market. These developments expand the long-term map for participation and add new corridors of demand to the casino gambling market.
Mordor Intelligence provides coverage of the casino gambling market across other key regional markets, including Asia, Europe, and North America, each with their regulatory frameworks and demand patterns.
Regulatory Landscape
Casino gambling remains highly jurisdiction-led, with licensing, taxation, and player-protection rules determining market access across land-based and digital channels. In the United States, the Nevada Gaming Control Board and Nevada Gaming Commission continue to set a high bar for suitability and compliance, reinforced by a USD 27 million AML enforcement action disclosed in January 2026 against Caesars Entertainment, MGM Resorts, and Resorts World Las Vegas tied to anti-money laundering control failures. In Asia-Pacific, regulators continue to steer investment toward integrated resort outcomes, including Singapore license oversight for Marina Bay Sands and Resorts World Sentosa, and Macau concession terms that require collective non-gaming investment commitments through 2033.
Cross-border compliance is tightening around AML, advertising standards, and responsible-gaming controls, which increases the cost of operating at scale while raising barriers to entry. A multi-regulator initiative announced on November 25, 2025, involving authorities in Austria, France, Germany, Great Britain, Italy, Portugal, and Spain, points to coordinated action against unlicensed online operators. Consolidation timelines also depend on layered approvals, including multi-jurisdictional gaming licensing and the U.S. Hart-Scott-Rodino notification process linked to Fertitta Entertainment’s proposed acquisition of Caesars Entertainment.
Value Chain Analysis
The casino gambling value chain begins with licensing and oversight by regulators and extends through destination development, gaming operations, and a wider supplier ecosystem. Integrated resort and casino operators, spanning commercial, tribal/indigenous, and state-run ownership models, coordinate property buildout and day-to-day operations across gaming, hotels, retail, entertainment, and MICE. They also carry primary accountability for AML, responsible-gaming, and data/privacy compliance, which has elevated compliance, risk, and payments functions into core operational capabilities.
Upstream and enabling suppliers include gaming content and equipment providers for slots and table systems, systems integrators, loyalty and CRM platforms, and cashless payments plus identity/KYC tooling that support auditable play. Independent testing and certification bodies such as Gaming Laboratories International (GLI) and eCOGRA validate game integrity and platform controls across regulated jurisdictions. Distribution and monetization increasingly rely on omnichannel stacks that connect on-property accounts, digital wallets, and loyalty programs, helping scaled operators such as MGM and Wynn unify customer journeys while standardizing reporting and controls across markets.
Competitive Landscape
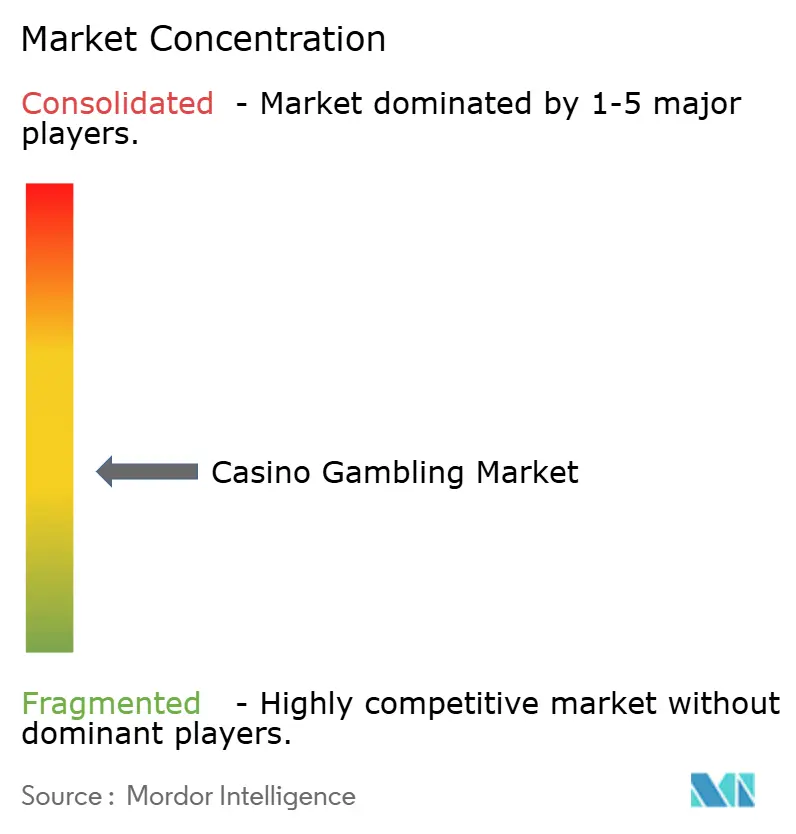
The top five land-based operators collectively hold a low-to-mid share of total revenue, while a long tail of regional commercial properties and a large tribal sector accounts for the remainder, which aligns with moderate-to-high concentration without dominance by a single player. Global leaders include Las Vegas Sands, MGM Resorts, Caesars Entertainment, Wynn Resorts, Galaxy Entertainment, Melco Resorts, Genting, SJM Holdings, Crown Resorts, and Hard Rock, with the balance held by regional commercial and tribal properties in the casino gambling market. The competitive focus spans geographic expansion, omnichannel integration, and non-gaming monetization that multiplies per-visitor spend across hotels, retail, dining, and MICE. Online platforms add pressure on brick-and-mortar visitation, which accelerates unified loyalty programs that reward cross-channel play. The casino gambling market rewards operators who build robust data systems, streamline payments, and enhance content variety at scale to raise conversion and retention. Operators with capital, brand depth, and execution discipline maintain a durable edge as policy and technology continue to evolve.
Strategic moves include Osaka IR development through a joint venture that matches local market expertise with global operating experience and capital base. In the UAE, Wynn partners with local developers to align real estate, planning, and regulatory pathways for the first Gulf integrated resort. Omnichannel growth strategies integrate mobile sportsbooks and digital casinos with on-property rewards that unify wallets, access, and status tiers. Technology differentiation includes RFID, computer vision, and dynamic marketing that refine table hold, automate AML tasks, and personalize offers in real time. These programs help reduce leakage to pure-play online platforms and maintain attachment to destination experiences in the casino gambling market.
Security, talent, and compliance are key execution arenas that influence cost, agility, and brand trust in the casino gambling market. Cyber readiness is a visible priority due to elevated risk across loyalty databases, third-party integrations, and cross-border data flows. Responsible-gaming enhancements continue across markets that link license terms to protection outcomes and transparent reporting. Workforce development includes dealer training pipelines, flexible scheduling, and retention programs to stabilize staffing in tight labor pools. Execution on these fronts underpins long-term share capture and resilience for the casino gambling market.
Casino Gambling Industry Leaders
-
Las Vegas Sands Corp.
-
MGM Resorts International
-
Caesars Entertainment Inc.
-
Galaxy Entertainment Group
-
Genting Berhad
- *Disclaimer: Major Players sorted in no particular order
Casino Gambling Market Companies Covered in this Report
- Las Vegas Sands Corp.
- MGM Resorts International
- Caesars Entertainment Inc.
- Wynn Resorts Ltd.
- Galaxy Entertainment Group
- Melco Resorts & Entertainment
- Genting Berhad
- SJM Holdings Ltd.
- Crown Resorts Ltd.
- Hard Rock International
- Penn Entertainment Inc.
- Boyd Gaming Corp.
- Sun International Ltd.
- NagaCorp Ltd.
- Bloomberry Resorts Corp.
- Rush Street Gaming
- Churchill Downs Inc.
- Red Rock Resorts
- Mohegan Gaming & Entertainment
- Full House Resorts Inc.
Market Opportunities and Future Outlook
Integrated resorts continue to open up premium-mass travel demand by expanding beyond gaming into retail, entertainment, and MICE, supporting higher frequency visitation and longer stays. Capital programs are already tied to this model, including Las Vegas Sands advancing the Marina Bay Sands IR2 expansion in Singapore (referenced as an USD 8.0 billion program in 2026 reporting), and the MGM-ORIX Osaka integrated resort moving into main construction. Operators that pair large-scale non-gaming offers with strong mass-floor productivity have more room to manage tax and compliance costs while keeping acquisition and retention tied to destination experiences.
Cashless, identity-linked play and unified loyalty ecosystems are a second opportunity area because they support AML-ready operations while reducing friction in funding and on-property spend. Fertitta Entertainment’s bid for Caesars Entertainment (announced as a USD 17.6 billion transaction) reflects the value placed on large loyalty footprints and customer databases that can be connected across casinos, hospitality, and adjacent entertainment assets. Portfolio reshaping in the Americas also creates entry points for scaled operators and consolidators, as seen in Paraguay after the 2025 removal of its gambling monopoly and Cirsa’s July 2026 majority acquisition of Slots del Sol. These liberalization moves expand the set of regulated venues and favor platform-led expansion where compliance and local licensing capability are differentiators.
Recent Industry Developments in Casino Gambling Market
- July 2026: Fertitta Entertainment executives received a unanimous suitability recommendation from the Nevada Gaming Control Board in connection with the proposed USD 17.6 billion acquisition of Caesars Entertainment. The step advances a major ownership change in a key U.S. casino market and moves the transaction further along a multi-jurisdiction licensing path.
- March 2026: Las Vegas Sands moved its Marina Bay Sands IR2 expansion forward by awarding a major construction contract to local builder Woh Hup for the Singapore project. The award supports one of the largest current integrated-resort expansion programs in Asia-Pacific and strengthens capacity for premium tourism, MICE, and on-property gaming-led spend.
- January 2026: Nevada regulators disclosed USD 27 million in AML-related fines involving Caesars Entertainment, MGM Resorts, and Resorts World Las Vegas tied to control failures connected to an illegal bookmaker case. The enforcement action reinforces the operational importance of transaction monitoring, source-of-funds checks, and auditable cashless workflows across casino floors.
Casino Gambling Market Report Scope and Research Methodology
Market Definition and Coverage
This market covers paid casino gambling activity delivered through casino venues and casino-led gaming formats, and it is sized as the value of gambling revenue generated from casino games and related play.
Scope exclusions: Lottery, social casino play without wagering, and informal or illegal gambling are excluded where they are not captured as regulated casino gambling revenue.
Segments Covered in This Report
- By Game Type
- Live Casino
- Baccarat
- Blackjack
- Poker
- Slots
- Other Casino Games
- By Facility Format
- Integrated Resort Casinos
- Standalone Land-based Casinos
- Riverboat Casinos
- Cruise Ship Casinos
- Racinos
- By Ownership Structure
- Commercial
- Tribal/Indigenous
- State-run
- By Geography
- North America
- Canada
- United States
- Mexico
- South America
- Brazil
- Peru
- Chile
- Argentina
- Rest of South America
- Europe
- United Kingdom
- Germany
- France
- Spain
- Italy
- BENELUX (Belgium, Netherlands, Luxembourg)
- NORDICS (Denmark, Finland, Iceland, Norway, Sweden)
- Rest of Europe
- Asia-Pacific
- India
- China
- Japan
- Australia
- South Korea
- South East Asia (Singapore, Malaysia, Thailand, Indonesia, Vietnam, Philippines)
- Rest of Asia-Pacific
- Middle East & Africa
- United Arab Emirates
- Saudi Arabia
- South Africa
- Nigeria
- Rest of Middle East & Africa
- North America
Data Sources, Market Sizing, and Validation
Desk Research
Desk research was used to set the market boundaries and build an initial set of assumptions that could be checked and repeated. We typically start with public data series and official publications that describe gaming revenue, visitation, and regulatory coverage, then map those signals to casino formats and major geographies.
Common inputs include statistics and releases such as national tourism and visitation tables, central bank and statistics office consumer spend series, gaming commission dashboards, and trade group reporting such as the American Gaming Association, along with academic journals that track gambling participation and harm minimization rules. We also use operator annual reports and filings, investor presentations, and reputable press coverage to confirm expansions, closures, licensing changes, and tax rule shifts. For structured cross-checks, selected paid subscriptions are used for company financials and intelligence, news and financials, patent databases, and import-export shipment level data when equipment movement is relevant. The examples above are illustrative, and other sources were also used for data collection, validation, and clarification.
Primary Interviews and Surveys
Primary work was used to pressure test the desk assumptions and fill in gaps that public sources do not answer cleanly, such as mix shifts between table games and slots, player yield changes, and the timing of capacity additions. We spoke with operators, regulators, suppliers, and other informed experts across key casino markets so that regional differences in legalization, tax rates, and tourism exposure could be reflected in the model.
Distribution of primary research fieldwork respondents
| Company type | Respondent position | Region |
|---|---|---|
| Top tier: 33% | CXOs: 12% | APAC: 40% |
| Mid tier: 51% | Functional/Unit leaders: 41% | EMEA: 33% |
| Smaller Players: 16% | Managers: 47% | Americas: 27% |
Market-Sizing & Forecasting
Sizing starts from a top-down build that reconstructs casino gambling value using regulated gaming revenue series by geography, then adjusts for known coverage gaps from licensing changes and venue format shifts. Once that structure is in place, we corroborate it with selective bottom-up approximations, such as sampling casino footprints and capacity, checking typical win per unit or win per table ranges, and validating implied revenue per visit against tourism and footfall signals.
The model is informed by a short list of repeatable variables that tend to explain casino revenue movements. These include casino visitation and tourism arrivals, the number of operating venues and major expansions, the game mix split (slots versus table games), hold and payout behavior under local rules, and macro indicators such as disposable income and foreign exchange effects in destination markets. For forecasting, scenario analysis is used so that regulation timing, tax changes, and pipeline openings can be expressed as realistic cases, and then the final path is aligned with expert views gathered in interviews. When bottom-up checks are incomplete for smaller geographies, gaps are handled through proxy ratios tied to comparable regulated markets, and the proxy is only kept if it matches multiple independent signals.
Data Validation & Update Cycle
Outputs are validated through triangulation across at least three angles, including public revenue series, implied unit economics, and primary expert feedback. If a country-level trend breaks the expected relationship with tourism, venue count, or macro conditions, the assumption set is revisited and the sources are rechecked before sign-off.
A second analyst review is done to spot variance drivers, confirm currency conversion timing, and remove double counting across formats. The report is refreshed annually, and interim updates are made when major events occur, such as legalization shifts, large resort openings, or tax rule changes. Before delivery, we run a final update pass so the client receives the most current view supported by the same repeatable steps.
Mordor Intelligence's Casino Gambling Market Size Measured Against Other Published Estimates
Published market values for casino gambling often differ because sources do not always count the same activities, and they also apply different revenue concepts and timing for currency conversion. Differences can also come from how mixed operators are treated, since some reporting blends casino play with sports betting, online gaming, or broader entertainment receipts.
Some external figures focus on a single country and report commercial gaming revenue for a calendar year, which can bundle sports betting and iGaming into one total or exclude tribal and state-run formats depending on the publication. Mordor Intelligence builds a global casino gambling value series that stays within casino-led gaming formats, and the January 2026 data refresh is used to align rule changes and venue openings into the modeled year.
Benchmark comparison
| Source | Market Size | Gaps in Research Methodology |
|---|---|---|
| Mordor Intelligence | USD 359.32 B (2026) | |
| Industry Association A | USD 72.04 B (2024) | This figure is for US commercial gaming consumer spending and is calendar-year based, and it can include sports betting and iGaming totals that are not counted as global casino-only value. |
| Trade Release B | USD 71.92 B (2024) | This number captures US commercial gaming revenue with separate verticals reported, and the headline total is not comparable to a global casino gambling series because it is jurisdiction-limited and uses domestic reporting coverage rules. |
The spread is mainly explained by geography and what is bundled into the reported total, rather than a simple math disagreement. By keeping the inputs tied to regulated casino revenue signals, venue capacity changes, and consistent currency timing, the final estimate stays traceable to clear variables that can be checked again during future updates.
Key Questions Answered in the Report
What is the global casino gambling market growth outlook through 2031?
The global casino gambling market size is USD 359.32 billion in 2026 and is projected to reach USD 624.04 billion by 2031 at an 11.67% CAGR, supported by integrated resorts and omnichannel strategies.
Which product categories are driving change in casino gambling?
Slots remain the largest revenue source, while live dealer gaming is expanding at 11.83% CAGR through 2031, lifted by dealer-led authenticity and premium streaming collaborations.
How are integrated resorts shaping competitive dynamics in casino gambling?
Integrated resorts combine gaming with hotels, retail, dining, entertainment, and MICE to raise per-visitor spend and extend average stays, which stabilizes revenue and widens addressable demand.
Which regions contribute most to global casino gambling revenue today?
Asia-Pacific leads with 38.38% share in 2025, anchored by Macau and Singapore, while the Middle East and Africa are the fastest risers into 2031 due to flagship projects in the Gulf.
What technologies are improving margins and compliance in casino gambling?
RFID, computer vision, and cashless wallets automate AML tasks, improve table hold, and unify loyalty, which raises retention and reduces friction across on-property and digital touchpoints.
How are taxes and responsible-gaming rules affecting casino operators?
Higher tax rates and tighter RG rules increase costs and shape capital decisions, which drives operators to focus on premium-mass, non-gaming diversification, and stronger compliance systems.