
North America Casino Gambling Market Size and Share
Market Overview
| Study Period | 2020 - 2031 |
|---|---|
| Forecast Data Period | 2026 - 2031 |
| Base Year Market Size (2025) | USD 96.85 Billion |
| Market Size (2026) | USD 103.23 Billion |
| Market Size (2031) | USD 142.03 Billion |
| Growth Rate (2026 - 2031) | 6.59 % |
| Market Concentration | Medium |
Major Players *Disclaimer: Major Players sorted in no particular order Image © Mordor Intelligence. Reuse requires attribution under CC BY 4.0. | |
North America Casino Gambling Market Analysis by Mordor Intelligence
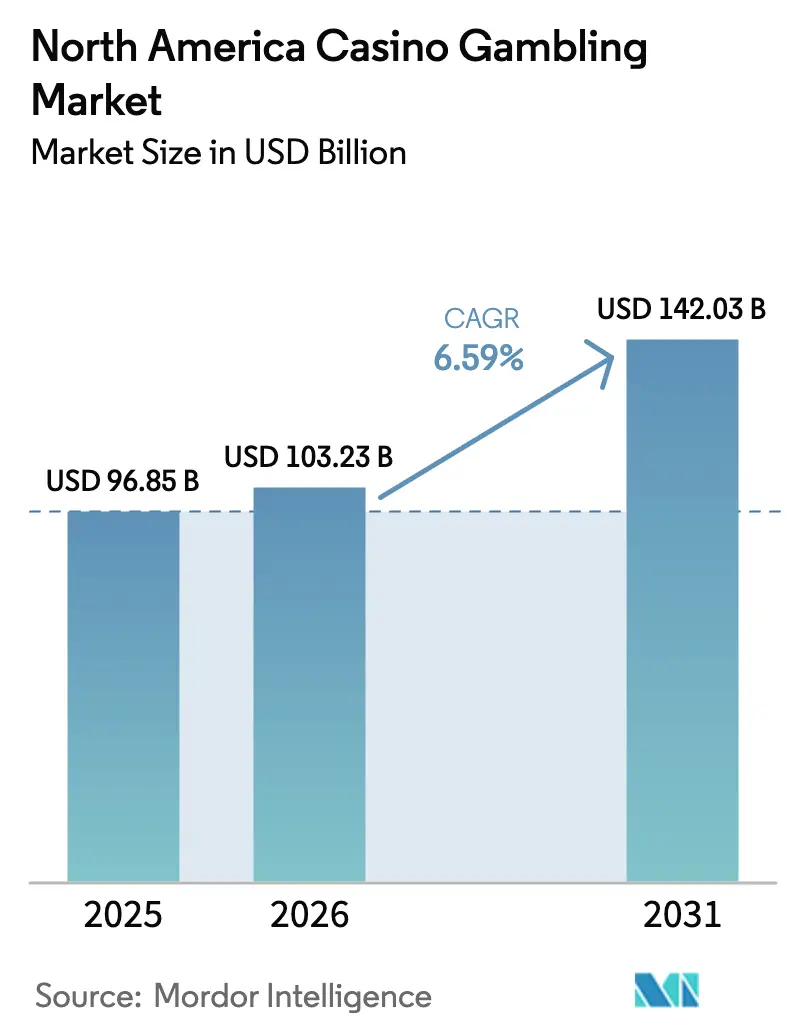
The North America casino gambling market size was valued at USD 96.85 billion in 2025 and estimated to grow from USD 103.23 billion in 2026 to reach USD 142.03 billion by 2031, at a CAGR of 6.59% during the forecast period (2026-2031). Demand is supported by the steady legalization of sports betting, rising tourism volumes, and the rapid rollout of cash-free payment ecosystems that streamline gaming-floor transactions. Record tribal-gaming revenues, coupled with multibillion-dollar resort expansions, have insulated the North America casino gambling market from near-term macro headwinds. Operators are also deploying AI-based slot-yield optimisation and omnichannel loyalty programs that raise time-on-device and cross-property visitation. Leisure-travel metrics now exceed 2019 benchmarks in Las Vegas and Atlantic City, underscoring a durable consumer appetite for integrated entertainment experiences.
Key Report Takeaways
- By game type, slot machines secured 43.68% of the North America casino gambling market share in 2025, while sports betting is forecast to post the fastest 7.26% CAGR through 2031
- By platform, land-based venues commanded 61.02% of the North America casino gambling market in 2025; online casino operations are expanding at an 8.21% CAGR to 2031.
- By geography, the United States captured 77.65% revenue share of the North America casino gambling market in 2025, whereas Canada is projected to advance at a 7.63% CAGR, the fastest national growth rate to 2031.
Note: Market size and forecast figures in this report are generated using Mordor Intelligence’s proprietary estimation framework, updated with the latest available data and insights as of 2026.
Global valuation is built by aggregating outputs from multiple regions, with North america forming one of the important contributors. Mordor Intelligence's global casino gambling market size report represents that cumulative total.
Market Trends and Insights
Drivers Impact Analysis of North America Casino Gambling Market*
| Driver | (~) % Impact on CAGR Forecast | Geographic Relevance | Impact Timeline |
|---|---|---|---|
| Continued legalization of sports betting | +1.2% | United States; spillover to Canada | Medium term (2-4 years) |
| Post-pandemic rebound in tourism & leisure spending | +0.8% | Las Vegas, Atlantic City | Short term (≤ 2 years) |
| Cashless payment & digital-wallet roll-out | +0.6% | Early-adopter U.S. states and Canadian provinces | Medium term (2-4 years) |
| Expansion of regulated online casino states | +1.1% | United States and Canada | Long term (≥ 4 years) |
| AI-driven slot-floor yield optimisation | +0.4% | Integrated resorts worldwide | Long term (≥ 4 years) |
| Tribal–commercial joint ventures in under-served regions | +0.3% | Rural U.S. markets | Medium term (2-4 years) |
| Source: Mordor Intelligence | |||
Continued Legalization of Sports Betting
Thirty-eight U.S. states plus Washington D.C. now regulate sports wagering, generating USD 10.92 billion in operator revenue during 2023 [1]. Tax rates span a wide spectrum from Nevada’s 6.75% to New York’s 51%, forcing operators to calibrate market-entry strategies against razor-thin margins in high-levy states. Mobile channels dominate penetration because app-based geolocation removes proximity barriers that once limited on-property sportsbooks. Ongoing federal proposals such as the SAFE Bet Act would impose national affordability checks, potentially harmonising consumer-protection rules across state lines. Cross-sell synergies between sportsbooks and casino floors lift customer-lifetime value, especially around major sporting events when handle spikes attract incremental visitation.
Post-Pandemic Rebound in Tourism & Leisure Spending
Las Vegas attracted 40.8 million visitors in 2023 and generated USD 51.5 billion in total out-of-wallet spend, surpassing pre-COVID highs [2]. Convention traffic represents a high-value segment, as business travelers contribute substantial per-trip spending. This segment stabilizes weekday occupancy levels, effectively complementing the demand surges observed during weekend leisure periods. International arrivals have normalised, with Canadian and Mexican tourists comprising more than half of foreign visitation, though currency movements still influence win volumes. Operators are investing in entertainment residencies and headline sporting events such as Formula 1 to diversify demand drivers beyond core gaming. While economists warn of cyclical slow-downs, well-capitalised resorts are positioned to capture share from smaller competitors during any spending pullback.
Cashless Payment & Digital-Wallet Roll-Out on Gaming Floors
Integrated mobile wallets are now live across large U.S. casino networks through partnerships such as Everi’s CashClub Wallet and Crane Payment Innovations’ BetBridge technology. Digital-first transactions shorten queue times, heighten spend visibility, and reduce cage-cash handling costs that once suppressed operating margins. Tribal operators have exploited sovereign flexibility to pilot cryptocurrency acceptance, with Choctaw Casinos enabling on-device crypto liquidity that draws tech-savvy clientele. Regulators are drafting updated standards that marry know-your-customer procedures with frictionless onboarding to mitigate anti-money-laundering risks. Early usage data shows higher average daily theoretical win per guest when wagers originate from digital wallets rather than physical bills.
Expansion of Regulated Online Casino (iGaming) States
Ontario’s competitive iGaming framework has produced more than USD 7 billion in gross receipts since its April 2022 launch and delivered USD 1.4 billion in tax revenue to the province [3]. Alberta’s iGaming Alberta Act was passed in 2025, setting the stage for second-mover market liberalisation when operations go live in 2026. Six U.S. states filed iGaming bills in January 2025, collectively covering close to 50 million residents and underscoring bipartisan appetite for digital revenue streams. Caesars Entertainment recently pooled WSOP Online liquidity across Pennsylvania, Nevada, New Jersey, and Michigan, proving that multi-state compacts can overcome early liquidity challenges. Early evidence from Ontario suggests digital casinos complement, rather than cannibalise, land-based visitation, alleviating political resistance in prospective states.
Restraints Impact Analysis of North America Casino Gambling Market*
| Restraint | (~) % Impact on CAGR Forecast | Geographic Relevance | Impact Timeline |
|---|---|---|---|
| Regulatory uncertainty & slow legislative cycles | -0.7% | Patchwork U.S. jurisdictions | Medium term (2-4 years) |
| Rising labour & energy costs at integrated resorts | -0.9% | High-wage U.S. markets | Short term (≤ 2 years) |
| Macroeconomic pressure on discretionary spending | -0.5% | Global | Short term (≤ 2 years) |
| Escalating cyber-insurance premiums | -0.3% | Large-scale operators | Medium term (2-4 years) |
| Source: Mordor Intelligence | |||
Regulatory Uncertainty & Slow Legislative Cycles
Quebec has opted to preserve Loto-Québec's monopoly, prioritizing centralized control over potential tax revenue gains that could arise from a competitive market structure. The protracted renegotiation of tribal-state compacts in certain reservations has delayed critical advancements, including slot-floor modernization and the rollout of sports betting operations. At the federal level, ongoing deliberations on the SAFE Bet Act have introduced a dual compliance framework, requiring operators to address both state-level licensing requirements and anticipated national regulations. These regulatory uncertainties have extended the time required for return on investment, thereby discouraging smaller regional companies from committing to significant capital expenditures. As a result, policy-related challenges continue to hinder growth opportunities and investment momentum within the affected markets.
Rising Labour & Energy Costs at Integrated Resorts
MGM Resorts granted a cumulative 32% wage hike to Culinary Workers Union members in 2024, pushing labour expense ratios to multi-year highs. Although revenue on the Las Vegas Strip grew by 6.8%, net income amounted to USD 820 million, reflecting margin compression driven by inflationary pressures [4]. Tight labour markets elevate overtime pay, while mandated resort-fee transparency could cap upside on average daily rates. At the same time, electricity and natural-gas charges remain volatile as mega-resorts run 24-hour HVAC, lighting, and high-density server rooms for digital-gaming infrastructure. Operators are deploying renewable-energy power-purchase agreements and automation technologies, but payback periods extend beyond common REIT lease terms, complicating financing structures.
*Our forecasts treat driver/restraint impacts as directional, not additive. The impact forecasts reflect baseline growth, mix effects, and variable interactions.
North America Casino Gambling Market Segment Analysis
By Game Type:
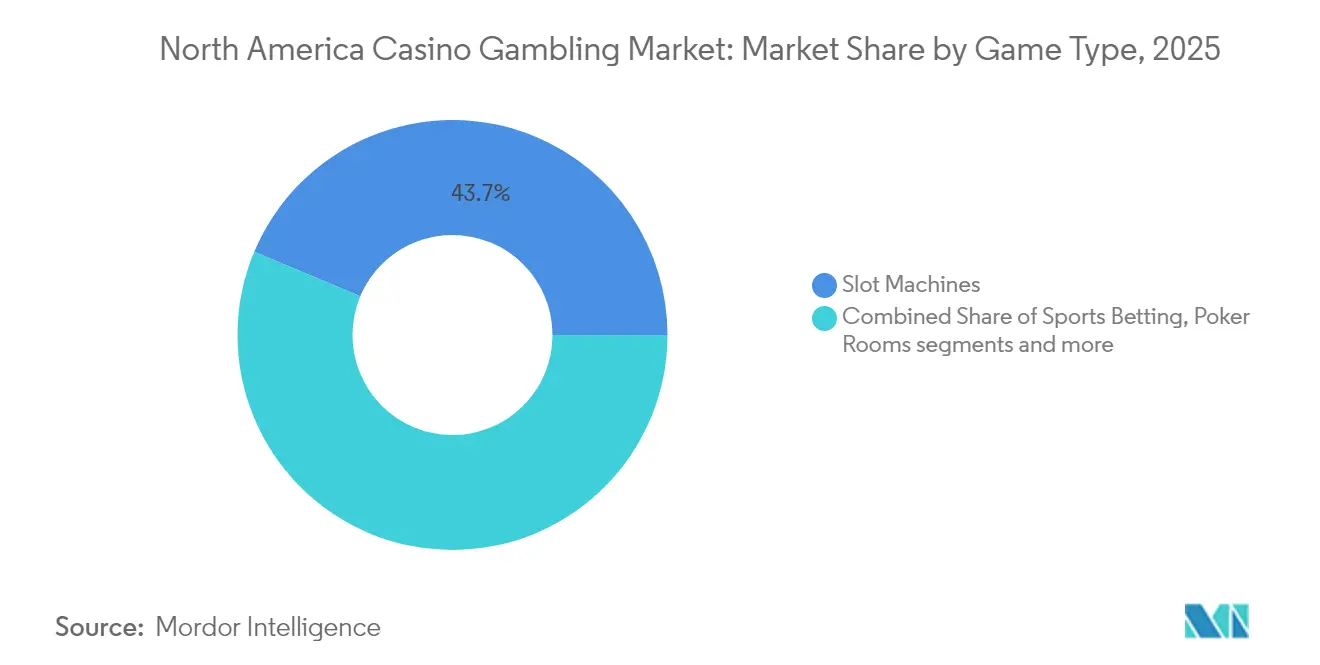
Sports Betting Drives Digital TransformationSlot machines retained 43.68% of 2025 revenue, leveraging high-frequency spin mechanics that generate stable win yields and justify premium floor allocation. Their dependable cash flows anchor the North America casino gambling market size within large destination properties, allowing management to underwrite marquee entertainment attractions that pull incremental visitation. Sports betting, however, is projected to grow at a 7.26% CAGR, turning mobile apps into year-round acquisition funnels that feed higher-margin on-premise gaming during event weekends. Table games such as blackjack and roulette continue to deliver elevated theoretical hold per seat, yet their labour requirements and staffing shortages compress floor productivity in peak periods. Electronic table variants mitigate this constraint by utilising digital dealers and touch-screen interfaces, thereby slashing operating expense per open position.Live poker, once a flagship amenity, now cedes casual traffic to online rooms but remains indispensable for televised tournaments that elevate brand stature and non-gaming spend. Specialty games like keno and bingo appeal to older demographics that value social settings, ensuring steady contribution even as properties pivot toward younger, tech-oriented audiences. AI-driven slot analytics fine-tune pay-tables and theme rotations in real time, which lifts expected-value metrics across diverse patron cohorts without breaching regulatory hold ceilings. Branded content—illustrated by Aristocrat’s Dallas Cowboys licensing deal—refreshes player engagement cycles and extends dwell times, supporting incremental coin-in targets. Sportsbook integration raises cross-product wallet share by rewarding bettors with slot credits, deepening stickiness across multiple verticals and fortifying the North America casino gambling market against single-segment volatility.

By Platform/Channel:
Online Casino Acceleration Challenges Land-Based DominanceLand-based facilities amassed 61.02% of 2025 revenue, an outcome driven by integrated-resort ecosystems that bundle gaming, lodging, conventions, and live entertainment into a single, high-spend itinerary. Their extensive footprints support luxury hotel towers, Michelin-star restaurants, and headline residencies that transform properties into all-inclusive mini-cities—attributes that digital competitors cannot replicate. Loyalty programs such as Caesars Rewards and MGM Rewards stitch multiple properties together, granting comp redemption across rooms, shows, and dining to maximise share-of-wallet per trip. Tribal casinos bring regional diversity, often operating in rural corridors where they serve as primary job creators and cultural anchors. Card-room operations concentrated in California add further granularity by focusing almost exclusively on player-banked table games, allowing lower-overhead entries into municipal markets with strict slot bans.Online casinos are forecast to grow at an 8.21% CAGR as legislative tailwinds, improved geolocation, and seamless payment solutions shrink friction points that once hindered sign-ups. Operators like Fanatics introduce exclusive in-house titles and cross-vertical loyalty coins, thus extending brand stickiness beyond sports merchandise and sportsbook ecosystems. Mobile optimisation now emphasises low-latency streaming of live-dealer tables, replicating an on-floor experience that appeals to urban professionals who lack time for multi-day resort visits. Social-casino formats serve as inexpensive acquisition channels by monetising through micro-transactions that habit-train casual gamers for eventual real-money migration, thereby feeding the wider North America casino gambling market funnel.
Geography Analysis
United States Casino Gambling Market
The United States dominated with 77.65% of 2025 revenue, reflecting a mature regulatory landscape that spans 44 casino-permissive states plus Puerto Rico. Revenue distribution is heterogeneous: the West leads tribal-gaming inflows, the Northeast concentrates high-yield commercial venues, the South represents the fastest-legalising cluster, and the Midwest maintains middle-aged properties that still post respectable occupancy metrics. Las Vegas Strip properties pulled USD 31.5 billion in aggregate revenue during 2024, yet surging wage and utility costs dragged net income down to USD 820 million, underscoring the delicate balance between headline growth and margin retention. Upcoming sportsbook rollouts in Missouri and several iGaming bills under consideration across Maryland, Virginia, and Indiana indicate fresh demand pipelines that extend beyond traditional coastal centres.
Canada and Mexico Casino Gambling Market
Canada represents the most exciting growth frontier, with a projected 7.63% CAGR through 2031 that could see its share of the North America casino gambling market size widen materially. Ontario’s open-licence iGaming ecosystem already hosts more than 70 approved operators, creating robust tax flows alongside a thriving supplier base of studios and fintech providers. Alberta is set to follow in 2026, and lobbying groups in British Columbia and Manitoba advocate for competitive models that mirror Ontario’s success. Yet policy fragmentation persists: Quebec has doubled down on a single-operator monopoly, citing problem-gaming risk in its refusal to open the market. Cross-border travel remains a key driver of on-property spend, as favourable exchange rates for Canadian visitors enhance average win per trip in U.S. destinations.Mexico adds optionality to the long-range outlook. A 2024 tribunal ruling voided a longstanding federal slot ban, opening a legal pathway for Vegas-style casino floors pending secondary regulation. Grupo Caliente extended its Playtech supply pact in anticipation of expanded game portfolios, signalling operator optimism despite continued legislative unpredictability. Industry advocates aim to harmonise state-issued permits with federal oversight to curtail grey-market proliferation that currently siphons taxable income. U.S.-based chains track these developments closely, as brand recognition among cross-border tourists could accelerate site ramp-up once clarity emerges. Therefore, Mexico’s contribution to the wider North America casino gambling market may accelerate in the latter half of the forecast window, adding another diversification vector for multinational operators.
Coverage of the casino gambling market by Mordor Intelligence spans a wide geographic footprint, with regional analysis available for Asia and Europe.
Regulatory Landscape
Casino gambling regulation in North America remains jurisdiction-led, creating a patchwork of licensing, tax, and consumer-protection rules across U.S. states, Canadian provinces, and Mexico. In the United States, tribal gaming operates under the Indian Gaming Regulatory Act (IGRA), with ongoing oversight by the National Indian Gaming Commission (NIGC) in coordination with the Department of the Interior and Department of Justice, while commercial casinos and online wagering are governed by state regulators and commissions. Policy changes in 2025 included state actions to prohibit sweepstakes gaming platforms in multiple jurisdictions and increases to tax rates on certain online sports betting or iGaming products in select states, tightening operator focus on compliance, product mix, and promotional intensity.
Canada continues to show divergent provincial approaches: Ontario runs a competitive iGaming framework, while Quebec has maintained a single-operator structure via Loto-Quebec. British Columbia implemented updated gaming control regulations via Order in Council 549/2025, effective April 13, 2026, under the Gaming Control Act (S.B.C. 2022), adding another compliance regime for suppliers and operators active in the province. In the United States, regulators are also formalizing forward compliance agendas, including the Florida Gaming Control Commission Annual Regulatory Plan for 2025-2026, with targeted rule implementations by July 1, 2026. Federal discussions such as the SAFE Bet Act keep national-level consumer protection and affordability checks in view for multi-state operators.
Value Chain Analysis
The North America casino gambling value chain begins with regulators and licensing authorities (state and provincial gaming commissions, and for tribal gaming, the NIGC under IGRA). It then extends to casino and iGaming operators that assemble content, payments, and compliance into consumer-facing offerings. Major operators such as MGM Resorts, Caesars Entertainment, and Wynn Resorts combine gaming floors, hotels, food and beverage, entertainment, and increasingly online casino and sportsbook platforms, supported by identity verification, geolocation, AML monitoring, and responsible-gaming controls. Industry associations such as the American Gaming Association (AGA), Indian Gaming Association (IGA), Canadian Gaming Association (CGA), and the Association of Gaming Equipment Manufacturers (AGEM) provide advocacy, standards dialogue, and supplier ecosystem coordination across both land-based and digital channels.
Upstream suppliers include gaming equipment OEMs and studios, platform and live-dealer technology providers, and fintech/payment enablers that support cashless and digital wallet transactions on-property and online. Midstream, operators rely on systems integrators, cybersecurity and risk providers, and data and analytics tools that optimize game performance and player marketing, with omnichannel loyalty programs linking visitation and digital engagement across properties. Downstream, distribution spans destination resorts, regional casinos, tribal venues, card rooms, and regulated online marketplaces. Responsible-gaming infrastructure is increasingly centralized in certain jurisdictions, such as iGaming Ontario's BetGuard self-exclusion tool, which influences product design and retention strategies across the market.
Competitive Landscape
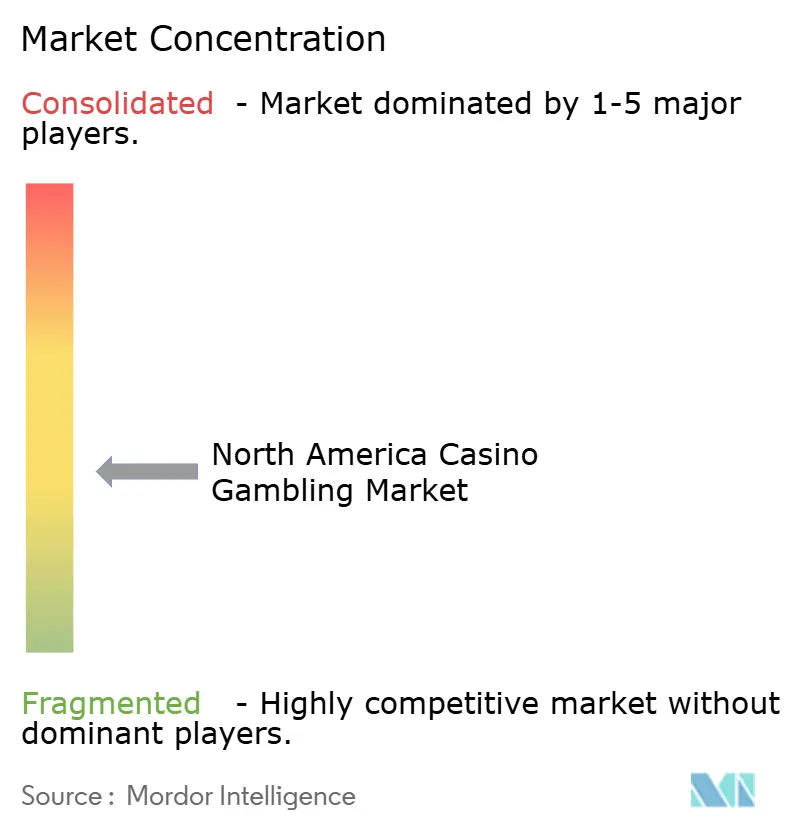
The North America casino gambling market shows moderate concentration; the five largest operators accounted for almost half of 2024 revenue, leaving significant share for regional specialists and digital-first entrants. Bally’s agreed to merge with Standard General for USD 4.6 billion, expanding its footprint to 19 facilities across 11 states and unlocking operational synergies in marketing spend and technology platforms. IGT’s USD 6.2 billion combination with Everi unites game-content portfolios with fintech payment systems, positioning the merged firm to supply turnkey omnichannel solutions. MGM Resorts and Playtech launched proprietary live-dealer studios in Las Vegas, exporting the Strip brand into regulated European markets and enhancing non-U.S. revenue streams. Caesars’ multi-state WSOP Online pool cements a first-mover advantage in regulated poker liquidity, amplifying network effects that smaller rivals struggle to replicate.
Tribal operators wield unique flexibility through sovereign status, allowing quicker adoption of crypto payments, esports wagering, and skill-based gaming prototypes. Choctaw’s crypto-liquidity pilot exemplifies how such sovereignty can leapfrog regulatory bottlenecks and attract younger, tech-native demographics. Diversification is advancing as tribes pursue federal contracting; USD 1.2 billion in subcontract awards during 2024 offset gaming-cycle volatility and funded new resort amenities that keep properties competitive. Meanwhile, sports media and e-commerce brands such as Fanatics leverage vast customer datasets to disrupt traditional player-acquisition funnels, subsidising promotions with cross-vertical profit pools.
White-space opportunities persist in rural corridors where casinos can double as regional convention centres and entertainment hubs, catalysing job creation and local tax receipts. Technology adoption has become the gating factor for sustainable share capture; AI-powered player analytics, integrated cashless wallets, and seamless omnichannel loyalty schemes are now baseline requirements rather than optional innovations. Operators that delay digital transformation risk falling below the experiential standards set by tech-forward rivals, potentially ceding slices of the North America casino gambling market to agile newcomers.
North America Casino Gambling Industry Leaders
-
MGM Resorts International
-
Caesars Entertainment Inc.
-
Las Vegas Sands Corp.
-
Wynn Resorts Ltd.
-
Penn Entertainment Inc.
- *Disclaimer: Major Players sorted in no particular order
North America Casino Gambling Market Companies Covered in this Report
- MGM Resorts International
- Caesars Entertainment Inc.
- Las Vegas Sands Corp.
- Wynn Resorts Ltd.
- Penn Entertainment Inc.
- Boyd Gaming Corp.
- Hard Rock International (Seminole Gaming)
- Mohegan Gaming & Entertainment
- Churchill Downs Inc.
- DraftKings Inc.
- Flutter Entertainment plc (FanDuel)
- Bally’s Corporation
- Rush Street Interactive Inc.
- Golden Nugget / Fertitta Entertainment
- Red Rock Resorts / Station Casinos LLC
- Great Canadian Gaming Corp.
- Gateway Casinos & Entertainment Ltd.
- Genting Group (Resorts World Las Vegas)
- Grupo Caliente
- Codere Online
Market Opportunities and Future Outlook
Regulated online casino expansion and cross-channel convergence remain the clearest whitespace across North America, with Canada serving as a reference point for competitive frameworks and scaled operator participation. Ontario has hosted more than 70 approved operators and produced more than USD 7 billion in gross receipts since April 2022, showing how a regulated marketplace can catalyze content studios, payments, and compliance services while coexisting with land-based visitation. Alberta passed the iGaming Alberta Act in 2025, creating an actionable path for new digital launches in 2026. In the U.S., market momentum continues to be shaped by the broader legalization footprint of sports wagering (38 states plus Washington, D.C.) and ongoing iGaming bill introductions in additional states.
Technology-led operating model upgrades also create an opportunity set across both land-based and online channels: cashless wallets on gaming floors, tighter integration between sportsbooks and casino loyalty programs, and AI-driven slot and customer analytics that improve yield management and marketing efficiency. Named operator initiatives point to capital and capability alignment behind these themes, including BetMGM reporting 1Q 2026 net revenue growth and outlining a profitability pathway tied to scale and operating leverage. Suppliers and associations such as AGEM continue to push platform innovation supporting omnichannel play. At the same time, shifting tax and consumer-protection policy signals, including state-level tax-rate adjustments and continued debate around federal guardrails (for example, SAFE Bet Act proposals), raise the value of compliance-ready platforms, centralized responsible-gaming tools, and adaptable product portfolios for multi-jurisdiction expansion.
Recent Industry Developments in North America Casino Gambling Market
- June 2026: MGM Resorts International received a non-binding acquisition proposal from People Incorporated to acquire all outstanding shares not already owned by the proposer for $48.30 per share. The proposal highlights consolidation interest in large-scale gaming assets and could affect how investors view valuation benchmarks in North American markets. It also indicates possible restructuring considerations for major operators and the implications for valuation benchmarks in the North America casino market.
- June 2026: Caesars Entertainment expanded its online casino partnership with Houlton Band of Maliseet Indians, Mi'kmaq Nation, and Penobscot Nation to include Maine online casino. The expansion extends Caesars' iGaming footprint within a regulated market and adds a new state to its online casino presence. It broadens access for digital players through an operator-partner model tied to tribal participation.
- May 2026: Caesars Entertainment entered into a definitive agreement to be acquired by Fertitta Entertainment in a cash transaction valued at approximately $17.6 billion. The transaction changes competitive dynamics and can shift capex allocation decisions for Caesars and its peers. It also reframes near-term strategy for market participants with overlap in gaming and digital poker liquidity.
North America Casino Gambling Market Report Scope and Research Methodology
Market Definition and Coverage
For this report, the market covers casino gambling revenue generated through regulated casino-style gaming activity across North America, measured in current USD and tied to where play happens, either on-property or online.
Scope exclusions: The model does not count informal or unregulated gambling activity that sits outside licensed casino and online casino frameworks.
Segments Covered in This Report
- By Game Type
- Slot Machines
- Table Games
- Blackjack
- Roulette
- Baccarat
- Craps
- Sports Betting
- Poker Rooms
- Electronic Gaming Tables
- Other Specialty Games (Keno, Bingo)
- By Platform / Channel
- Land-based Casino Gaming
- Commercial Casinos
- Tribal Casinos
- Card Rooms
- Online Casino (Social, Mobile etc)
- Land-based Casino Gaming
- By Geography
- United States
- Northeast
- Midwest
- South
- West
- Canada
- Ontario
- British Columbia
- Alberta
- Quebec
- Rest of Canada
- Mexico
- Baja California
- Mexico City & State of Mexico
- Nuevo León (Monterrey)
- Rest of Mexico
- United States
Data Sources, Market Sizing, and Validation
Desk Research
Desk research started with public gaming revenue trackers and regulatory releases that show how casino and related gaming receipts move by jurisdiction and by channel. For example, we referenced sources such as the American Gaming Association, state and provincial gaming commissions, and public finance releases that capture gaming taxes and reported gross gaming revenue.
To keep assumptions realistic, we also reviewed sources such as national statistics offices and central banks for inflation and currency, along with investor presentations, annual reports, and earnings call transcripts from listed operators that explain volume drivers and mix changes. Where available, we used paid subscriptions for company financials and intelligence, news and financials, and patent databases to verify corporate footprints and product shifts, then we cross-checked against broader travel and tourism indicators published by official agencies. This list is not exhaustive, and many other sources were reviewed to collect data points, validate figures, and clarify unclear items.
Primary Interviews and Surveys
Primary work was used to pressure-test the desk findings with people who see the market daily, including casino operations leaders, digital channel owners, compliance and finance teams, and service partners tied to gaming floors. Interviews and surveys were balanced across the United States, Canada, and Mexico so that tax structures, legalization pace, and demand seasonality could be translated into practical sizing inputs.
Distribution of primary research fieldwork respondents
| Company type | Respondent position |
|---|---|
| Top tier: 31% | CXOs: 18% |
| Mid tier: 51% | Functional/Unit leaders: 38% |
| Smaller Players: 18% | Managers: 44% |
Market-Sizing & Forecasting
Sizing was built using a top-down structure where jurisdiction-level regulated gaming revenues are reconstructed and then rolled up to a North America total, followed by splits into land-based casino gaming and online casino. Once that total was formed, we corroborated it with selective bottom-up checks such as sampled operator disclosures, channel mix comments, and implied revenue per property or per active market where public reporting is consistent.
A few key inputs were tracked because they repeatedly explain variance year to year, including legalization and rule changes by state or province, the count and maturity of active iGaming jurisdictions, property capacity and visitation momentum in major casino destinations, and the shift between slots and table game performance when macro conditions soften. On the online side, interview inputs were used to sanity-check the pace of online penetration, promotional intensity, and how hold and payout dynamics can move reported revenue even when demand looks steady.
For forecasting, scenario analysis was used, supported by expert views on policy timelines and expected ramp curves in newer regulated markets. Where bottom-up hints were incomplete, gaps were handled by using proxy jurisdictions with similar rules and market maturity, then adjusting with conservative penetration and growth ranges until the totals aligned with observed revenue signals.
Data Validation & Update Cycle
Model outputs were checked against independent signals such as reported commercial gaming totals, publicly disclosed operator performance, and government tax receipt patterns, which helps spot outliers early. When a variance looked abnormal, the inputs were rechecked, assumptions were reviewed in a second pass by another analyst, and respondents were re-contacted if a rule change or reporting shift was suspected.
The report is refreshed annually, and interim updates are made when material events occur, such as a new legalization, a major regulatory reset, or a clear break in revenue trend. Before delivery, a final update pass is completed so clients receive a view that reflects the latest available public data and validation notes.
Mordor Intelligence's North America Casino Gambling Market Size Compared With Other Published Estimates
Published market values for casino gambling can look far apart because different sources pick different boundaries, especially around whether sports betting and online casino are counted together, and how Mexico and Canada are treated versus the United States.
The table also reflects how year choice and reporting basis can move the number, since some publishers anchor on audited historical revenue while others project a current-year run rate. Differences also come from channel treatment, where some estimates blend commercial-only receipts with wider gambling totals, and from currency timing when local revenue is converted into USD.
Benchmark comparison
| Source | Market Size | Gaps in Research Methodology |
|---|---|---|
| Mordor Intelligence | USD 96.85 B (2025) | |
| Industry Association A | USD 72.04 B (2024) | Tracks U.S. commercial gaming receipts for a historical year, which is not a full North America roll-up and is not aligned to a 2025 current-year market view. |
| Trade Journal B | USD 110.00 B (2025) | Often reflects a broader gaming total that can blend more wagering formats and uses more aggressive run-rate extrapolation without consistently separating online casino from other digital gambling. |
The table shows a spread mainly driven by geography and scope, and in Mordor Intelligence's model the total is formed only after U.S., Canada, and Mexico regulated casino gambling is aligned to a common USD year and then split by land-based casino gaming versus online casino. Once these scope rules are kept consistent, the final market value becomes easier to trace back to clear inputs and easier to update as new jurisdictions report results.
Key Questions Answered in the Report
What is the projected growth rate for the North American casino gambling market?
The market is forecast to grow at a 6.59% CAGR, rising from USD 103.23 billion in 2026 to USD 142.03 billion by 2031.
Which segment contributes the largest share of revenue?
Slot machines contributed 43.68% of 2025 revenue, making them the largest segment in the North America casino gambling market.
How fast is sports betting expanding in North America?
Sports betting is expected to register a 7.26% CAGR to 2031, the highest among all game types.
Why is Canada considered the fastest-growing country?
Provincial iGaming liberalisation, spearheaded by Ontario and soon Alberta, positions Canada for a 7.63% CAGR through 2031.
What technologies are reshaping player experience?
Cashless digital wallets, AI-driven slot analytics, and omnichannel loyalty programs are redefining engagement and operational efficiency across both land-based and online platforms.
How concentrated is the competitive landscape?
The five largest operators hold approximately half of industry revenue, indicating a moderately concentrated market that still offers expansion potential for mid-tier players.