Market Overview
| Study Period | 2019 - 2030 |
|---|---|
| Base Year For Estimation | 2024 |
| Forecast Data Period | 2025 - 2030 |
| Market Size (2025) | USD 159.69 Billion |
| Market Size (2030) | USD 201.01 Billion |
| Growth Rate (2025 - 2030) | 4.71% CAGR |
| Market Concentration | Medium |
Major Players*Disclaimer: Major Players sorted in no particular order Image © Mordor Intelligence. Reuse requires attribution under CC BY 4.0. |
|

United States Photonics Market Analysis by Mordor Intelligence
The United States photonics market size reached USD 159.69 billion in 2025 and is projected to rise to USD 201.01 billion by 2030 at a 4.71% CAGR, underscoring the sector’s strategic role in supplying next-generation datacenters, defense systems, and medical devices. Surging artificial-intelligence workloads inside hyperscale facilities, a renewed federal push for on-shore manufacturing, and directed-energy programs together shape a demand profile that is broader than prior telecom-centric cycles. Silicon photonics platforms gain momentum because they can be produced on existing CMOS lines, while compound-semiconductor plants benefit from CHIPS Act grants that offset high capital costs. At the same time, healthcare adoption of minimally invasive imaging and photobiomodulation therapies secures a durable second growth engine. Supply security for rare-earths and III-V materials remains a swing factor as germanium and gallium export curbs inflate input costs and trigger domestic substitution efforts.
Key Report Takeaways
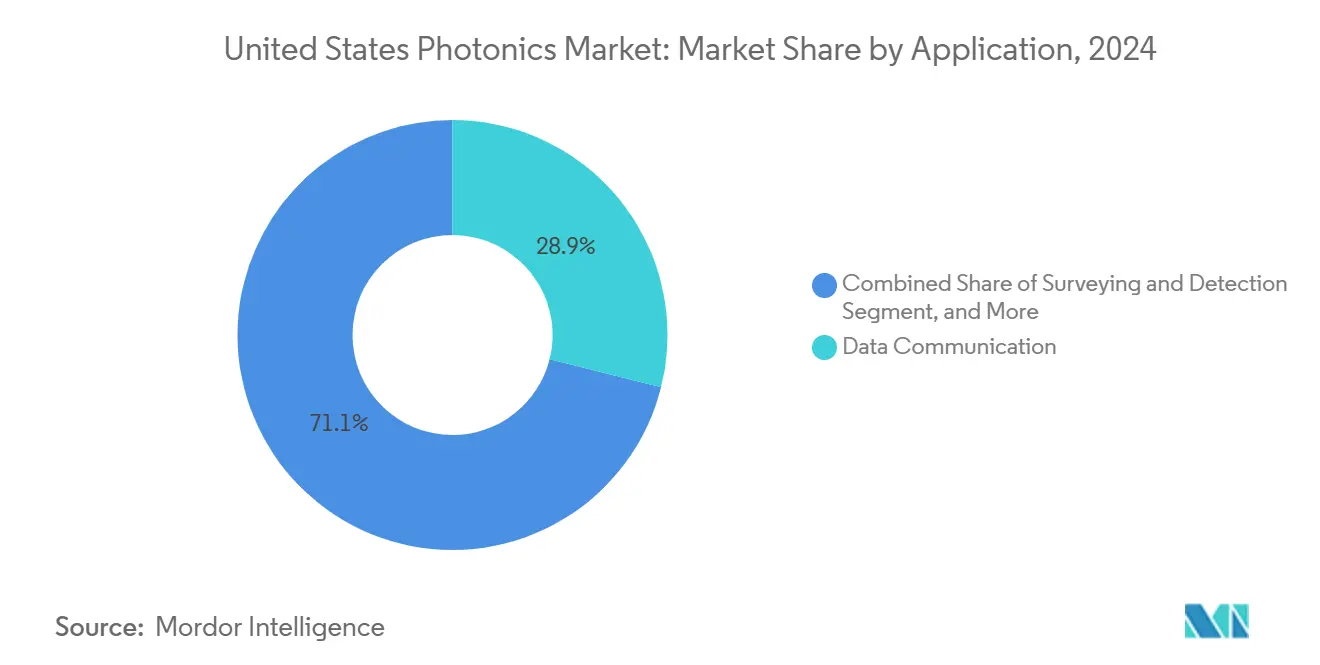
- By application, Data Communication led with 28.90% of the United States photonics market share in 2024, while Medical Technology is forecast to expand at a 5.94% CAGR to 2030.
- By component type, Lasers and Sources accounted for a 24.50% share of the United States photonics market size in 2024, whereas Integrated Photonic Circuits are advancing at a 6.14% CAGR through 2030.
- By end-user industry, Telecom and Datacenters held 31.20% of the United States photonics market share in 2024, yet Healthcare and Life Sciences record the highest projected CAGR at 7.54% through 2030.
- By technology, Optical Fiber Photonics commanded 33.70% of the United States photonics market size in 2024, while Silicon Photonics is poised for a 7.15% CAGR between 2025 and 2030.
United States Photonics Market Trends and Insights
Drivers Impact Analysis
| Driver | (~) % Impact on CAGR Forecast | Geographic Relevance | Impact Timeline |
|---|---|---|---|
| AI-driven datacenter optical-I/O boom | +1.20% | National, concentrated in Virginia, Texas, California | Short term (≤ 2 years) |
| CHIPS Act domestic manufacturing incentives | +0.80% | National, with early gains in Arizona, New York, Oregon | Medium term (2-4 years) |
| Defense laser and directed-energy funding upswing | +0.60% | National, concentrated in defense contractor regions | Medium term (2-4 years) |
| Minimally-invasive biomedical imaging adoption | +0.70% | National, with concentration in major medical centers | Long term (≥ 4 years) |
| Autonomous-vehicle LiDAR integration race | +0.50% | National, concentrated in automotive manufacturing hubs | Long term (≥ 4 years) |
| Quantum-photonics R&D investments | +0.40% | National, concentrated in research universities and tech hubs | Long term (≥ 4 years) |
| Source: Mordor Intelligence | |||
AI-driven datacenter optical-I/O boom
A record 60% jump in optical-transceiver shipments in 2024 reflected hyperscale operators’ shift from 400 G to 800 G links, and trials for 1.6 T modules are underway.[1]LightCounting, “Optical Transceiver Market Growth 2024,” lightcounting.com Silicon photonics captured 35% of those volumes because integrated electro-optical dies reduce power per bit and simplify co-packaged optics. Intel and Ayar Labs demonstrated roadmaps toward 3.2 T per package by 2026, ensuring a multi-year pull for integrated photonic circuits. Department of Energy exascale programs reinforce the trend as supercomputers pivot to optical interconnects for energy-efficient scaling.
CHIPS Act domestic manufacturing incentives
The CHIPS and Science Act reserved USD 280 million for photonics projects in 2024, with Coherent receiving USD 112 million to expand indium-phosphide and silicon-carbide capacity and GlobalFoundries gaining USD 75 million for silicon photonics. AIM Photonics’ multi-project wafer service lowers entry costs for start-ups by sharing mask sets and fab time, catalyzing a richer domestic supplier base.[2]AIM Photonics, “Multi-Project Wafer Services,” aimphotonics.com These incentives shorten lead times, support trusted-supplier mandates, and mitigate exposure to overseas supply disruptions.
Defense laser and directed-energy funding upswing
The Pentagon allotted roughly USD 1 billion for directed-energy programs in 2024, channeling USD 95 million into Army laser prototypes and accelerating shipboard systems for the Navy. nLIGHT secured a USD 171 million award for megawatt-class fiber lasers, the largest single photonics defense contract to date.[3]nLIGHT Corporation, “nLIGHT Awarded USD 171 Million Defense Contract,” nlight.net Technology validation in harsh military settings lifts reliability standards that later permeate telecom and industrial products.
Minimally invasive biomedical imaging adoption
The FDA cleared LumiThera’s Valeda system for geographic atrophy therapy in 2024, opening reimbursement pathways for photobiomodulation. Near-infrared imaging revenue is projected to reach USD 3.62 billion by 2032 on a 14.7% CAGR, spurred by surgical navigation and oncology diagnostics. Collaborative trials, such as Eoptic’s wound-assessment platform with the University of Rochester, deliver clinical evidence that sustains long-term adoption.[4]University of Rochester Medical Center, “Photonic Imaging Partnership 2024,” urmc.rochester.edu
Restraints Impact Analysis
| Restraint | (~) % Impact on CAGR Forecast | Geographic Relevance | Impact Timeline |
|---|---|---|---|
| Cap-intensive photonic-fab infrastructure | -0.90% | National, concentrated in high-tech manufacturing regions | Medium term (2-4 years) |
| Photonics-skilled talent shortage | -0.60% | National, acute in Silicon Valley, Boston, Research Triangle | Short term (≤ 2 years) |
| Rare-earth / III-V supply-chain risks | -0.80% | National, with particular impact on defense and telecom sectors | Short term (≤ 2 years) |
| Standards and ecosystem interoperability gaps | -0.40% | National, affecting system integration across industries | Long term (≥ 4 years) |
| Source: Mordor Intelligence | |||
Cap-intensive photonic-fab infrastructure
Clean-room requirements of Class 10 for passive and Class 1 for active devices elevate construction outlays well above traditional semiconductor lines.[5]IEEE Photonics Society, “Manufacturing Standards for Photonic Devices,” ieee.org AIM Photonics estimates USD 100–500 million for a full-capacity photonic fab, while metrology tools can cost 2–3× electronic counterparts. Limited domestic fab count forms a capacity bottleneck when demand surges for indium-phosphide or silicon-nitride platforms.
Rare-earth and III-V supply-chain risks
China’s 2024 export curbs lifted germanium prices by 75%, constraining fiber-optic preform and infrared-detector production. With 98% global gallium supply originating from China, telecom and defense OEMs face material cost volatility.[6]U.S. Geological Survey, “Critical Mineral List 2024,” usgs.gov Domestic processing facilities funded under the Defense Production Act will not add meaningful output until 2027, leaving a mid-term vulnerability window.
Segment Analysis
By Application: Medical Technology Drives Next-Wave Growth
Medical Technology captured a 5.94% CAGR outlook, reflecting regulatory approvals that anchor procurement budgets once clinical efficacy is proven. Data Communication still represents the largest slice at 28.90% of the United States photonics market share, propelled by hyperscale traffic migration to 800 G optics. Surveying and Detection gains incremental traction from autonomous-vehicle LiDAR and smart-infrastructure monitoring, while Production Technology leverages high-power lasers for additive manufacturing lines.
Momentum in image-guided surgery and photodynamic therapy sustains a demand profile resilient to macro-economic swings. Lighting and display sub-segments mature, yet horticultural and UV-sterilization niches provide targeted growth. Emerging areas, quantum computing, environmental sensing, and space platforms, create option value for suppliers positioned to spin off proven technologies into new verticals.
Note: Segment shares of all individual segments available upon report purchase
Get Detailed Market Forecasts at the Most Granular Levels
Download PDF
By Component Type: Integrated Circuits Lead Innovation
Integrated Photonic Circuits are slated for a 6.14% CAGR as customers gravitate toward chip-scale modules that embed sources, modulators, and detectors on a single die. Lasers and Sources hold a 24.50% share, but steady commoditization presses suppliers to bundle control electronics and software. Detectors and Sensors benefit from rising automotive ADAS and point-of-care diagnostics, underscoring sensitivity advances in avalanche photodiodes and single-photon counters.
Optical Fibers and Waveguides maintain baseline demand from rural broadband rollouts, whereas modulators experience a lift from dynamic wavelength switching in cloud backbones. Passive optics suppliers reposition toward harsh-environment spacecraft and subsea systems where pricing power is stronger. Customers increasingly favor vendors offering full subsystems over discrete parts, consolidating the vendor list.
By End-User Industry: Healthcare Outpaces Traditional Leaders
Healthcare and Life Sciences post the fastest 7.54% CAGR thanks to growing acceptance of photonic-based diagnostics, such as multispectral imaging for wound care. Telecom and Datacenters remain the volume anchor at 31.20% share of the United States photonics market size as cloud and AI clusters add capacity. Industrial Manufacturing broadens laser uptake in precision welding and quality inspection, while Defense and Aerospace hold steady with laser-weapon and free-space-optical communication projects.
Consumer Electronics growth moderates as smartphone innovation plateaus, though augmented-reality headsets and 3-D sensing provide selective upside. Energy and Environment draw on solar PV research and distributed optical monitoring for carbon-capture facilities. Cross-industry platforms, optical-AI accelerators, for instance, help suppliers amortize R&D across multiple customer sets.

Note: Segment shares of all individual segments available upon report purchase
Get Detailed Market Forecasts at the Most Granular Levels
Download PDF
By Technology: Silicon Photonics Gains Momentum
Silicon Photonics is projected to grow 7.15% CAGR through 2030, reflecting compatibility with mature CMOS fabs and CHIPS-funded expansions at GlobalFoundries and others. Optical Fiber Photonics stays dominant at one-third share but decelerates as metro and long-haul build levels off. Free-space and Diffractive Optics rise on LiDAR and holographic-display projects that require precise beam shaping.
Quantum and Non-linear Photonics receives both Department of Energy and venture infusions—PsiQuantum’s USD 750 million raise typifies private confidence in photonic qubits. Hybrid stacks uniting silicon passive layers with III-V gain media emerge to balance cost and performance.
Geography Analysis
California’s Silicon Valley and Oregon’s Silicon Forest continue as the epicenter for silicon-photonics design and consumer-electronics integration. Intel’s Santa Clara and Hillsboro campuses integrate photonic device production into existing wafer lines, lowering incremental capex and accelerating prototype cycles. The corridor from Boston to North Carolina clusters medical- and defense-photonics firms, aided by university talent pipelines and proximity to federal procurement agencies.
Arizona and Texas emerge as new manufacturing strongholds owing to CHIPS Act incentives, with Coherent and multiple quantum-chip start-ups announcing fabs that expand regional employment. Quantum-focused foundries in Phoenix complement aerospace optics houses in Tucson, forming a desert-southwest technology strip. The Midwest leverages automotive supply chains as carmakers pilot solid-state LiDAR and cabin-monitoring sensors, positioning regional suppliers for volume ramps later in the decade.
Federal policy intentionally distributes funding to mitigate single-point failures; as a result, states such as New York and Ohio now host greenfield lines for silicon nitride and indium phosphide. Local tax breaks and workforce grants further entice tier-two suppliers to co-locate, creating vertically integrated clusters. Geographic diversification also enhances resilience against natural disasters and geopolitical shocks, an advantage highlighted by recent pandemic-era disruptions.
Competitive Landscape
Fragmentation characterizes many sub-segments, yet consolidation is underway as incumbents target vertical integration. Intel and GlobalFoundries dominate silicon photonics wafers, while Corning, Lumentum, and Infinera share fiber-optic leadership. Acquisitions such as Luna Innovations’ USD 20 million purchase of General Photonics fold sensing know-how into broader test portfolios. Firms with regulatory expertise and quality systems meet ITAR and FDA hurdles faster, cultivating defensible moats.
Start-ups Ayar Labs and Lightmatter chase chip-to-chip optical I/O niches, promising lower latency and power for AI clusters. Patent activity jumped 23% in 2024, concentrating on co-packaged optics geometries and advanced wavelength division multiplexing. The race now emphasizes system-level architectures, packaging, firmware, and diagnostics over individual component specs.
Material security is a strategic differentiator; companies that secure domestic germanium refining or recycle gallium gain cost advantages amid price spikes. In parallel, test-equipment giants like Teradyne acquire photonics-specific platforms to cover automated-test gaps, positioning themselves as one-stop partners for high-volume silicon photonics lines.
United States Photonics Industry Leaders
-
Intel Corporation
-
Lumentum Holdings Inc.
-
Infinera Corporation
-
Molex LLC (Koch Industries)
-
Hamamatsu Photonics K.K.
- *Disclaimer: Major Players sorted in no particular order
Need More Details on Market Players and Competitors?
Download PDF
Recent Industry Developments
- September 2025: Teradyne agreed to acquire Quantifi Photonics to integrate automated test solutions for photonic integrated circuits. The move aligns Teradyne’s strategy of expanding beyond electronic IC handlers toward optical-test leadership as silicon photonics volumes climb.
- August 2025: nLIGHT landed a USD 171 million DoD order for megawatt-class fiber lasers, reinforcing its role as a prime defense laser supplier and providing scale needed to cut per-watt costs in industrial spin-offs.
- July 2025: Luna Innovations finalized the USD 20 million General Photonics buy, adding polarization-control and sensing IP that widens its aerospace and telecom service portfolio.
- June 2025: Coherent secured preliminary USD 112 million CHIPS funding to grow compound-semiconductor fabs in Arizona and Pennsylvania, an expansion that underpins domestic diode-laser and SiC component supply.
United States Photonics Market Report Scope
Photonics is an area of study that involves the use of radiant energy (such as light), whose fundamental elements are photons and waves that may be used to cure diseases, explore the universe, and even solve crimes.
The United States photonics market is segmented by application (surveying and detection, production technology, data communication, image capture and display, medical technology, lighting, and other applications).
The market sizes and forecasts are provided in terms of value in USD for all the above segments.
By Application
| Surveying and Detection |
| Production Technology |
| Data Communication |
| Image Capture and Display |
| Medical Technology |
| Lighting |
| Other Applications |
By Component Type
| Lasers and Sources |
| Detectors and Sensors |
| Optical Fibers and Waveguides |
| Modulators and Switched Devices |
| Integrated Photonic Circuits |
| Passive Optics (Lenses, Filters, etc.) |
By End-User Industry
| Telecom and Datacenters |
| Industrial Manufacturing |
| Healthcare and Life Sciences |
| Defense and Aerospace |
| Consumer Electronics |
| Energy and Environment |
By Technology
| Silicon Photonics |
| Optical Fiber Photonics |
| Free-space and Diffractive Optics |
| Quantum and Non-linear Photonics |
| By Application | Surveying and Detection |
| Production Technology | |
| Data Communication | |
| Image Capture and Display | |
| Medical Technology | |
| Lighting | |
| Other Applications | |
| By Component Type | Lasers and Sources |
| Detectors and Sensors | |
| Optical Fibers and Waveguides | |
| Modulators and Switched Devices | |
| Integrated Photonic Circuits | |
| Passive Optics (Lenses, Filters, etc.) | |
| By End-User Industry | Telecom and Datacenters |
| Industrial Manufacturing | |
| Healthcare and Life Sciences | |
| Defense and Aerospace | |
| Consumer Electronics | |
| Energy and Environment | |
| By Technology | Silicon Photonics |
| Optical Fiber Photonics | |
| Free-space and Diffractive Optics | |
| Quantum and Non-linear Photonics |
Need A Different Region or Segment?
Customize Now
Key Questions Answered in the Report
What is the projected value of the United States photonics market by 2030?
The United States photonics market is expected to reach USD 201.01 billion by 2030.
Which application segment will grow the fastest through 2030?
Medical Technology is forecast to post the highest 5.94% CAGR due to growing adoption of photonic diagnostics and therapies.
How will CHIPS Act funding affect domestic photonics capacity?
Grants already awarded to Coherent and GlobalFoundries are expanding indium-phosphide and silicon-photonics fabs, shortening supply chains and boosting trusted-supplier availability.
Why are silicon-photonics platforms gaining momentum?
They leverage existing CMOS fabs, lower cost per channel, and meet hyperscale datacenter bandwidth demands, driving a projected 7.15% CAGR.
What supply-chain risks threaten photonics manufacturers?
Dependence on Chinese exports for germanium and gallium exposes producers to price volatility and shortages, prompting investment in domestic refining and alternative materials.
Page last updated on:


