Market Overview
| Study Period | 2019 - 2030 |
|---|---|
| Base Year For Estimation | 2024 |
| Forecast Data Period | 2025 - 2030 |
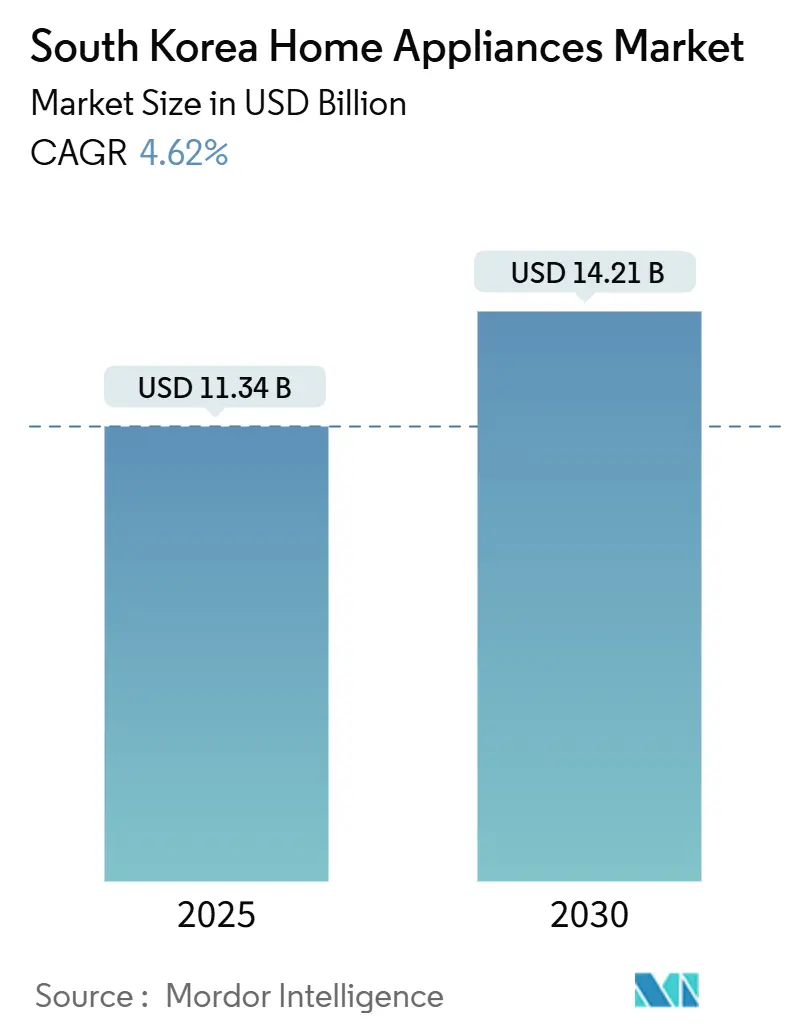
| Market Size (2025) | USD 11.34 Billion |
| Market Size (2030) | USD 14.21 Billion |
| Growth Rate (2025 - 2030) | 4.62% CAGR |
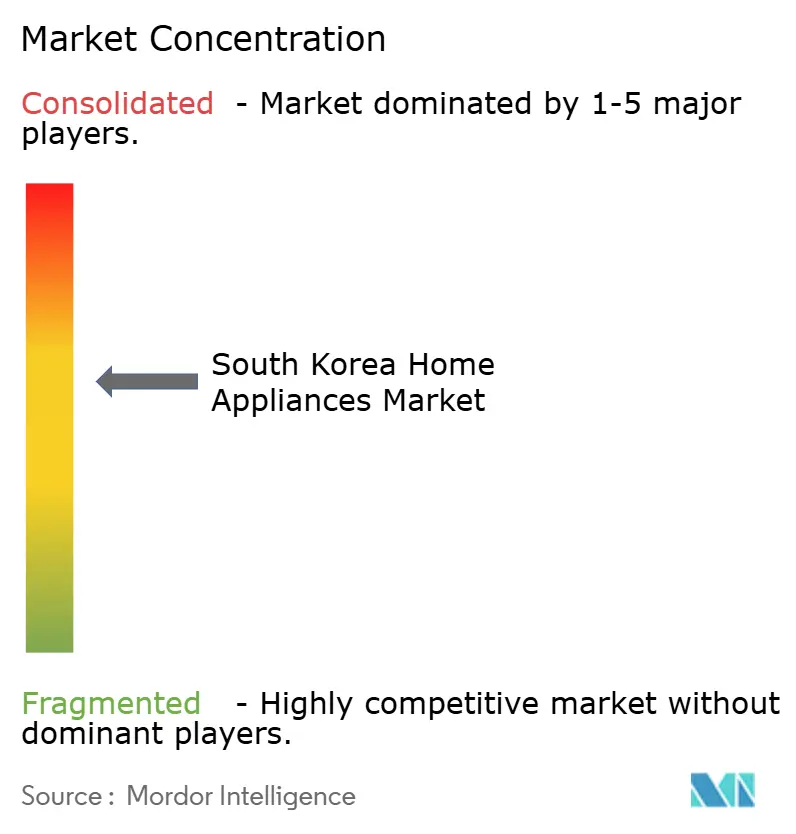
| Market Concentration | Medium |
Major Players
*Disclaimer: Major Players sorted in no particular order Image © Mordor Intelligence. Reuse requires attribution under CC BY 4.0. |
|
South Korea Home Appliances Market Analysis by Mordor Intelligence
The South Korea home appliances market stands at USD 11.34 billion in 2025 and is forecast to reach USD 14.21 billion by 2030, advancing at a 4.62% CAGR. The expansion reflects a stable macroeconomic outlook, the rapid rise of one-person households, and aggressive public incentives for Grade-1 energy-efficient products. Urban consumers increasingly link appliance choice to lifestyle convenience, while rural buyers focus on durable, power-saving models that lower utility bills. AI integration into refrigerators, washers, and air treatment devices anchors premium pricing, whereas subscription plans and trade-in schemes shorten replacement cycles. Competitive pressure remains intense as Samsung and LG defend ecosystem leadership against low-cost challengers, especially Roborock in robot vacuums and Haier in washing machines. Online retail, bolstered by mobile payments and same-day logistics, is reshaping the entire South Korean home appliances market through price transparency, wide SKU availability, and customer reviews.
Key Report Takeaways
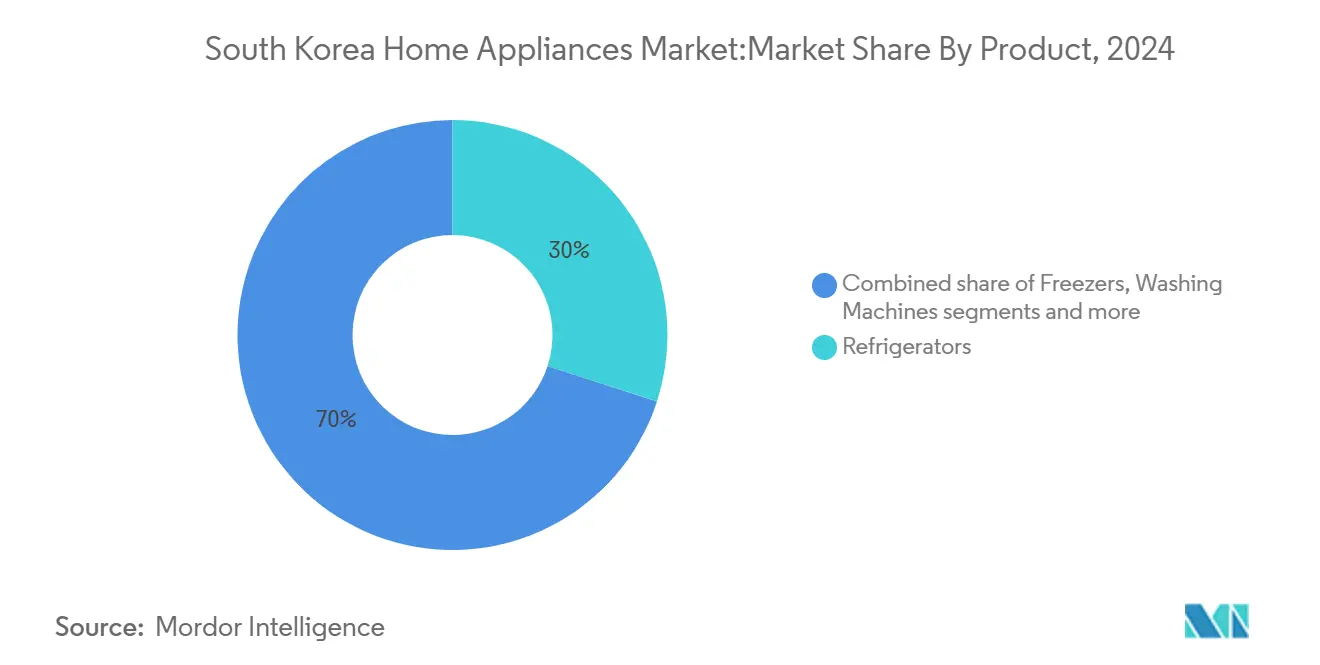
- By product category, refrigerators led with 30% revenue share of the South Korean home appliances market in 2024; electric rice cookers are projected to expand at a 5.5% CAGR to 2030.
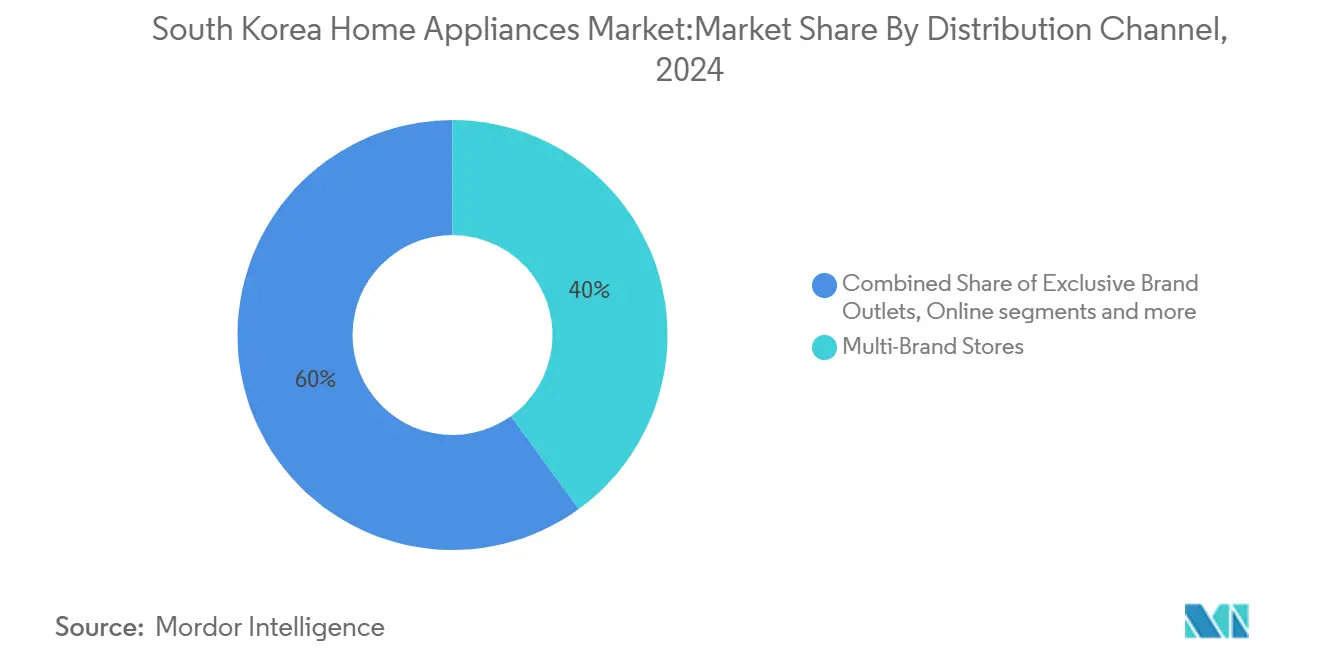
- By distribution channel, multi-brand stores held 40% of the South Korean home appliances market share in 2024, while online platforms recorded the highest projected CAGR at 6.1% through 2030.
- By geography, Gyeonggi province commanded a 35% share of the South Korean home appliances market size in 2024, and Gyeongsang province is advancing at a 5.8% CAGR through 2030.
South Korea Home Appliances Market Trends and Insights
Drivers Impact Analysis
| Driver | (~) % Impact on CAGR Forecast | Geographic Relevance | Impact Timeline |
|---|---|---|---|
| Rising Disposable Income and Urban Lifestyle Shifts | +1.2% | National, concentrated in Seoul–Gyeonggi corridor | Medium term (2–4 years) |
| Expansion Of E-Commerce & Quick-Commerce Logistics | +0.8% | National, with early gains in metropolitan areas | Short term (≤ 2 years) |
| Mandatory Grade-1 Energy-Efficiency Incentives | +0.6% | National, higher uptake in urban centers | Medium term (2–4 years) |
| Growth Of Single-Person Households Demanding Compact Appliances | +0.9% | National, strongest in Seoul, Busan, Daegu | Long term (≥ 4 years) |
| Blockchain E-Receipt Scheme Accelerating Replacement & Trade-In Cycles | +0.4% | National, pilot programs in major cities | Long term (≥ 4 years) |
| Smart-City Pilots Mandating IoT-Ready Appliances | +0.3% | Regional, focused on designated smart cities | Long term (≥ 4 years) |
| Source: Mordor Intelligence | |||
Rising Disposable Income and Urban Lifestyle Shifts
Stable wage growth and low unemployment keep discretionary spending resilient, allowing many families to upgrade to premium refrigerators, washers, and air conditioners. The Bank of Korea links 88% of monthly consumption changes to sentiment, signalling that appliance purchases hold steady even when GDP slows [1]Bank of Korea, “Consumer Sentiment Index 2025,” Bank of Korea, bok.or.kr. Compact apartments dominate new housing, and 53.1% of households now live in apartments, encouraging demand for built-in, space-saving appliances. Samsung’s Bespoke AI Combo washer-dryer sold 3,000 units in 12 days, underlining the appetite for multi-function units that reduce footprint. Higher electricity tariffs also make energy ratings a central buying criterion, supporting the South Korean home appliances market’s migration toward Grade-1 models.
Expansion of E-Commerce & Quick-Commerce Logistics
Mobile transactions accounted for 71.2% of all online purchases in 2021, and home appliances represented 12.4% of those orders. Same-day delivery options now cover bulky goods thanks to upgraded fulfilment centres in the Seoul–Incheon logistics belt. Government support under the National Logistics Basic Plan (2021–2030) subsidises warehouse automation, letting retailers promise timed installations even for premium devices [2]Invest Korea, “National Logistics Basic Plan 2021–2030,” Invest Korea, investkorea.org. The convenience of doorstep returns and digital financing accelerates repeat purchases and widens the South Korean home appliances market to rural districts that lack big-box outlets.
Mandatory Grade-1 Energy-Efficiency Incentives
Consumers receive 10% refunds, capped at KRW 200,000, when purchasing Grade-1 certified products across seven categories, and over 3.2 million units qualified in 2024 [3]International Energy Agency, “Korea 2024 Energy Policy Review,” IEA, iea.org. Samsung lifted its air-conditioner share on the back of its WindFree R32 models that satisfy tier-1 and tier-2 standards. Manufacturers retool production lines to preserve margins while meeting stricter targets, a dynamic that expands the addressable South Korea home appliances market for inverter compressors, eco-friendly refrigerants, and power-saving microcontrollers.
Growth of Single-Person Households Demands Compact Appliances
Single-person households reached over 8 million in 2024, equal to 42% of all households. This cohort favours slim refrigerators, 2-kg washers, and countertop dishwashers that free up floor area yet match the performance of full-size units. SmartThings usage statistics show 34% penetration among singles, confirming high interest in remote monitoring features that notify owners of cycle completion or energy spikes. Manufacturers design stackable units and modular panels to fit micro-studios without sacrificing aesthetics, pushing average selling prices upward. Subscription rental packages, which bundle maintenance and automatic upgrades, resonate strongly with this demographic, further energising the South Korea home appliances market.
Restraints Impact Analysis
| Restraint | (~) % Impact on CAGR Forecast | Geographic Relevance | Impact Timeline |
|---|---|---|---|
| Category Saturation In Refrigerators & Washers | -0.7% | National, most pronounced in mature urban markets | Medium term (2–4 years) |
| Slowing New-Build Housing Completions | -0.5% | National, concentrated in metropolitan areas | Short term (≤ 2 years) |
| Rising Raw Material and Production Costs | -0.8% | National, affecting all manufacturers | Short term (≤ 2 years) |
| Low Price Competition | -0.6% | National, intensifying in mid-tier segments | Medium term (2–4 years) |
| Source: Mordor Intelligence | |||
Category Saturation in Refrigerators & Washers
Penetration rates exceed 95% for both refrigerators and washing machines, leaving growth reliant on replacement demand. Longer product durability has extended turnover cycles to 12–15 years, depressing annual unit demand. Chinese brands such as Haier win a significant share of washing machine sales by offering competitive prices and solid reliability. Domestic players respond with AI-driven premium tiers, but these attract existing owners rather than first-time buyers, limiting overall volume expansion in the South Korea home appliances market.
Rising Raw Material and Production Costs
Fifty percent U.S. steel tariffs imposed in June 2025 lifted input costs for refrigerators and washers built in Mexican plants, prompting Samsung and LG to consider reshoring elements of their supply chain. LG’s Core Parts Breakthrough Project now sources components locally in China to curb exposure to foreign currency swings[4]MK, “LG Drives Local Sourcing to Cut Component Costs,” Maeil Business Newspaper, mk.co.kr. Meanwhile, energy price volatility raises factory overheads at a time when promotional discounts are widening. These pressures compress margins, encourage automation, and can slow innovation budgets, potentially tempering future growth of the South Korean home appliances market.
Segment Analysis
By Product: Refrigerators Lead While Rice Cookers Accelerate
Refrigerators held 30% of 2024 revenue, confirming their role as the anchor product in the South Korean home appliances market. Samsung and LG have turned to dual-module cooling systems, custom door panels, and AI-powered freshness alerts to lift average selling prices and defend share. Electric rice cookers, rooted in dietary culture, post the fastest 5.5% CAGR through 2030 as makers introduce induction heating, grain-type recognition, and voice-assistant control. The premium sub-segment of cookers now accounts for a significant share of category sales, illustrating robust willingness to pay for advanced features. Mid-size appliances such as dishwashers and microwave-oven hybrids ride on compact kitchen layouts, while robot vacuums enjoy crossover growth through bundling with air-purification docks.
Continued innovation sustains category momentum. Refrigerators equipped with internal cameras send expiration alerts, and convertible compartments shift between freezer and fridge modes based on season. Rice cookers integrate NFC tags for recipe loading, appealing to younger users who value convenience. Health-centric buyers steer demand toward dehydrators, slow juicers, and air fryers, each benefiting from social media-driven cooking trends. As a result, the South Korean home appliances market size for small smart appliances is projected to climb steadily alongside major-appliance replacements.
Note: Segment shares of all individual segments available upon report purchase
Get Detailed Market Forecasts at the Most Granular Levels
Download PDF
By Distribution Channel: Online Growth Challenges Traditional Retail
Multi-brand stores captured a 40% share in 2024, leveraging demonstration zones, financing desks, and same-day installation services. Yet online marketplaces grow at a 6.1% CAGR through 2030, propelled by live-commerce streams that showcase product performance in real time. Leading e-tailers subsidise extended warranties to neutralise service concerns and offer instant price-matching guarantees. Mobile-first consumers compare energy ratings, read peer reviews, and finalise payments within minutes, behaviours that inject transparency into the South Korean home appliances market.
Exclusive brand outlets pivot toward experiential showrooms where visitors test voice control, smart-home dashboards, and colour-customisation stations. Subscription rental models, pioneered by LG and soon replicated by Samsung, convert one-time buyers into recurring revenue streams that cover filters, software updates, and optional insurance. Rental households renew contracts every three to five years, effectively shortening the replacement interval and enlarging lifetime customer value.
Note: Segment shares of all individual segments available upon report purchase
Get Detailed Market Forecasts at the Most Granular Levels
Download PDF
Geography Analysis
Gyeonggi province commanded a 35% share of the South Korean home appliances market size in 2024, and Gyeongsang province is advancing at a 5.8% CAGR through 2030. Gyeonggi remains the nation’s economic heart, and its affluent households readily adopt high-capacity washer-dryers, AI refrigerators, and whole-home air-purification systems. Retail chains use the province as a testbed for new subscription bundles, deepening customer relationships, and collecting performance data for future upgrades. Public transport connectivity means technicians reach any address within two hours, raising after-sales satisfaction and reinforcing brand loyalty.
Gyeongsang’s growth stems from a balanced mix of export-oriented factories and a rising white-collar workforce. Municipal programs that retrofit apartments with smart-energy meters encourage residents to swap older appliances for Grade-1 alternatives, feeding local demand. Collaborative campaigns between city halls and manufacturers provide rebate vouchers during peak summer air-conditioner season, smoothing revenue spikes across the year.
Secondary regions show divergent rhythms. Gangwon leverages renewable-energy tourism to market eco-friendly appliances in ski resorts, while Chungcheong hosts Korea’s primary inland logistics hub, slashing delivery times for big-ticket items. Jeolla’s appliance demand is tied to agritech adoption, with dehumidifiers and specialized freezers for produce storage selling well. Jeju offers premium opportunities; its luxury villas are specifically built with built-in AI ovens and low-noise dishwashers, underscoring the South Korean home appliances market’s capacity to tap lifestyle niches even in smaller territories.
Competitive Landscape
Competition is moderate in concentration but fierce in feature innovation. Samsung and LG together hold roughly half of all category revenue and promote walled-garden ecosystems anchored by SmartThings and ThinQ platforms. Roborock, Haier, and Coway form a formidable second tier, collectively driving price tension and segment diversification. Coway capitalises on the rental-plus-service model, surpassing 10 million subscribers worldwide and expanding swiftly in air-water care.
Strategic responses hinge on ecosystem stickiness. Samsung embeds post-quantum cryptography in Wi-Fi modules to reassure security-conscious buyers, while LG integrates Microsoft AI agents to voice-enable every major appliance line. Domestic firms also court developers through open APIs, enabling third-party apps that schedule cycles around dynamic electricity tariffs. Chinese challengers push OTA firmware updates that narrow usability gaps, forcing Korean companies to maintain a brisk upgrade cadence.
The cost backdrop is volatile. Tariffs compel sourcing pivots, and BSH’s global experience shows that even multinationals struggle with freight and component bottlenecks, yet still allocate EUR 840 million to R&D. Korean brands pursue automation—Samsung’s new Gumi line uses AI cameras for defect detection while cutting labour by 30%. These investments raise barriers to entry, yet low-price disruptors persist in mid-tier segments, ensuring the South Korea home appliances market stays highly contested.
South Korea Home Appliances Industry Leaders
-
LG Electronics
-
Samsung Electronics
-
Winia Electronics (Daewoo)
-
Coway Co., Ltd.
-
SK Magic
- *Disclaimer: Major Players sorted in no particular order
Need More Details on Market Players and Competitors?
Download PDF
Recent Industry Developments
- June 2025: The U.S. government imposed 50% steel tariffs on refrigerators and washing machines, compelling Samsung and LG to review Mexico-based output strategies.
- April 2025: LG Electronics confirmed Phase II of its Tennessee facility, adding 55,600 m² for refrigerators and bringing four-year U.S. investment above USD 20 billion.
- April 2025: Samsung introduced its 2025 Bespoke AI portfolio with larger screens and Knox Matrix security across all Wi-Fi-enabled models.
- July 2024: LG signed a strategic deal with Microsoft and acquired Athom B.V. to embed AI agents into smart TVs and HVAC systems.
Research Methodology Framework and Report Scope
Market Definitions and Key Coverage
Our study defines the South Korean home appliances market as all newly manufactured major appliances (refrigerators, freezers, washing machines, dishwashers, ovens, air conditioners) and small appliances (coffee makers, vacuum cleaners, air fryers, electric rice cookers, and similar countertop devices) sold for household use, valued at transactional prices inside the country. The definition follows the scope laid out in the Mordor Intelligence report for 2019-2030.
Scope exclusion: Refurbished or second-hand units and purely consumer-electronics items such as televisions are not counted.
Segmentation Overview
- By Product
- Major Home Appliances
- Refrigerators
- Freezers
- Washing Machines
- Dishwashers
- Ovens (Incl. Combi & Microwave)
- Air Conditioners
- Other Major Home Appliances
- Small Home Appliances
- Coffee Makers
- Food Processors
- Grills & Roasters
- Electric Kettles
- Juicers & Blenders
- Air Fryers
- Vacuum Cleaners
- Electric Rice Cookers
- Other Small Home Appliances
- Major Home Appliances
- By Distribution Channel
- Multi-Brand Stores
- Exclusive Brand Outlets
- Online
- Other Distribution Channels
- By Geography
- Chungcheong
- Gangwon
- Gyeonggi
- Gyeongsang
- Jeolla
- Jeju
Detailed Research Methodology and Data Validation
Desk Research
We began with publicly available macro and industry datasets from Statistics Korea, Korea Customs Service, the Ministry of Trade, Industry and Energy, and the Korea Electrical Manufacturers Association, which reveal production, import-export flows, and grade-1 energy-efficiency uptake. Company filings, investor decks, and provincial energy-rebate bulletins added insights on average selling prices and channel mix. To verify company-level revenues, Mordor analysts accessed D&B Hoovers and Dow Jones Factiva. Academic journals in Energy Policy and trade press releases filled technology and regulatory gaps. The sources named are illustrative; a broader set was consulted to cross-check every data point collected.
Primary Research
Telephone interviews and short surveys with appliance retailers, e-commerce platforms, provincial distributors, and former product managers from leading brands supplied live insights on replacement cycles, online discounting, and consumer shift toward smart appliances across Seoul, Gyeonggi, Busan, and Jeolla. These conversations helped us validate secondary patterns, stress-test price assumptions, and fine-tune the forecast base year.
Market-Sizing & Forecasting
A top-down model reconstructs domestic demand by combining factory output, verified import volumes, and export deductions, followed by an adjustment for warranty returns. Selective bottom-up checks, retailer sell-out data snapshots, and sampled ASP × volume keep the totals grounded. Core variables include household formation rate, disposable income per capita, energy-efficiency rebate penetration, average appliance life span, e-commerce share of durable goods, and seasonally adjusted consumer-confidence indices. Multivariate regression on these drivers, supported by expert consensus, projects values to 2030, while gap areas in bottom-up samples are interpolated using matched-pair channel proxies.
Data Validation & Update Cycle
Outputs pass three-layer checks: automatic variance flags, senior analyst peer review, and a reconciliation of model totals with independent shipment or customs markers. Reports refresh yearly and are mid-cycle updated if policy changes, major product recalls, or sharp currency swings move the market baseline. An analyst re-audits all figures before client delivery.
Why Mordor's South Korea Home Appliances Baseline Commands Reliability
Published estimates often vary because firms choose unlike product baskets, apply differing import adjustments, or refresh data on separate cadences.
Key gap drivers emerge when some studies track only factory gate sales, others layer in retailer margins, while still others overlook cross-border e-commerce flows or apply a uniform inflation uplift without currency normalization. By aligning scope with on-the-ground channel checks and by updating every twelve months, Mordor minimizes these skews.
Benchmark comparison
| Market Size | Anonymized source | Primary gap driver |
|---|---|---|
| USD 11.34 B (2025) | Mordor Intelligence | - |
| USD 8.93 B (2024) | Regional Consultancy A | Factory gate view only; online imports and small-appliance tail excluded |
| USD 12.20 B (2024) | Trade Journal B | Combines retailer margin and goods value, double-counting mark-ups; no won-to-USD averaging window |
Gap notes compare each source with Mordor's documented approach.
In sum, the disciplined variable selection, transparent scope, and annual refresh mean Mordor delivers a balanced, decision-ready baseline that executives can trace back to clear drivers and repeatable steps.
Need A Different Region or Segment?
Customize Now
Key Questions Answered in the Report
What is the current value of the South Korea home appliances market?
The market is valued at USD 11.34 billion in 2025 and is projected to reach USD 14.21 billion by 2030.
Which product category leads sales?
Refrigerators hold the largest share at 30% of 2024 revenue, supported by premium AI-enabled models.
How fast are online channels growing?
Online sales are expanding at a 6.1% CAGR through 2030, outpacing physical stores as mobile shopping dominates.
Why are energy-efficient appliances gaining traction?
Grade-1 products qualify for a 10% government rebate capped at KRW 200,000, making efficient models financially attractive.
Which province shows the fastest growth?
Gyeongsang province is forecast to grow at a 5.8% CAGR to 2030, driven by urbanization and new housing projects.
Page last updated on:


