
Zygomatic And Pterygoid Implants Market Size and Share
Market Overview
| Study Period | 2020 - 2031 |
|---|---|
| Market Size (2026) | USD 280.34 Million |
| Market Size (2031) | USD 381.59 Million |
| Growth Rate (2026 - 2031) | 6.36 % |
| Fastest Growing Market | Asia Pacific |
| Largest Market | North America |
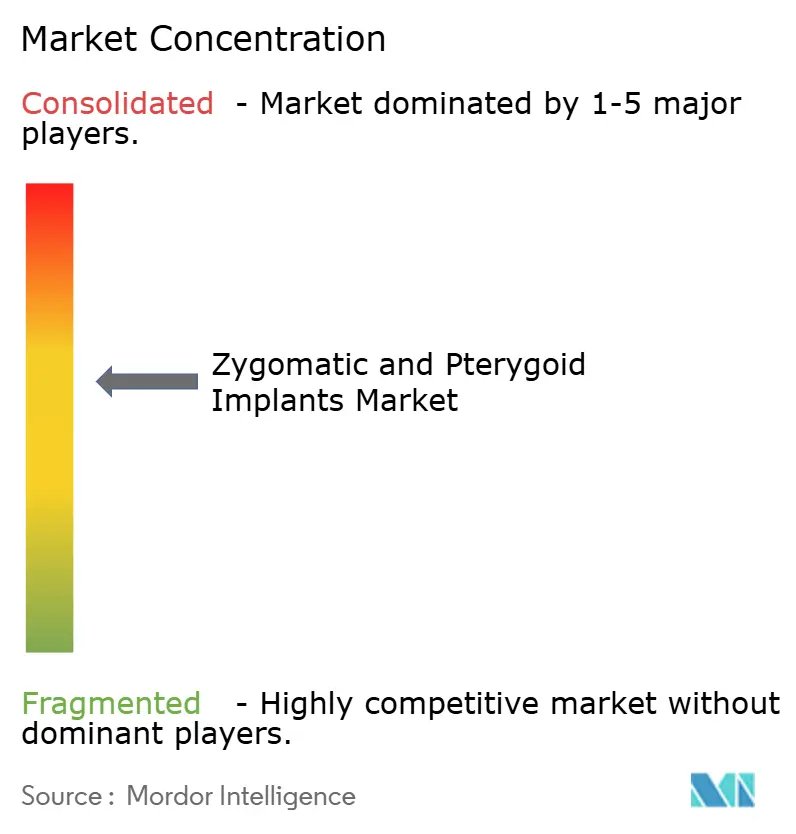
| Market Concentration | Medium |
Major Players *Disclaimer: Major Players sorted in no particular order Image © Mordor Intelligence. Reuse requires attribution under CC BY 4.0. | |
Zygomatic And Pterygoid Implants Market Analysis by Mordor Intelligence
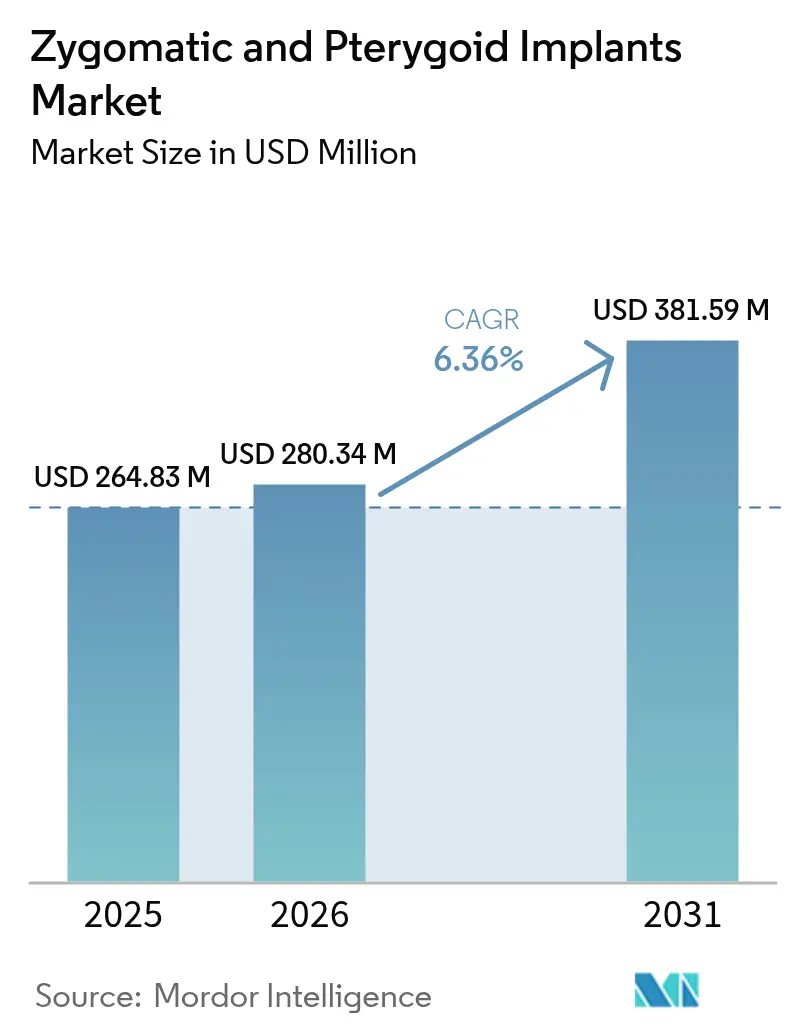
The Zygomatic And Pterygoid Implants Market size is projected to be USD 264.83 million in 2025, USD 280.34 million in 2026, and reach USD 381.59 million by 2031, growing at a CAGR of 6.36% from 2026 to 2031.
Clinical preference is shifting toward extra-maxillary anchorage solutions that bypass bone-grafting, shortening treatment timelines and expanding eligibility for patients with severe maxillary atrophy. Guidance issued by the U.S. Food and Drug Administration in 2024 placed zygomatic devices outside the streamlined endosseous pathway, highlighting their distinct biomechanical profile; nevertheless, a predicate-based route remains viable, as shown by NobelZygoma TiUltra’s 510(k) clearance in 2025. Immediate-loading protocols now dominate procedure volume because long-term survival consistently exceeds 98%, satisfying patient demand for same-day function. Digital dentistry, particularly cone-beam CT planning, CAD-CAM prosthetics, and dynamic navigation, continues to lower the learning curve, allowing more surgeons to offer complex extra-maxillary procedures.
Key Report Takeaways
- By product type, zygomatic implants led with 74.02% of zygomatic and pterygoid implants market share in 2025 while pterygoid implants recorded the highest projected CAGR at 7.29% through 2031.
- By implant length, fixtures above 50 millimeters accounted for the fastest growth, expanding at a 9.93% CAGR between 2026-2031, whereas the 31-to-50 millimeter group retained 47.87% of the 2025 revenue.
- By application, severe maxillary atrophy drove an 8.43% CAGR to 2031, overtaking the historically dominant maxillary-sinus indication, which held 56.72% of 2025 value.
- By procedure type, immediate loading accounted for 61.08% of 2025 procedures and is advancing at a 7.68% CAGR through 2031.
- By end user, ambulatory surgical centers are growing at 8.79% a year to 2031, narrowing the 54.18% volume lead hospitals held in 2025.
- By geography, North America retained 41.23% of 2025 value, the largest regional share, while Asia-Pacific is forecast to grow at 9.63% a year, the fastest pace worldwide.
Note: Market size and forecast figures in this report are generated using Mordor Intelligence’s proprietary estimation framework, updated with the latest available data and insights as of 2026.
Market Trends and Insights
Drivers Impact Analysis of Zygomatic And Pterygoid Implants Market*
| Driver | (~) % Impact on CAGR Forecast | Geographic Relevance | Impact Timeline |
|---|---|---|---|
| Rising Prevalence of Severe Maxillary Atrophy & Edentulism | +1.2% | Global, acute demand in aging North America, Europe, urban Asia-Pacific | Long term (≥ 4 years) |
| Clinical Advantage of Graft-Less, Immediate-Loading Rehabilitation | +1.5% | Global, early uptake in North America and Western Europe, spreading to Asia-Pacific and Latin America | Medium term (2-4 years) |
| Adoption of Digital Dentistry | +0.9% | North America, Europe, high-income APAC markets | Medium term (2-4 years) |
| Quad-Zygomatic Protocols Expanding Eligible Patient Pool | +0.8% | Specialist centers in North America and Europe, gradual diffusion to APAC | Long term (≥ 4 years) |
| Dental Tourism Surge for Complex Oral Rehabilitation | +0.7% | Turkey, Spain, Hungary, Poland, Mexico, Costa Rica, Thailand, India | Short term (≤ 2 years) |
| Pilot Insurer Reimbursements for Oncologic Maxillectomy | +0.6% | United States, selected European payers | Medium term (2-4 years) |
| Source: Mordor Intelligence | |||
Rising Prevalence of Severe Maxillary Atrophy & Edentulism
The World Health Organization noted in 2024 that severe periodontal disease affects 20% of adults, with prevalence spiking among people older than 65 and oncologic survivors.[1] Maxillary atrophy results in vertical and horizontal bone loss, precluding the placement of conventional implants, prompting the adoption of zygomatic and pterygoid solutions that deliver fixed prostheses within weeks. Rapid execution appeals to patients managing diabetes or osteoporosis who cannot tolerate lengthy graft healing. United Nations projections show that the global population aged 65 and older will reach 1.5 billion by 2050, locking in long-term demand.
Clinical Advantage of Graft-Less, Immediate-Loading Rehabilitation
Pooled analyses published by the International Team for Implantology documented a 98.1% survival rate for immediately loaded zygomatic implants. Removing graft steps cuts operating-room time up to 40% and eliminates graft material costs. A 2024 prospective study achieved 100% survival for Straumann’s ZAGA implants over 46.5 months, validating predictable outcomes when anatomical protocols are followed.[2] Economic and clinical benefits continue to push immediate loading toward mainstream dominance.
Adoption of Digital Dentistry
Cone-beam CT, CAD-CAM, and dynamic navigation have transformed planning accuracy, reducing angular deviation to under 2° and trimming average surgery time by 18 minutes. Platforms from Straumann, Nobel Biocare, and ZimVie deliver cloud-based planning with 3D-printed guides, accelerating surgeon onboarding. High equipment costs still limit penetration in price-sensitive markets, creating a digital divide between premium urban clinics and resource-constrained settings.
Quad-Zygomatic Protocols Expanding Eligible Patient Pool
Long-term cohort data showed 97.7% implant survival and 98.2% prosthetic success for quad-zygomatic cases, extending fixed rehabilitation to patients once considered untreatable. Training academies operated by Straumann and Nobel Biocare certify surgeons, and the FDA explicitly labeled NobelZygoma for quad indications in 2025, signaling regulatory confidence.
Restraints Impact Analysis of Zygomatic And Pterygoid Implants Market*
| Restraint | (~) % Impact on CAGR Forecast | Geographic Relevance | Impact Timeline |
|---|---|---|---|
| High Procedural & Implant Costs | -0.9% | Global, acute in emerging markets with limited coverage | Long term (≥ 4 years) |
| Steep Surgical Learning Curve & Limited Specialist Base | -1.1% | APAC, Latin America, MEA regions with sparse training infrastructure | Long term (≥ 4 years) |
| Post-Operative Sinusitis Management Burden | -0.5% | Global clinical concern | Medium term (2-4 years) |
| Regulatory Ambiguity on Extra-Maxillary Devices | -0.4% | Emerging APAC, Latin America, MEA markets | Medium term (2-4 years) |
| Source: Mordor Intelligence | |||
High Procedural & Implant Costs
One arch of zygomatic rehabilitation in North America ranges from USD 15,000 to USD 40,000, 150-200% above standard implant therapy. Major insurers such as Cigna limit coverage to cancer, congenital defects, or trauma, excluding periodontal disease in most circumstances.[3] Patients seek lower-cost destinations abroad, but cross-border care complicates follow-up and warranty enforcement.
Steep Surgical Learning Curve & Limited Specialist Base
Comprehensive credentialing programs require cadaver labs, live-patient mentoring, and significant tuition, restricting the global pool of trained surgeons. Operators with fewer than 20 zygomatic cases observe sinusitis in over 20% compared with 10% among high-volume surgeons. Limited expertise hampers adoption in emerging regions.
*Our forecasts treat driver/restraint impacts as directional, not additive. The impact forecasts reflect baseline growth, mix effects, and variable interactions.
Zygomatic And Pterygoid Implants Market Segment Analysis
By Product Type:
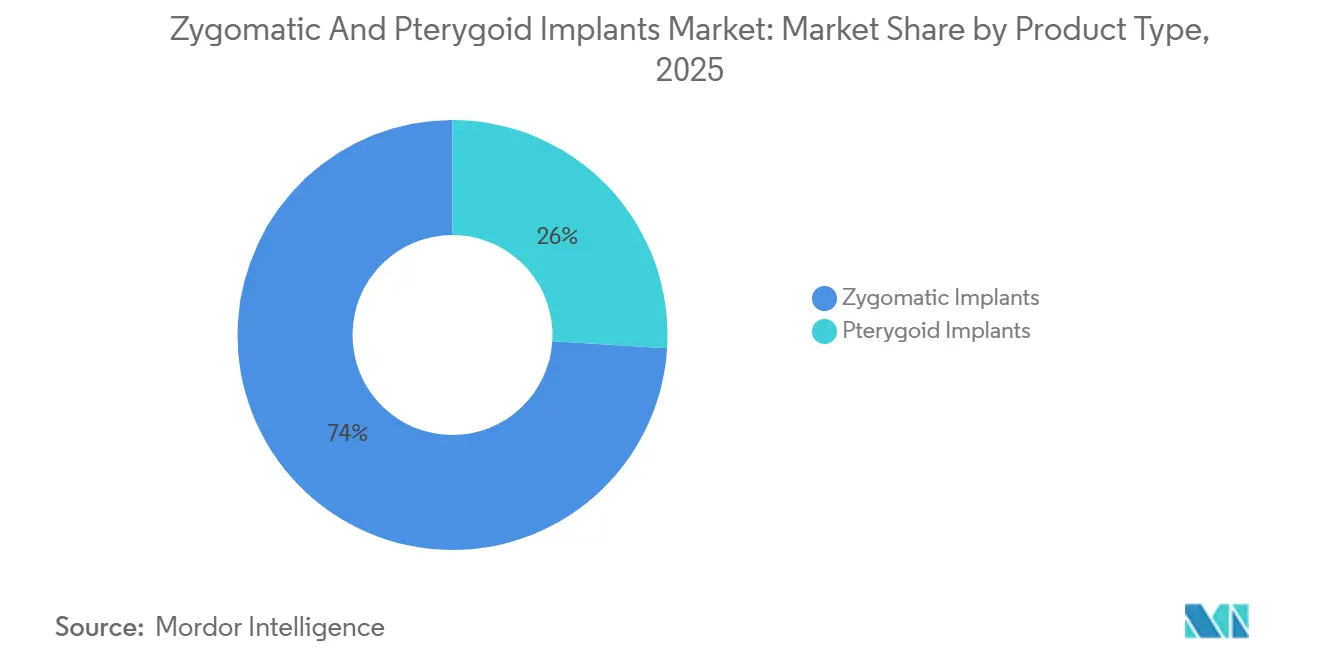
Zygomatic Dominance Anchors Full-Arch ProtocolsZygomatic implants held 74.02% of 2025 revenue, anchoring most full-arch cases and reinforcing the leadership of NobelZygoma and Straumann ZAGA. Pterygoid implants, while smaller, are expanding 7.29% a year as surgeons combine anterior zygomatic and posterior pterygoid fixation for balanced load distribution. Hybrid demand is set to keep pterygoid share climbing within the zygomatic and pterygoid implants market.
Increasing adoption of pterygoid fixtures reflects documented 95.6% six-year success and the desire to shorten cantilevers in full-arch prostheses. Ongoing training and digital guides are expected to narrow outcome gaps between the two product lines, sustaining healthy rivalry that benefits end users within the zygomatic and pterygoid implants market.

By Length of Implant:
Extreme Atrophy Drives Demand for Extended FixturesImplants 31-50 mm accounted for 47.87% of 2025 placements, yet lengths above 50 mm are rising fastest at a 9.93% CAGR. The zygomatic and pterygoid implants market share for long fixtures is climbing as clinicians treat patients with severe bone loss or post-oncology maxillectomy. Extended lengths provide bicortical anchorage and exceed 35 N cm insertion torque, prerequisites for immediate loading in the zygomatic and pterygoid implant markets.
Longer implants, offered up to 60 mm by NobelZygoma TiUltra, suit anatomies with aggressive sinus pneumatization. Growth in this category underscores surgeons’ confidence in digital navigation to accurately traverse complex trajectories without breaching critical structures.
By Application:
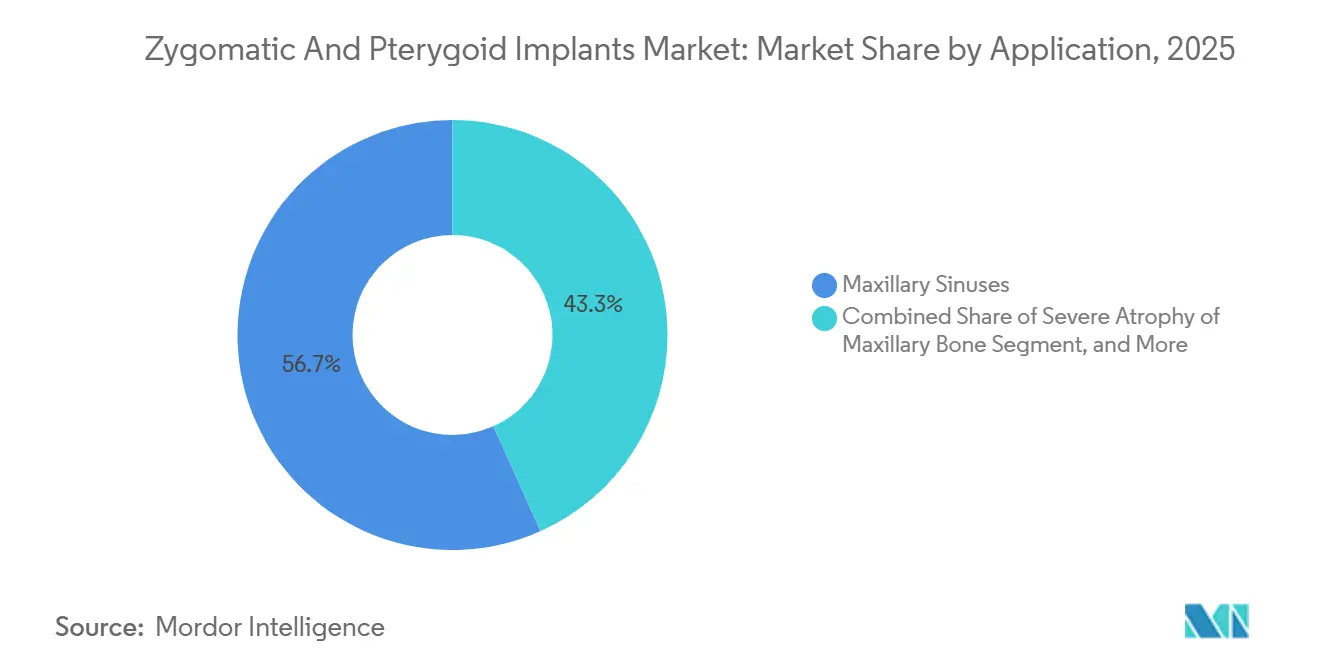
Severe Atrophy Gains MomentumMaxillary-sinus indications still commanded 56.72% of 2025 revenue; however, severe atrophy cases are expanding 8.43% yearly as clinicians extend graft-less therapy to edentulous and post-trauma patients. The zygomatic and pterygoid implants market size for severe atrophy is projected to overtake sinus procedures early in the next decade.
Guidelines now encourage use in patients contraindicated for grafting because of diabetes, smoking or bisphosphonate therapy. Wider indication breadth widens the addressable patient pool and diversifies revenue streams within the zygomatic and pterygoid implants market.
By Procedure Approach:
Immediate Loading Becomes StandardImmediate loading accounted for 61.08% of 2025 procedures and is growing at 7.68% per year, with a documented 98% survival. Surgeons leverage high primary stability and digital occlusal guidance to place fixed provisional prostheses within 24 hours, elevating patient satisfaction and clinic productivity in the zygomatic and pterygoid implants market.
Delayed loading remains for low-torque or high-risk cases, but its 39% share is expected to erode as confidence in immediate-function protocols solidifies. Manufacturers continue to position surface-treated implants and multi-unit abutments expressly for same-day teeth, deepening the trend toward immediate loading.
By End User:
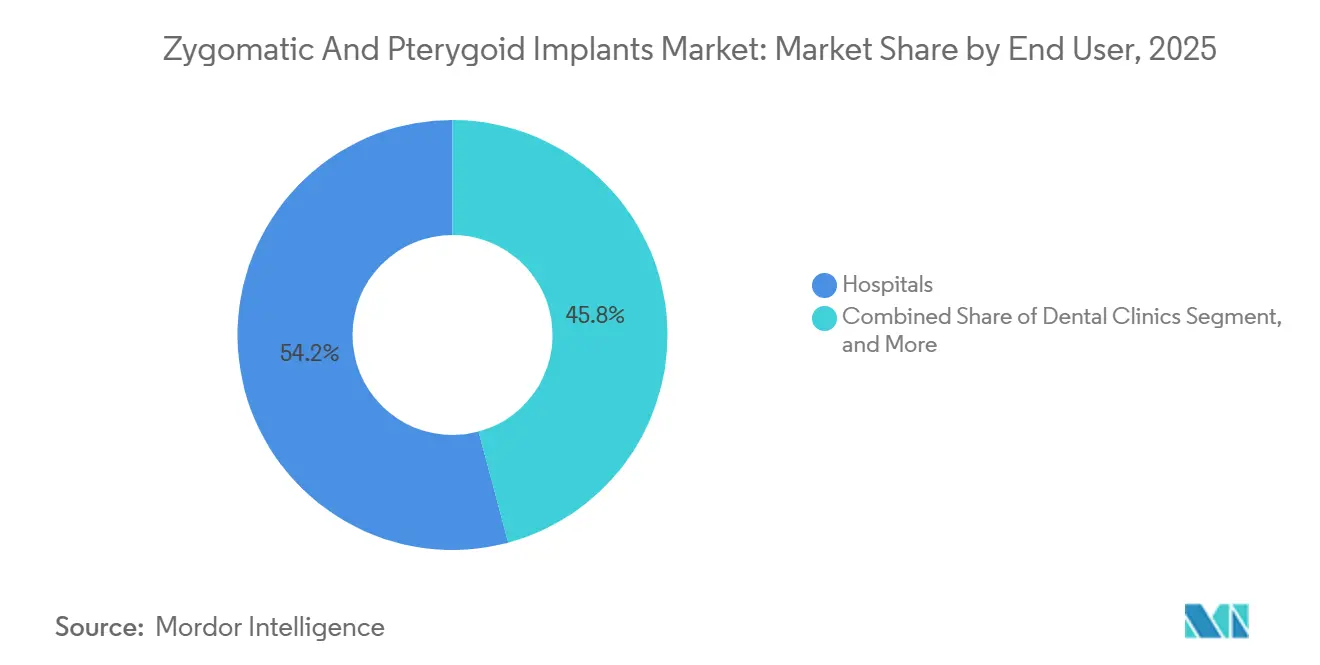
Outpatient Settings AccelerateHospitals held 54.18% of 2025 cases, reflecting their capacity to manage comorbidities under general anesthesia. Ambulatory surgical centers are growing fastest, with a 8.79% CAGR, aided by increased U.S. Medicare facility fees for complex dental rehabilitation. Supportive reimbursement is enabling same-day discharge models that suit immediate-function zygomatic workflows in the zygomatic and pterygoid implants market.
Dental clinics represent a smaller yet specialized tier where office-based anesthesia is permitted and high-end imaging is available. Continuous expansion of CBCT ownership will gradually elevate clinic participation.
Geography Analysis
North America Zygomatic and Pterygoid Implants Market
North America contributed 41.23% of 2025 value to the zygomatic and pterygoid implants market. Favorable oncology reimbursement, dense continuing-education networks, and high disposable incomes sustain premium adoption. U.S. private insurers cover cancer-related cases, while Canada’s provincial plans subsidize medically necessary reconstructions, creating steady volume.
Europe Zygomatic and Pterygoid Implants Market
Europe ranks second. Harmonized CE-marking under MDR eases multicountry rollout; Germany, France, and the United Kingdom anchor core demand, while Spain and Hungary attract cross-border patients seeking 30-50% fee reductions. Currency stability and widespread acceptance of immediate-load dentistry underpin resilient growth despite macroeconomic pressures.
APAC Zygomatic and Pterygoid Implants Market
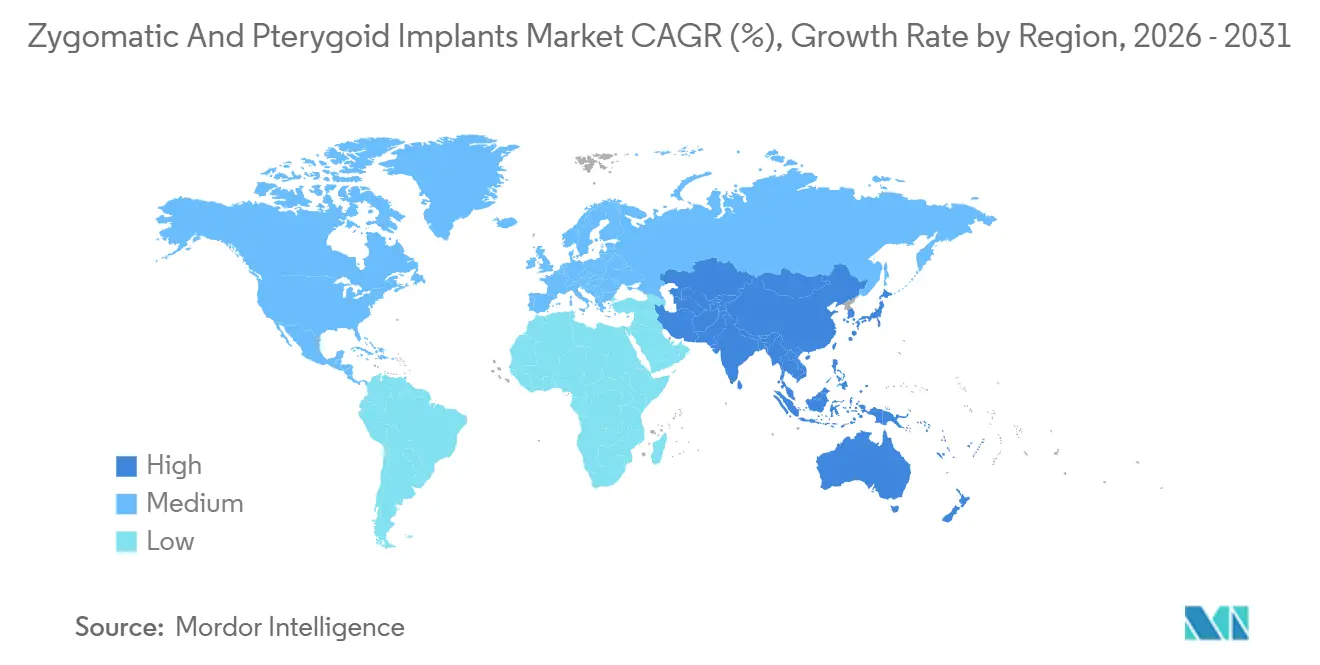
Asia-Pacific is the fastest-growing territory, expanding 9.63% annually. Urban China and India generate sheer volume, whereas Japan and South Korea capture premium case values. Thailand and Singapore leverage medical tourism frameworks, promoting bundled packages that include CBCT, implant surgery, and prosthetic delivery in a single trip, strengthening regional contributions to the zygomatic and pterygoid implants market.
MEA and South America Zygomatic and Pterygoid Implants Market
Middle East & Africa present concentrated demand pockets, especially among affluent populations in the Gulf Cooperation Council. Government-funded specialty centers in the United Arab Emirates and Saudi Arabia are recruiting European-trained surgeons to run digital implant suites. South America’s upswing is paced by Brazil’s large private dental sector and Argentina’s cost-competitive clinics, which are drawing Chilean clients, though currency volatility tempers momentum.
Regulatory Landscape
In the United States, zygomatic and pterygoid implants are regulated as Class II devices under FDA 21 CFR 872.3640 and commonly proceed through the Traditional 510(k) pathway based on substantial equivalence to predicates. Recent 510(k) clearances illustrate regulator throughput for extra-maxillary indications, including K240143 for Jdentalcare Srls JDZygoma dental implants in October 2024 and K252090 for a pterygoid indication for GM Helix Implants in December 2025.
In Europe, implantable devices operate under the EU Medical Device Regulation MDR (Regulation (EU) 2017/745). In June 2026, the European Commission published Delegated Regulation (EU) 2026/1451, expanding exemptions from mandatory clinical investigations for certain implantable and Class III devices when supported by strong clinical evaluation under MDR Article 61. Global testing and substantiation align with ISO 14801, which entered a new ISO project stage in September 2025, with national adoptions such as KS P ISO 14801-2024 and IRAM-ISO 14801:2025 supporting testing expectations across markets.
Competitive Landscape
The top five suppliers, Straumann, Nobel Biocare (Envista), Dentsply Sirona, Zimmer Biomet, and Osstem, command a significant portion of global dental-implant revenue, giving them resources to fund training academies, digital workflows, and post-market surveillance. Straumann’s ZAGA Academy and Nobel Biocare’s Zygoma Academy credential thousands of surgeons each year, locking participants into their respective ecosystems. Dentsply Sirona’s 2024 financial filing revealed USD 973 million in implant-segment sales, down year-on-year due to pricing pressure and competitive discounting.
ZimVie invested USD 26.9 million in R&D and launched the Implant Concierge workflow, signaling a pivot toward software-driven differentiation. Lower-priced Asian manufacturers such as Osstem and Noris Medical are gaining traction in price-sensitive markets, forcing incumbents to defend share with proprietary surface treatments and comprehensive warranties. Regulatory clarity arrived in August 2025 when the FDA cleared NobelZygoma TiUltra via 510(k), proving that predicate evidence can secure approval for extra-maxillary devices. Digital-native startups offering AI planning that works across implant brands may disrupt entrenched ecosystems, encouraging open-platform collaboration.
Zygomatic And Pterygoid Implants Industry Leaders
-
Noris Medical
-
S.I.N. Implant System
-
Southern Implants
-
Straumann Holding AG
-
IDC Implant & Dental Co.
- *Disclaimer: Major Players sorted in no particular order
Zygomatic And Pterygoid Implants Market Companies Covered in this Report
- Adin Dental Implant Systems
- B&B Dental Implant Co.
- BioHorizons
- Bioline Dental Implants
- Danaher
- Dentsply Sirona
- IDC Implant & Dental Co.
- Implant Swiss
- JDentalCare
- Neoss
- Nobel Biocare (Envista)
- Noris Medical
- OsseoSource
- Osstem Implant
- S.I.N. Implant System
- Silimed
- Southern Implants
- Straumann Group
- TitaniumFix
- Zimmer Biomet
Market Opportunities and Future Outlook
A whitespace area exists around standardizing complex-case workflows and de-risking technique adoption for a broader provider base, particularly in regions with limited specialist density. The shift toward immediate-loading and graft-less protocols makes planning accuracy and complication management central purchasing criteria, creating room for integrated solutions that combine CBCT-based planning, guided surgery, and remote anchorage-specific implant-prosthetic kits. Evidence from clinical literature and education initiatives continues to formalize pterygoid implants as an alternative to posterior maxillary augmentation, such as the 2025 British Dental Journal review on pterygoid implant planning, supporting broader adoption beyond highly specialized zygomatic-only centers.
Product and service differentiation ties to patient-centered outcomes and documented performance in severe atrophy. For example, a February 2026 Frontiers in Oral Health publication reported chewing efficiency for zygomatic implant-supported fixed restorations comparable to conventional fixed restorations, with higher patient-centered outcome scores. On the compliance side, EU MDR documentation requirements and transparency mechanisms such as SSCP publications create an opportunity for suppliers to compete on clinical evidence quality and post-market follow-up infrastructure, as demonstrated by Adin Dental Implant Systems publishing an SSCP for its Touareg-OS Zygomatic Dental Implants in October 2025.
Recent Industry Developments in Zygomatic And Pterygoid Implants Market
- February 2026: A clinical case published by Noris Medical demonstrates dynamic CBCT navigation for placing zygomatic and pterygoid implants in full-arch rehabilitation. The case documentation highlights a workflow that addresses surgical risk and accuracy constraints that limit wider uptake of extra-maxillary anchorage. It also reinforces how digital navigation is being positioned alongside implant systems to shorten the learning curve for complex trajectories.
- November 2025: The US FDA 510(k) clearance (K251129) for a zygomatic implant system by S.I.N. Implant System was granted, expanding its US offerings. The clearance strengthens the company's ability to compete in the United States with a system-level offering tailored to zygomatic indications.
- July 2024: The US FDA 510(k) clearance (K240609) for the S.I.N. Dental Implant System, including zygomatic implants for immediate loading, was granted. The move aligned product labeling with the market shift toward immediate-loading workflows in complex rehabilitation.
Zygomatic And Pterygoid Implants Market Report Scope and Research Methodology
Market Definition and Coverage
This market covers the revenue generated from zygomatic and pterygoid dental implants used to restore the upper jaw when conventional implants are limited by low bone volume. The sizing reflects implant products sold for clinical use across major regions.
Scope exclusions: This sizing excludes prosthetic crowns and bridges, bone graft materials, surgical instruments, and imaging or planning software revenue.
Segments Covered in This Report
- By Product Type
- Zygomatic Implants
- Pterygoid Implants
- By Length of Implant
- Up to 30 mm
- 31 – 50 mm
- Above 50 mm
- By Application
- Severe Atrophy of Maxillary Bone
- Maxillary Sinuses
- Trauma & Other Indications
- By Procedure Approach
- Immediate Loading
- Delayed Loading
- By End User
- Hospitals
- Dental Clinics
- Ambulatory Surgical Centers
- By Geography
- North America
- United States
- Canada
- Mexico
- Europe
- Germany
- United Kingdom
- France
- Italy
- Spain
- Rest of Europe
- Asia-Pacific
- China
- Japan
- India
- Australia
- South Korea
- Rest of Asia-Pacific
- Middle East & Africa
- GCC
- South Africa
- Rest of Middle East & Africa
- South America
- Brazil
- Argentina
- Rest of South America
- North America
Data Sources, Market Sizing, and Validation
Desk Research
Desk research was used to set the starting boundaries and build realistic assumptions for procedure volumes and pricing. We reviewed public health statistics and oral health burden indicators from sources such as the World Health Organization, the US CDC, and national health ministries that publish dental care utilization and aging population trends. To understand the dental implant context, we also referenced resources like the American Dental Association and peer reviewed journals that discuss severe maxillary atrophy management and implant survival outcomes.
On the supply side, public company filings, investor presentations, and regulatory and clinical literature were used to map product availability, positioning, and likely adoption pathways across hospitals, dental clinics, and ambulatory surgical centers. We also used paid subscriptions for company financials and intelligence, and for patent databases to track product development signals and refresh assumptions around innovation pace. These desk sources are not exhaustive, and additional public materials were checked to validate data points and clarify items where documentation was unclear.
Primary Interviews and Surveys
Primary work was done through expert interviews and structured surveys with implant focused clinicians, distributors, and manufacturer side roles who track demand and pricing in day to day practice. For a global view, inputs were balanced across APAC, EMEA, and the Americas so adoption differences, reimbursement realities, and training driven uptake could be captured, then cross checked against the model outputs.
Distribution of primary research fieldwork respondents
| Company type | Respondent position | Region |
|---|---|---|
| Top tier: 35% | CXOs: 16% | APAC: 46% |
| Mid tier: 49% | Functional/Unit leaders: 41% | EMEA: 30% |
| Smaller Players: 16% | Managers: 43% | Americas: 24% |
Market-Sizing & Forecasting
The core model uses a top-down approach where the demand pool is reconstructed from dental implant procedure activity and then narrowed to cases that realistically require zygomatic or pterygoid anchorage. Country totals are built from indicators such as severe maxillary atrophy prevalence signals, implant dentistry access, the share of immediate versus delayed loading approaches, the setting mix across hospitals and dental clinics, and typical implant counts per full arch case. Pricing is handled through a practical ASP ladder by geography, which is then adjusted for channel margins and expected product mix by implant length categories.
Once the demand pool was shaped, selective bottom-up approximations were used to corroborate the totals, including supplier and distributor channel checks, sampled ASP times volume math for key countries, and consistency checks against reported business focus areas from public materials. When direct country signals were thin, gaps were handled through proxying from clinically similar markets, then corrected using interview feedback on training availability and referral patterns.
For forecasting, we applied scenario analysis supported by near term consensus from primary respondents on adoption drivers and constraints. Growth was then paced using variables like dentist and specialist capacity trends, awareness and training penetration, replacement cycle of older solutions, and expected price progression under inflation and product upgrades, followed by an analyst review to keep the curve realistic year by year.
Data Validation & Update Cycle
Validation is done through multiple checks so the final number is not dependent on one data stream. We compare outputs against independent signals like regional dental implant activity direction, specialty clinic expansion, and observed pricing ranges shared by different respondent groups, and then outliers are investigated before sign off. If a major variance shows up at the country level, the assumption is revisited, and targeted re-contacts are triggered to confirm the point that is driving the gap.
Each report is refreshed annually, and interim updates are made when material events occur that can shift adoption or pricing. Before delivery, a final pass is completed so the narrative and the model reflect the latest available information in the public domain and from fresh expert inputs.
Mordor Intelligence's Zygomatic and Pterygoid Implants Market Size Compared With Other Published Estimates
Published market sizes for this space often differ because teams draw the boundary in different ways, and then apply different procedure volume signals and pricing logic. Even small differences in what counts as a qualifying severe atrophy case, or how implant length mixes are treated, can move the total meaningfully in a niche implant category.
Surgeon reported case mix patterns, observed implant ASP ranges by region, and the split of procedures across dental clinics versus hospitals are the checks that keep Mordor Intelligence tied to the addressable pool for zygomatic and pterygoid implants, rather than a broader dental implant basket. Differences also come from forecast stance, since some publishers publish aggressive adoption curves without re-checking training capacity and referral flows, and from currency timing, since year average conversion versus point in time rates can shift USD totals.
Benchmark comparison
| Source | Market Size | Gaps in Research Methodology |
|---|---|---|
| Mordor Intelligence | USD 0.26 B (2025) | |
| Global Consultancy A | USD 0.36 B (2024) | Uses a different base year and appears to apply a broader application boundary, which can pull in adjacent implant and procedure revenue beyond strict zygomatic and pterygoid implant units. |
| Industry Publisher B | USD 0.33 B (2025) | The estimate is presented as a single global value with limited visible checks on implant length mix, setting mix, and region level ASP ladders, which can compress country differences into one average. |
The comparison shows that most of the spread is explained by boundary choices, base year selection, and how pricing progression is handled across regions. By keeping the demand pool traceable to procedure settings, case mix, and region specific ASP ranges, the final sizing remains easy to follow and simpler to reproduce when assumptions are updated.
Key Questions Answered in the Report
How large is the zygomatic and pterygoid implants market today?
The zygomatic and pterygoid implants market size was USD 0.26 billion in 2025 and is set to reach USD 0.38 billion by 2031.
Which product type dominates sales?
Zygomatic implants commanded 74.02% of 2025 revenue, maintaining leadership over pterygoid systems.
What region grows fastest through 2031?
Asia-Pacific is projected to expand at a 9.63% CAGR, outpacing all other geographies.
Why is immediate loading preferred?
Immediate loading shows 98% survival, delivers same-day teeth and cuts treatment time, driving 61.08% of 2025 procedures.
How are regulatory agencies treating these devices?
The FDA requires traditional 510(k) evidence, as shown by NobelZygoma TiUltra’s 2025 clearance, affirming predicate-based pathways.