
Zinc Market Size and Share
Market Overview
| Study Period | 2021 - 2031 |
|---|---|
| Market Volume (2026) | 13.93 Million tons |
| Market Volume (2031) | 15.06 Million tons |
| Growth Rate (2026 - 2031) | 1.57 % |
| Fastest Growing Market | Asia-Pacific |
| Largest Market | Asia-Pacific |
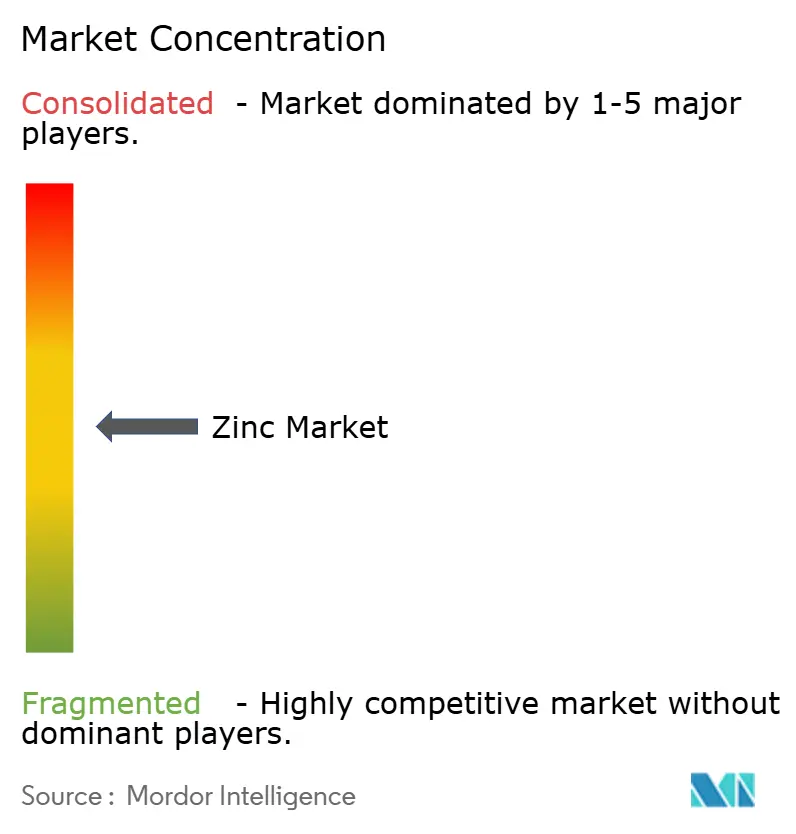
| Market Concentration | Medium |
Major Players *Disclaimer: Major Players sorted in no particular order Image © Mordor Intelligence. Reuse requires attribution under CC BY 4.0. | |
Zinc Market Analysis by Mordor Intelligence
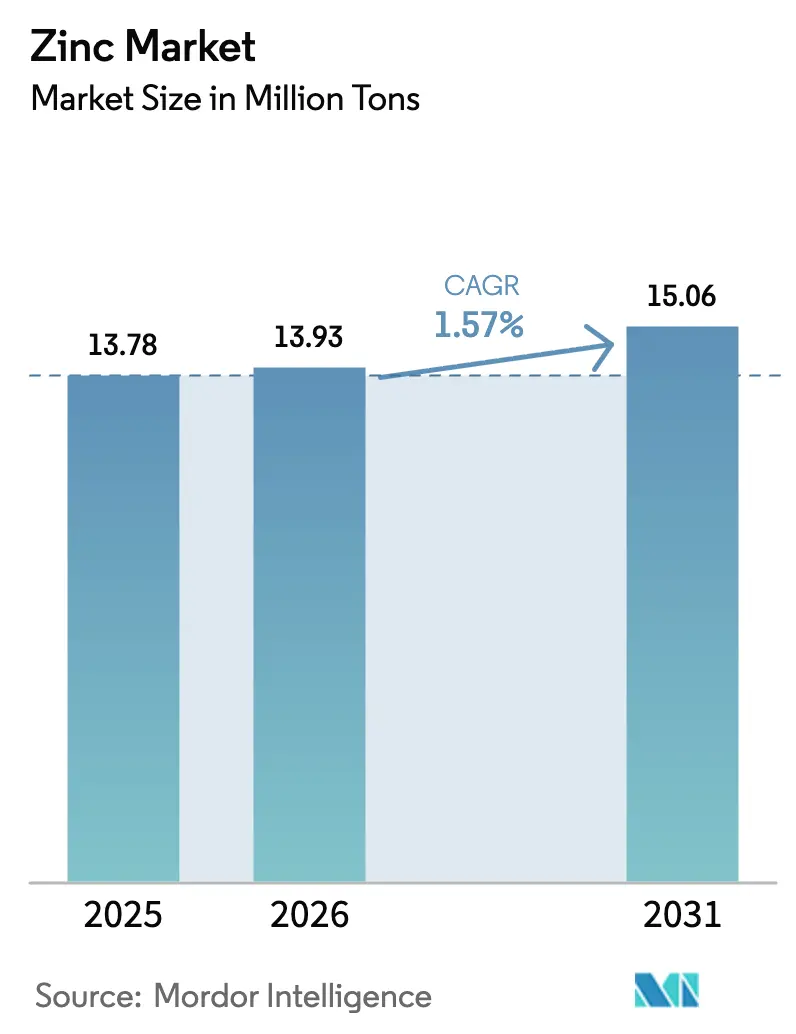
The Zinc Market size was valued at 13.78 Million tons in 2025 and is estimated to grow from 13.93 Million tons in 2026 to reach 15.06 Million tons by 2031, at a CAGR of 1.57% during the forecast period (2026-2031). Demand resilience rests on public-sector infrastructure pipelines, rising penetration of corrosion-resistant steel in electric vehicles and renewable-energy hardware, and the steady uptake of zinc-based fertilizers across micronutrient-deficient soils. Improved secondary-recycling economics, spurred by the European Union’s Carbon Border Adjustment Mechanism, are nudging smelters toward lower-carbon feedstocks even as mine-supply concentration injects price risk. Meanwhile, pilot deployments of zinc-ion and zinc-air batteries signal an emergent outlet for specialty compounds that could add up to 100,000 tons of incremental offtake by 2031.
Key Report Takeaways
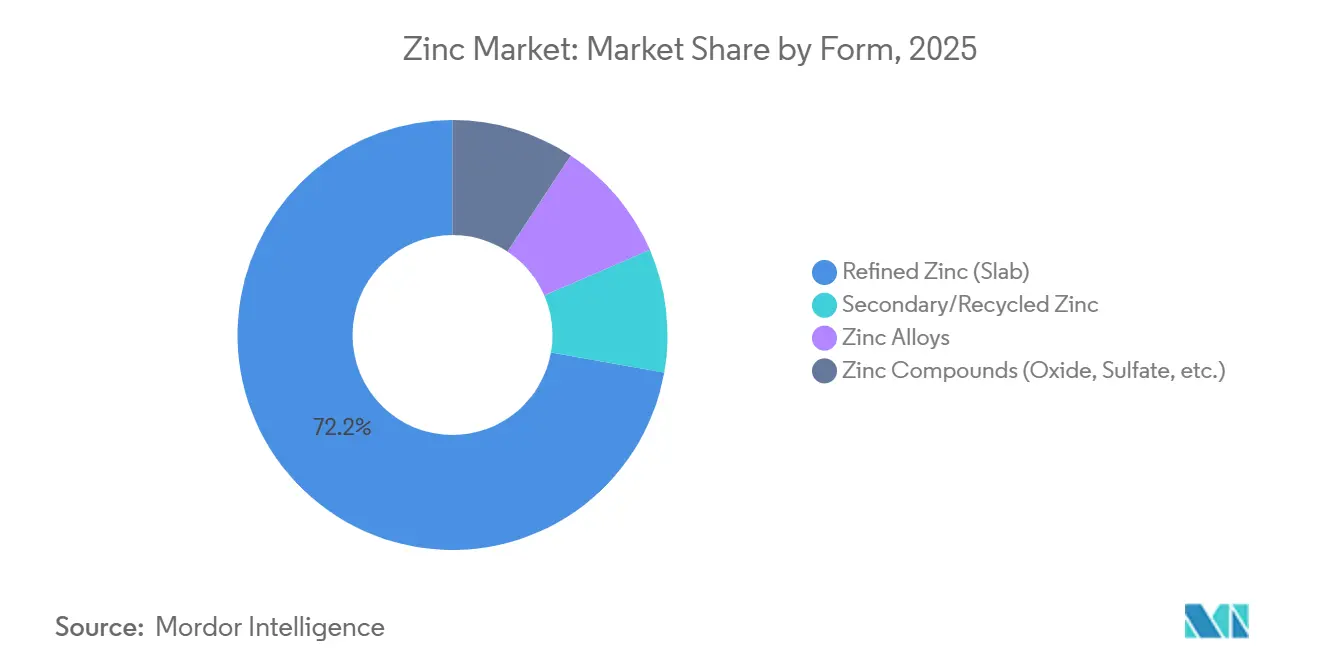
- By form, refined zinc (slab) led with 72.21% of zinc market share in 2025, while zinc compounds are projected to advance at a 2.89% CAGR through 2031.
- By production process, primary production accounted for 65.62% of the zinc market share in 2025; secondary production is on track for the fastest 2.71% CAGR to 2031.
- By application, galvanizing captured 52.37% of the zinc market size in 2025, whereas zinc oxide and chemicals are poised for a 2.77% CAGR over 2026-2031.
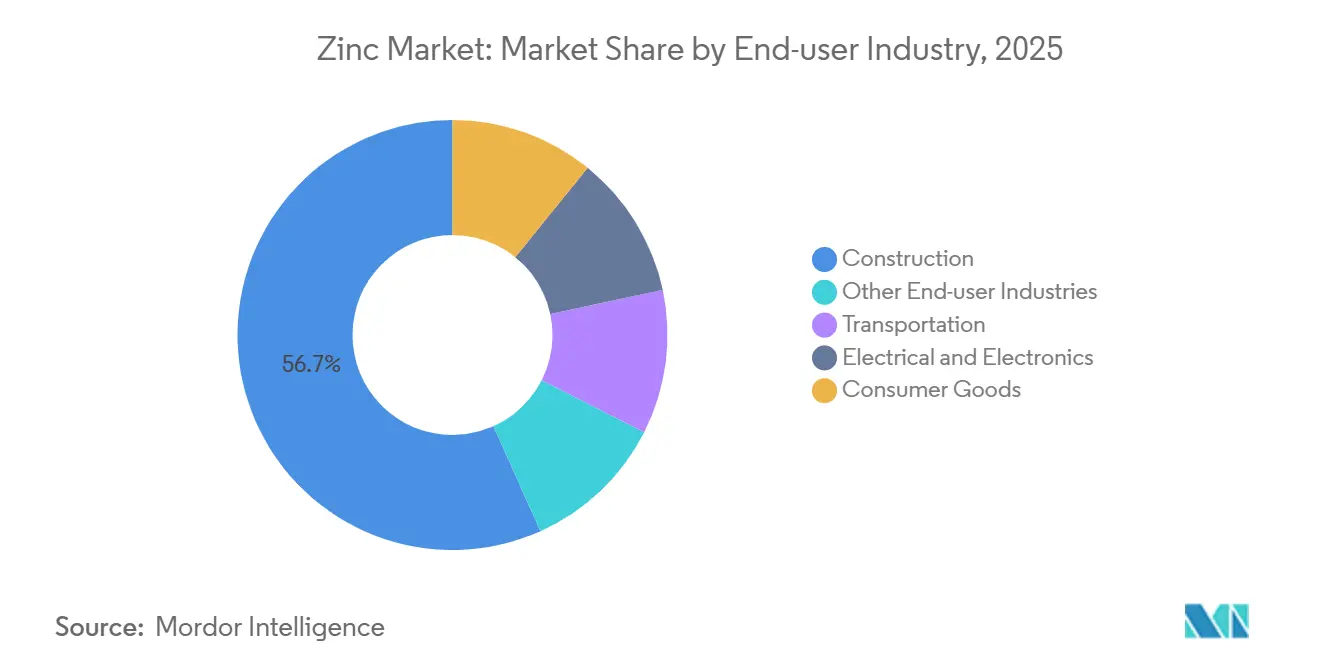
- By end-user industry, construction dominated with a 56.71% share in 2025; electrical and electronics are expected to rise at a 2.42% CAGR to 2031.
- By geography, Asia-Pacific commanded 62.86% of 2025 volume and is also projected to register the quickest 2.50% CAGR through 2031.
Note: Market size and forecast figures in this report are generated using Mordor Intelligence’s proprietary estimation framework, updated with the latest available data and insights as of 2026.
Market Trends and Insights
Drivers Impact Analysis of Zinc Market*
| Driver | (~) % Impact on CAGR Forecast | Geographic Relevance | Impact Timeline |
|---|---|---|---|
| Infrastructure-led galvanizing demand surge | +0.4% | Asia-Pacific core, spillover to Middle-East and Africa | Medium term (2–4 years) |
| Growth of corrosion-resistant steel in EV and renewables | +0.3% | Global, concentrated in North America, Europe, China | Long term (≥4 years) |
| Expansion of zinc-based fertilizers in micronutrient-deficient soils | +0.2% | South Asia, Sub-Saharan Africa, Latin America | Long term (≥4 years) |
| Emergence of zinc-ion and zinc-air batteries | +0.1% | North America, Europe (pilot deployments) | Long term (≥4 years) |
| EU drinking-water zinc-coated plumbing mandate | +0.1% | Europe, with adoption spillover to Middle-East | Short term (≤2 years) |
| Source: Mordor Intelligence | |||
Infrastructure-Led Galvanizing Demand Surge
Multiyear public-capital programs are locking in visibility for galvanizers across Asia and North America. India’s USD 1.4 trillion National Infrastructure Pipeline, ASEAN expressway corridors, and the U.S. Infrastructure Investment and Jobs Act require hundreds of thousands of tons of coated steel that must comply with ISO 1461 and ASTM A123 thickness norms. Galvanized coatings deliver service lives of 50-100 years in rural zones, cementing their status as the preferred corrosion barrier where lifecycle economics dominate.
Growth of Corrosion-Resistant Steel in EV and Renewables
Battery-electric platforms specify Zn-Ni and Zn-Mg alloy coatings to withstand road salt and thermal cycling, while offshore-wind monopiles rely on hot-dip galvanizing plus organic topcoats to fight chloride attack. Although thinner high-strength steels reduce coating per ton, total coated-steel tonnage rises fast enough to maintain volume growth, reinforcing long-run support for the zinc market[1]International Renewable Energy Agency, “Wind Offshore Foundations 2025,” irena.org.
Expansion of Zinc-Based Fertilizers in Micronutrient-Deficient Soils
Roughly half of global cereal soils lack bioavailable zinc, depressing yields by 10-30%. India’s Soil Health Card initiative now recommends zinc application below 0.6 ppm thresholds, and HarvestPlus biofortification programs demonstrate 15-20% yield gains with zinc-enhanced seed. While regional heavy-metal limits vary, demand for zinc sulfate, oxide, and chelates continues to climb in South Asia and Sub-Saharan Africa.
Emergence of Zinc-Ion and Zinc-Air Batteries
The U.S. DOE’s Long Duration Energy Storage Earthshot aims for 10-hour systems at USD 0.05 kWh by 2030. Zinc-ion chemistries offer theoretical 400 Wh kg energy densities without flammability hazards. Pilot projects by Urban Electric Power and Zinc8 are surpassing 1,000 cycles in controlled runs, although dendrite mitigation and electrolyte stability remain hurdles. Successful scale-up could redirect a modest yet material slice of lithium-ion demand toward the zinc market.
Restraints Impact Analysis of Zinc Market*
| Restraint | (~) % Impact on CAGR Forecast | Geographic Relevance | Impact Timeline |
|---|---|---|---|
| Stringent environmental and ESG regulations | -0.3% | Global, acute in Europe and China | Medium term (2–4 years) |
| Price volatility from supply shocks and surpluses | -0.2% | Global, amplified in import-dependent regions | Short term (≤2 years) |
| Fertilizer heavy-metal limits curbing zinc sulfate | -0.1% | Europe, North America, select Asian jurisdictions | Long term (≥4 years) |
| Source: Mordor Intelligence | |||
Stringent Environmental and ESG Regulations
CBAM certificates priced near EUR 85 tCO₂ raise landed costs for non-EU refined zinc by USD 130-240 t. China’s dual-carbon roadmap shut 30 small smelters in 2024, erasing 200,000 t of capacity and underscoring a shift toward low-emission supply that already trades at 3-5% premiums. Scope 3 audits under the EU Corporate Sustainability Reporting Directive elevate certified smelters and disadvantage high-carbon peers.
Fertilizer Heavy-Metal Limits Curbing Zinc Sulfate
Germany and the Netherlands apply precautionary heavy-metal thresholds to soil amendments, and synthetic zinc compounds face exclusion from organic protocols. Chelated alternatives free of co-contaminants cost 2-3× more than zinc sulfate, throttling uptake among smallholders in price-sensitive regions until Codex standards converge by 2027[2]United States Department of Agriculture, “National Organic Program Handbook 2025,” usda.gov .
*Our forecasts treat driver/restraint impacts as directional, not additive. The impact forecasts reflect baseline growth, mix effects, and variable interactions.
Zinc Market Segment Analysis
By Form:
Refined Slabs Anchor Supply, Compounds Capture Specialty GrowthRefined zinc (slab) controlled 72.21% of 2025 volume, underpinning galvanizing, die-casting, and brass-mill demand. In contrast, zinc compounds will rise at 2.89% CAGR, buoyed by zinc-oxide activators in tires, UV-blocking pharmaceutical grades, and transparent-conductor films for flexible electronics. The zinc market size linked to recycled feed is widening as Waelz-kiln expansions in Europe and India reclaim oxide from electric-arc-furnace dust at 75% lower CO₂ intensity.
Secondary zinc enjoys policy tailwinds from CBAM credits and corporate Scope 3 targets. Integrated miners are therefore pivoting toward compounds and alloys that earn double-digit premiums, diversifying revenue away from commodity slabs amid persistent Chinese oversupply.


By Production Process:
Primary Dominance Erodes as Recycling ScalesPrimary production held 65.62% of output in 2025, but its 1.5-2.5 t CO₂ tZn footprint faces escalating carbon costs. Mine delays and the fact that the top ten sites supply 40% of concentrates add another layer of risk. Conversely, secondary production (recycling) is growing at 2.71% CAGR capture zinc market share as hydrometallurgical leaching upgrades recovery from EAF dust and brass skimmings. European Waelz kilns now process 500,000 t of waste annually, and India is adding capacity to process 4 million t of dust generated by its steel sector.
By Application:
Galvanizing Leads, Zinc Oxide Chemicals AccelerateGalvanizing commanded 52.37% of the zinc market size in 2025, supported by ISO-compliant coating layers that extend steel life on bridges, towers, and metro rail. Continuous lines adopting Zn-Al-Mg baths cut recoating intervals by 30-50%. Meanwhile, zinc oxide and chemicals will post a 2.77% CAGR as tire, pharma, and electronics sectors scale. Aluminum-doped zinc oxide films on solar cells and foldable displays strengthen forward demand visibility.
By End-user Industry:
Construction Dominates, Electronics OutpacesConstruction absorbed 56.71% of 2025 demand, sustained by India’s housing, ASEAN expressways, and U.S. bridge rehabilitation. Electrical and electronics, forecast at 2.42% CAGR, rides on zinc-oxide varistors in EV chargers and transparent conductors in displays. Automotive OEMs meanwhile adopt Zn-Mg coatings up to 15 µm thick for battery-tray corrosion warrants, cushioning tonnage even as per-unit steel use in vehicles declines.
Geography Analysis
APAC Zinc Market
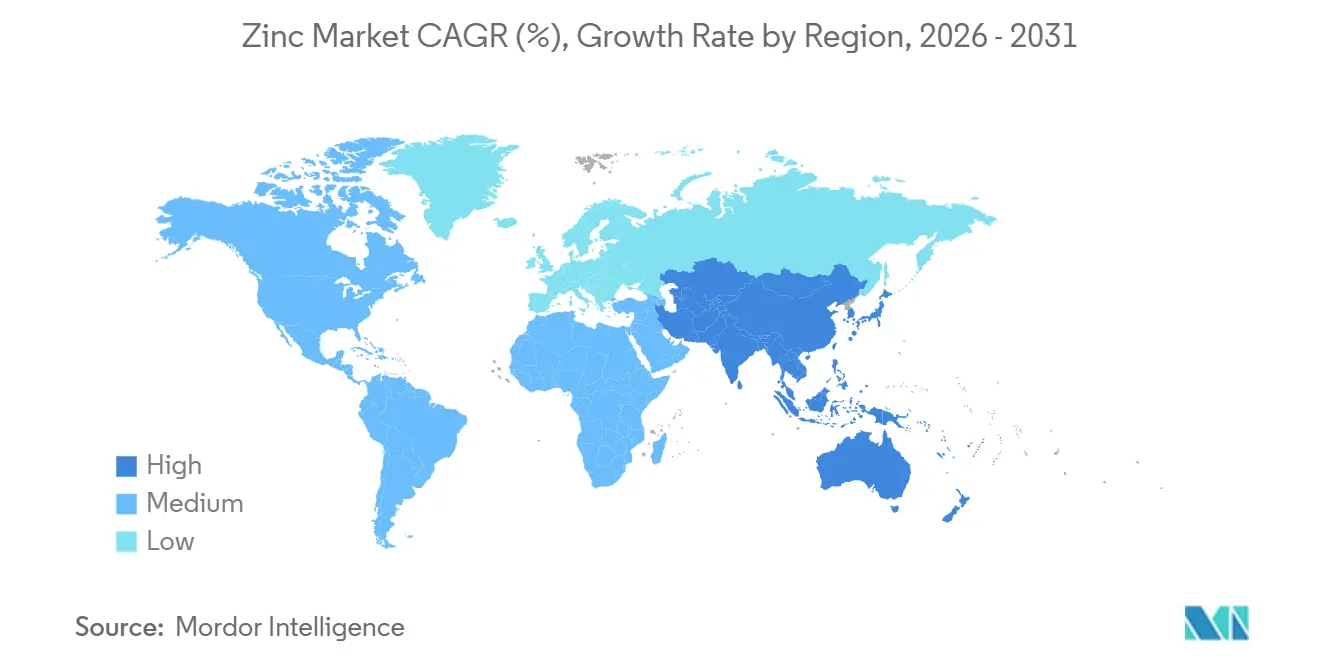
Asia-Pacific accounted for 62.86% of global tonnage in 2025 and is set for the highest 2.50% CAGR as China’s grid-modernization and India’s USD 1.4 trillion infrastructure pipeline absorb coated steel. ASEAN mega-projects such as Indonesia’s Nusantara capital city multiply galvanized demand, while Japan and South Korea supply Zn-Al-Mg coating know-how. Regulatory pushes, China’s dual-carbon smelter closures, and India’s soil-health fertilizer incentives reinforce regional consumption.
North America Zinc Market
North America benefits from the U.S. infrastructure law and Canada’s low-carbon Trail smelter upgrade. South32’s Hermosa project will add 150,000 t of refined output in 2027, reducing import reliance. Mexico’s export-oriented auto lines keep galvanizers running near capacity, anchoring regional zinc flows.
Europe Zinc Market
Europe’s CBAM, enforceable from 2026, lifts demand for certified low-carbon metal from Nyrstar, Boliden, and other compliant smelters. At the same time, Implementing Decisions 2024/367-368 compel plumbing manufacturers to validate zinc release below 5 mg L under the revised Drinking Water Directive, spurring alloy reformulations.

Regulatory Landscape
Environmental and product-compliance rules are tightening across major zinc supply and demand centers, shifting competitiveness toward certified, low-carbon and low-impurity material. In Europe, the Carbon Border Adjustment Mechanism (CBAM) becomes enforceable from 2026. Drinking Water Directive implementation measures (Implementing Decisions 2024/367-368) also require plumbing-system compliance testing for zinc release, which is pushing brass and zinc-alloy value chains toward validated formulations and traceable inputs.
In China, updated concentrate quality controls add an additional upstream compliance layer. The State Administration for Market Regulation implemented GB/T 20424-2025 effective September 1, 2025, revising impurity limits (including arsenic and thallium thresholds) for zinc concentrates. In parallel, emissions-reduction actions under China’s dual-carbon roadmap, including 2024 smelter closures referenced in the report context, are reinforcing a shift toward larger, better-controlled assets. International bodies such as the International Lead and Zinc Study Group (ILZSG) continue to publish balance and utilization signals that influence inventory policy and contract terms.
Value Chain Analysis
The zinc value chain runs from mining and concentrate production through smelting and refining into slabs, alloys, and chemical intermediates, then into galvanizing, die-casting, brass mills, rubber and chemical applications, and emerging energy-storage pilots. Concentrate-to-metal economics are sensitive to treatment charges and byproduct credits, and a visible 2026 benchmark reset occurred as Teck Resources and Korea Zinc agreed a zinc concentrate treatment charge of USD 85 per tonne for 2026, with adjustments tied to silver and germanium pricing. This, in turn, feeds into refining margins and contract structures.
Operating-control changes at smelters can re-route trade flows and tolling arrangements. Korea Zinc’s acquisition of Nyrstar’s US assets, including the Clarksville smelter, concentrated downstream capability in North America under a large, integrated operator, while Trafigura’s continued marketing and supply roles through 2026 preserve established offtake and logistics interfaces. Upstream updates such as Glencore’s Q1 2026 zinc production of 176,900 tonnes also show how mine life cycles and maintenance events propagate through concentrate availability, smelter utilization, and ultimately refined zinc availability for galvanizers and chemical producers.
Competitive Landscape
The zinc market hosts a moderate structure: top five players hold roughly 45% of capacity, while fast-moving Chinese smelters fill price-driven supply gaps. Glencore’s Red Dog maintenance and Teck’s Trail upgrade briefly tightened supply, yet rapid Chinese output ramping restored balance, underscoring elastic capacity outside the OECD. Certified low-carbon producers command 3-5% premiums as downstream buyers track Scope 3 emissions.
Recyclers reclaiming zinc from EAF dust cut carbon by 75% and enjoy CBAM advantages, while specialty converters target battery-grade oxide and Zn-Mg alloys that receive higher margins. Patent activity in zinc-ion battery electrolytes surged past 200 filings in 2025, indicating intensifying R&D competition among battery start-ups and incumbent material firms.
Zinc Industry Leaders
Glencore
Nyrstar
Teck Resources Limited
KOREAZINC
Vedanta Limited
- *Disclaimer: Major Players sorted in no particular order
Zinc Market Companies Covered in this Report
- Boliden Group
- Glencore
- Grupo Mexico
- Hudbay Minerals Inc.
- IVANHOE MINES
- KOREAZINC
- MMG Australia Limited
- Nexa
- Nyrstar
- South32
- Teck Resources Limited
- Vedanta Limited
- Volcan

Market Opportunities and Future Outlook
Decarbonization-linked procurement and carbon-cost pass-through are creating whitespace for low-carbon and recycled zinc units, particularly in regions exposed to border carbon measures and Scope 3 reporting. With CBAM enforceable from 2026 and EU technical benchmarks emerging for high-purity secondary recovery, including a 99.5% threshold referenced in the evidence pack for high-grade secondary zinc, Waelz-kiln operators and hydrometallurgical recyclers have a clearer product-qualification target. That improves acceptance of secondary feed across refined metal and zinc-chemical supply chains.
In North America, supply-chain localization initiatives also open up room for investment in capacity and downstream processing. Korea Zinc’s plan to deepen its US footprint via the Clarksville asset base, along with its Project Crucible announcement in Tennessee, indicates continued buildout of regional processing capability tied to domestic processing goals. On the demand side, compliance-driven alloy reformulation in EU plumbing applications under Implementing Decisions 2024/367-368 supports value-added zinc alloy and compound opportunities where traceability, migration testing, and consistent chemistry become purchase qualifiers beyond LME-linked pricing.
Recent Industry Developments in Zinc Market
- April 2026: Korea Zinc Co., Ltd. Officially launched Project Crucible, a $7.4 billion critical metals processing facility in Clarksville, Tennessee; construction to start 2027; commercial operations 2029. The launch expands North American zinc supply diversification. Strengthens US-side supply chain for zinc and critical minerals.
- April 2026: Glencore Reaffirmed its 2026 full-year zinc production guidance of 700,000 to 740,000 tonnes in its Q1 2026 production report. The price-relevant outlook for zinc remains anchored by ongoing supply commitments and visibility into mine-to-market flows. Supports price risk assessment and downstream supply commitments.
- March 2026: Teck Resources Limited and Korea Zinc Agreed to a higher treatment charge of $85 a ton for zinc concentrates in 2026, with increased charges for silver and germanium content due to higher market prices. Concentrate pricing dynamics and byproduct credits are evolving with stronger metal prices. Signals tighter concentrate economics and downstream pricing pressures.


Zinc Market Report Scope and Research Methodology
Market Definition and Coverage
This market is sized as the total demand for zinc measured in volume (tons), covering refined zinc metal supply and consumption and closely linked zinc alloy and secondary output that flows into industrial uses.
Scope exclusions: We exclude prices, freight, and trading margins from the market size, and we also exclude downstream value of finished galvanized steel and fabricated parts.
Segments Covered in This Report
- By Form
- Refined Zinc (Slab)
- Zinc Alloys
- Zinc Compounds (Oxide, Sulfate, etc.)
- Secondary/Recycled Zinc
- By Production Process
- Primary Production (Mining and Smelting)
- Secondary Production (Recycling)
- By Application
- Galvanizing
- Die-Casting
- Brass
- Zinc Oxide and Chemicals
- Other Applications
- By End-user Industry
- Construction
- Transportation
- Electrical and Electronics
- Consumer Goods
- Other End-user Industries
- By Geography
- Asia-Pacific
- China
- India
- Japan
- South Korea
- Indonesia
- Malaysia
- Thailand
- Vietnam
- Rest of Asia-Pacific
- North America
- United States
- Canada
- Mexico
- Europe
- Germany
- United Kingdom
- Italy
- France
- Russia
- Spain
- Turkey
- NORDIC Countries
- Rest of Europe
- South America
- Brazil
- Argentina
- Colombia
- Rest of South America
- Middle-East and Africa
- Saudi Arabia
- United Arab Emirates
- Qatar
- South Africa
- Egypt
- Nigeria
- Rest of Middle-East and Africa
- Asia-Pacific
Data Sources, Market Sizing, and Validation
Desk Research
Desk research is used to anchor the model on repeatable public reference series, and to make sure the supply and demand math is realistic before assumptions are applied. We mainly rely on official production, usage, and trade statistics, and then cross-check these with price and inventory signals that typically capture short-term volatility.
Commonly used inputs come from sources such as USGS Mineral Commodity Summaries, International Lead and Zinc Study Group releases, UN Comtrade trade statistics, World Steel Association crude steel and finished steel indicators (as a proxy for galvanizing demand), and London Metal Exchange published price and stock series. In addition, we review company filings and investor presentations, trade association updates, and reputable business press for capacity changes, smelter utilization commentary, and recycling policy signals. Select paid subscriptions are used only where they help with company financials and intelligence, patent lookups, and shipment-level trade checks. This list is illustrative, and many other public and paid sources were also consulted for data collection, validation, and clarification.
Primary Interviews and Surveys
Primary work is used to pressure-test what the public data cannot fully explain, especially the split between primary and secondary metal, regional availability of concentrates, and how demand is shifting across galvanizing, die-casting, and other uses. We speak with a mix of producers, recyclers, distributors, and large end users, and then align the inputs across APAC, EMEA, and the Americas so regional balances do not contradict each other.
Distribution of primary research fieldwork respondents
| Company type | Respondent position | Region |
|---|---|---|
| Top tier: 37% | CXOs: 19% | APAC: 41% |
| Mid tier: 43% | Functional/Unit leaders: 40% | EMEA: 34% |
| Smaller Players: 20% | Managers: 41% | Americas: 25% |
Market-Sizing & Forecasting
Sizing starts from a top-down reconstruction of the refined zinc demand pool using country and regional series for refined production, apparent usage, and net trade flows, which are then normalized to avoid double counting between refined metal and secondary output. Once the demand base is stable, the totals are split using practical shares informed by interviews and supported by public indicators.
Key inputs that shape the model include refined zinc metal production and usage (000 tonnes), mine production trends (zinc content), reported exchange and producer stock movements, and LME cash price direction as a signal for substitution and restocking behavior. We also track steel activity indicators that typically move with galvanizing demand, plus recycling economics that influence secondary supply availability. Where data is missing for smaller countries, we fill gaps using trade-based proxies and regional per-capita intensity checks, and then confirm that the implied totals stay consistent with known global balances.
Forecasts are built using scenario analysis, where growth rates for galvanizing-linked demand, alloy demand, and secondary supply are varied within ranges agreed during expert discussions. The final forecast path is kept realistic by checking that projected tonnage does not break historical relationships between usage, inventories, and price cycles.
Data Validation & Update Cycle
Validation is done through several checks that look for mismatches between the model and independent signals, and then the drivers are revisited until the story and the math agree. We compare the computed market totals against global balance commentary, stock changes, and trade direction, and we also run variance checks so no single region grows faster than its industrial indicators can support.
Before sign-off, outputs go through an internal review where unusual jumps are flagged, assumptions are re-tested, and specific topics are re-checked with selected respondents when needed. Reports are refreshed annually, and interim updates are triggered when a material event changes supply, demand, or price formation, such as major smelter restarts, prolonged curtailments, or policy shifts affecting recycling. Right before delivery, a final analyst pass is completed so clients receive the latest updated view.
Mordor Intelligence's Zinc Market Estimate Compared With Other Published Estimates
Published market sizes for zinc often differ because the underlying unit of measurement is not always the same, and some sources mix value and volume or blend refined metal with ore and concentrate flows. Differences also come from how secondary production is treated, how trade is netted out, and whether the estimate is aligned to a single balance year or smoothed across a cycle.
Another common driver is scope, where one publisher may only count refined zinc metal, while another also adds alloys and selected downstream zinc compounds, which shifts the tonnage total. The year picked for the starting point can also move the number because stocks and price conditions can pull demand forward or delay purchasing. We also see gaps when forecasting assumes a straight-line growth rate without checking mine supply constraints, treatment charge effects, and the pace of galvanizing demand that is linked to steel activity and infrastructure plans.
Benchmark comparison
| Source | Market Size | Gaps in Research Methodology |
|---|---|---|
| Mordor Intelligence | USD 13.78 M (2025) | |
| Industry Association A | USD 13.55 M (2024) | Uses refined zinc usage totals for an earlier balance year and does not fully adjust for inventory changes, which can understate demand in restocking phases. |
| Trade Journal B | USD 14.20 M (2025) | Appears to blend refined zinc and select alloy volumes without a clear netting of intra-regional trade, which can inflate the apparent market total. |
The table shows that most of the spread comes from what gets counted as demand in the year and how secondary and alloy volumes are handled, and then from whether trade and stocks are reconciled to a clean balance. By keeping the market in volume terms and reconciling refined production, usage, and net trade before applying splits, the estimate stays traceable to repeatable inputs, which is the core modeling choice used by Mordor Intelligence.


Key Questions Answered in the Report
How large is the zinc market?
The zinc market size stands at 13.93 million tons in 2026 and is forecast to reach 15.06 million tons by 2031, with a CAGR of 1.57% through 2031.
Which region leads consumption of zinc?
Asia-Pacific commanded 62.86% of 2025 volume and is set to remain the dominant consumer.
Why is secondary production (recycling) of zinc gaining momentum?
Recycling via Waelz kilns cuts carbon footprints by 75% and benefits from EU CBAM incentives, driving a 2.71% CAGR to 2031.
How will EU plumbing rules affect zinc alloys?
Implementing Decisions 2024/367-368 force brass-fitting makers to reduce lead below 0.2% and validate zinc migration, spurring alloy reformulation ahead of the December 2026 deadline.
Page last updated on:


 Your data is secure and never sold or shared.


