
Market Overview
| Study Period | 2021 - 2031 |
|---|---|
| Forecast Data Period | 2026 - 2031 |
| Base Year Market Size (2025) | 1.41 gigawatt |
| Market Volume (2026) | 1.68 gigawatt |
| Market Volume (2031) | 3.98 gigawatt |
| Growth Rate (2026 - 2031) | 18.86 % |
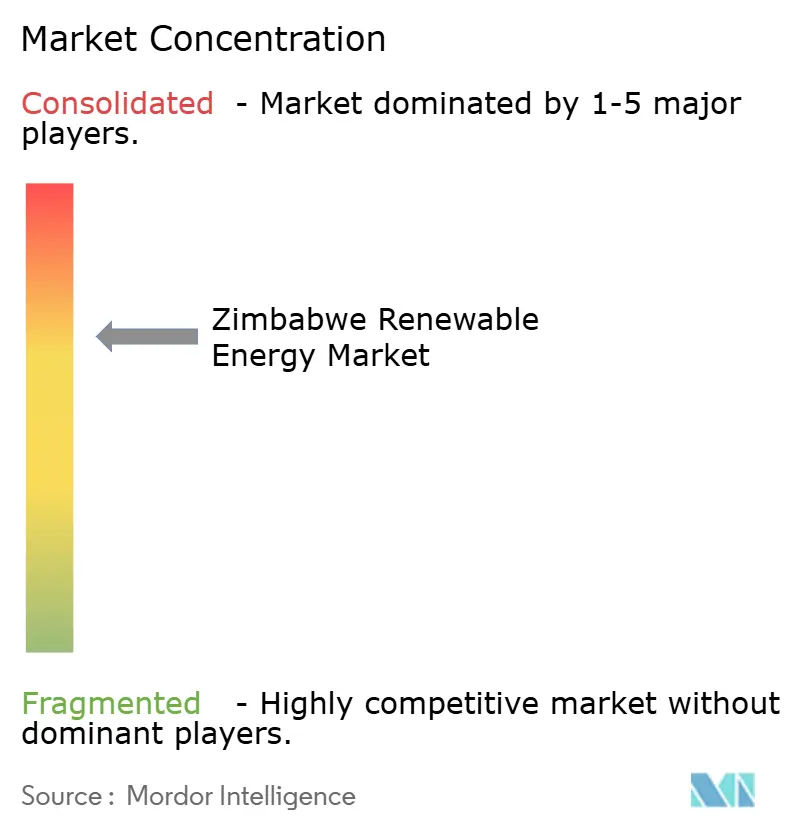
| Market Concentration | Medium |
Major Players *Disclaimer: Major Players sorted in no particular order Image © Mordor Intelligence. Reuse requires attribution under CC BY 4.0. | |
Zimbabwe Renewable Energy Market Analysis by Mordor Intelligence
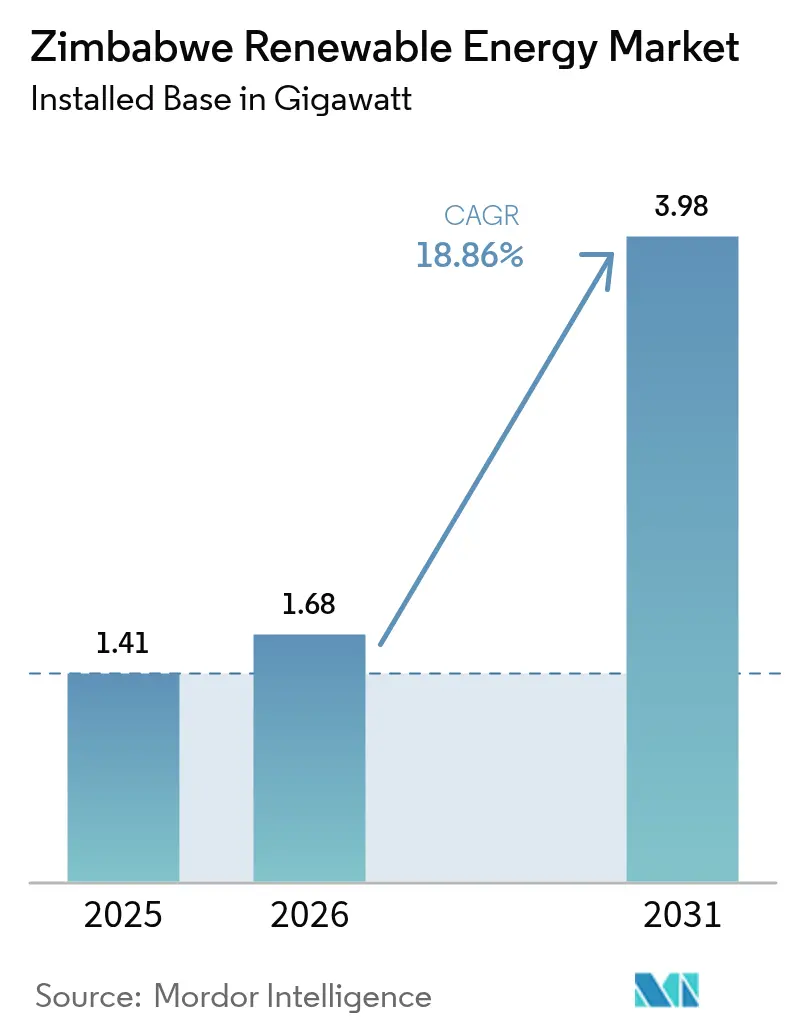
The Zimbabwe Renewable Energy Market size was valued at 1.41 gigawatt in 2025 and estimated to grow from 1.68 gigawatt in 2026 to reach 3.98 gigawatt by 2031, at a CAGR of 18.86% during the forecast period (2026-2031).
This surge is propelled by abundant solar irradiation that tops 3,000 sunshine hours each year, persistent droughts curtailing hydropower output at Kariba Dam, and government mandates setting 26.5% renewable penetration targets in the national mix. Currency shortages that restrict thermal-fuel imports and stepped electricity tariffs that erode mining margins further accelerate solar adoption. Structured blended-finance facilities from development partners such as Old Mutual and the Facility for Energy Inclusion (FEI) mitigate sovereign risk and crowd in private capital. Regulatory reforms introduced by the Zimbabwe Energy Regulatory Authority (ZERA) are standardizing equipment quality and installer credentials, lowering entry barriers for early-stage solar developers.
Key Report Takeaways
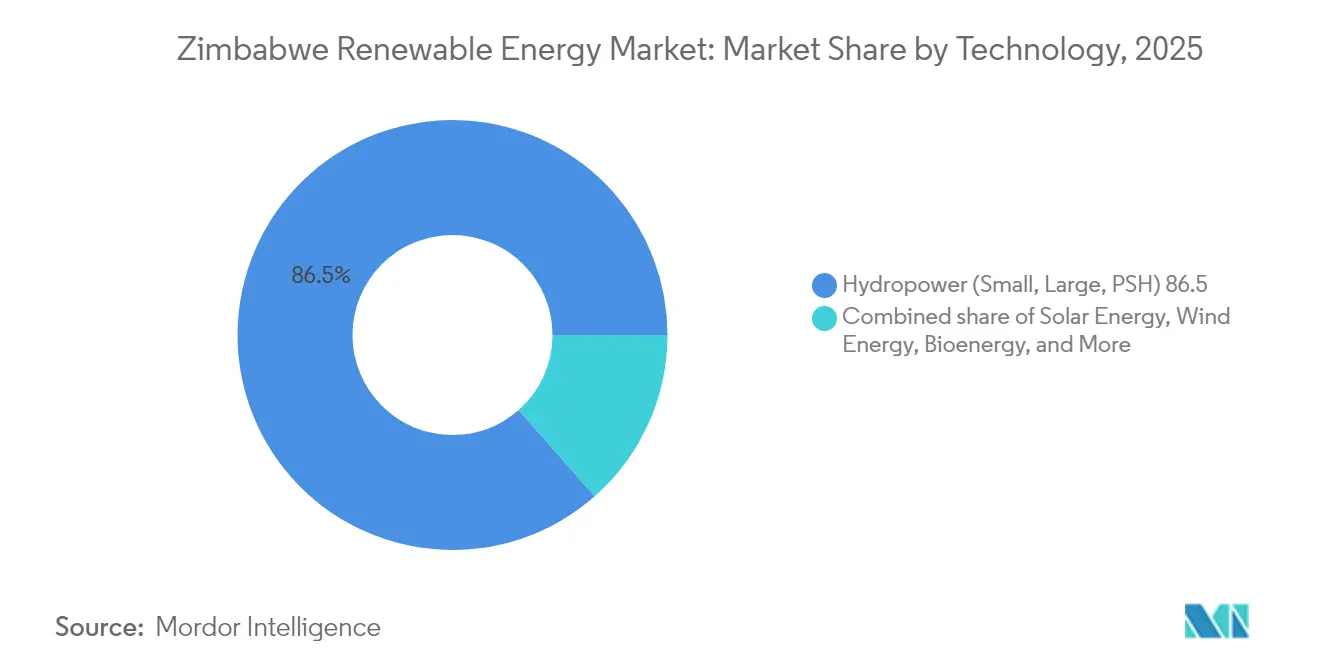
- By technology, hydropower led with 86.50% of Zimbabwe's renewable energy market share in 2025, while solar energy is projected to record a 47.20% CAGR through 2031.
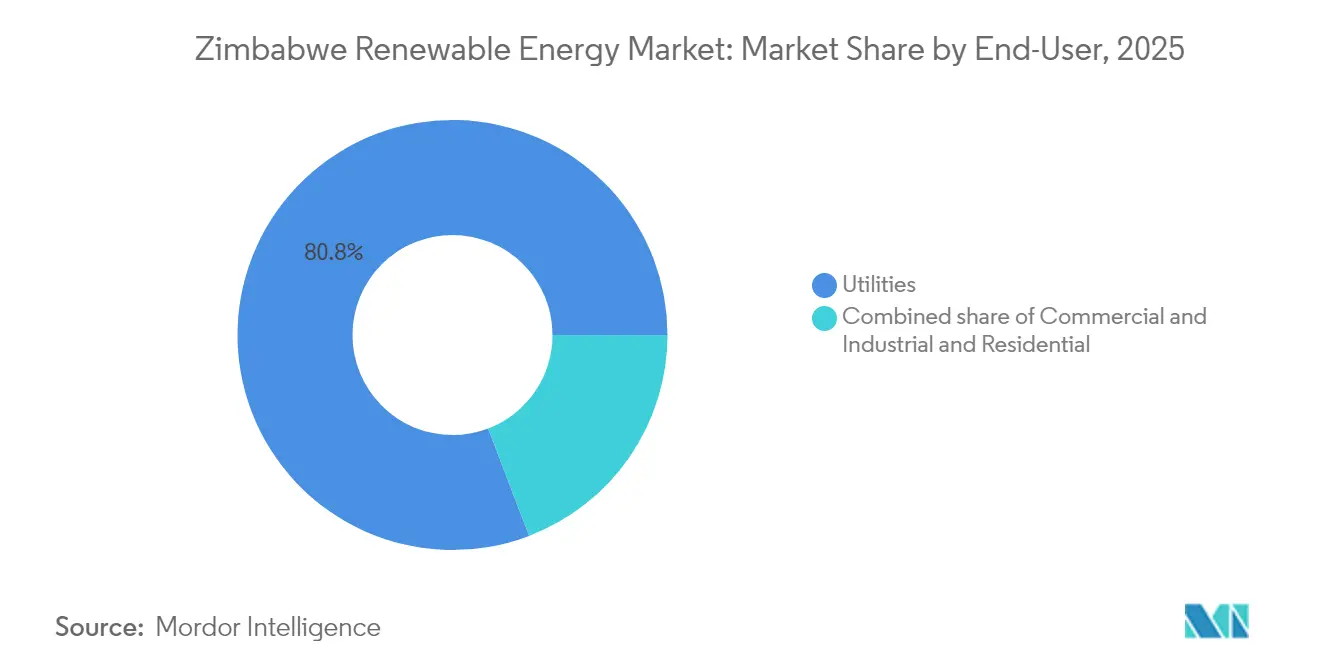
- By end-user, utilities held 80.80% of the Zimbabwean renewable energy market size in 2025 and are projected to advance at a 19.74% CAGR to 2031. Utilities' dominance stems from the urgent need of state-owned enterprises to procure renewables amid foreign-exchange constraints.
Note: Market size and forecast figures in this report are generated using Mordor Intelligence’s proprietary estimation framework, updated with the latest available data and insights as of 2026.
Zimbabwe Renewable Energy Market Trends and Insights
Drivers Impact Analysis*
| Driver | (~) % Impact on CAGR Forecast | Geographic Relevance | Impact Timeline |
|---|---|---|---|
| Abundant solar irradiation levels | +8.2% | National, with highest potential in Matabeleland and Midlands provinces | Medium term (2-4 years) |
| Government RE targets & REFiT incentives | +4.7% | National, with priority focus on rural provinces | Short term (≤ 2 years) |
| Mining-sector captive-solar momentum | +3.4% | Matabeleland South, Midlands, and mineral-rich provinces | Medium term (2-4 years) |
| Rapid PV-module cost decline | +3.1% | Global impact with national deployment benefits | Medium term (2-4 years) |
| Rural electrification demand & donor funding | +2.8% | Rural provinces, particularly Mashonaland and Manicaland | Long term (≥ 4 years) |
| Blockchain-backed mini-grid crowd-financing pilots | +1.9% | Rural and peri-urban areas with limited grid access | Long term (≥ 4 years) |
| Source: Mordor Intelligence | |||
Abundant Solar Irradiation Levels Drive Industrial Adoption
Zimbabwe receives nearly 20 MJ/m²/day of insolation across 300 sunshine days annually, positioning the Zimbabwe renewable energy market to capitalize on one of Africa’s strongest solar resources.[1]UNICEF Zimbabwe, “Solar Irradiation and Energy Access,” unicef.org Mining firms react by installing captive PV arrays that hedge against 20-hour rolling blackouts and stepped tariffs that pushed a 1,000 kWh monthly bill above USD 240 in 2024. The International Renewable Energy Agency values decentralized renewables in agriculture at USD 7 billion, signaling further upside beyond utility-scale plants. Solar-plus-storage providers now bundle lithium-ion systems to stabilize mine-site loads in Matabeleland South. Early adopters report paybacks of less than four years because rooftop arrays offset diesel genset expenditure and exposure to ZIG depreciation.
Government Renewable Energy Targets Create Investment Momentum
The Ministry of Energy and Power Development has set targets of 1,100 MW of renewables by 2025 and 2,100 MW by 2030, anchoring the Zimbabwean renewable energy market to clear capacity milestones. Standardized power-purchase agreement templates, drafted with input from the Africa Legal Support Facility, de-risk bankability for IPPs. InfraCo Africa’s USD 1.5 million equity investment in the 30 MWac Vungu Solar IPP established Zimbabwe’s first internationally financed solar project and demonstrated appetite for long-term contracts with the Zimbabwe Electricity Transmission & Distribution Company.[2]Agata Bilkiewicz-Kmita, “InfraCo Africa Invests to Pioneer Zimbabwe's First Project-Financed Solar IPP,” PIDG, pidg.org ZERA licensed ten additional projects, totaling 271 MW, within 12 months, which evidences a widening pipeline. Donor-backed results-based financing programs sweeten internal rates of return by paying a per-kWh premium once systems are operational.
Mining Sector Captive Solar Momentum Reshapes Industrial Energy
The mining industry accounts for 60% of Zimbabwe’s export receipts; its operations cannot tolerate repeated grid outages. Caledonia Mining’s 12.2 MW plant supplied 57,722 MWh between February 2023 and December 2024, covering about 20% of Blanket Mine demand before its USD 22.35 million sale-and-leaseback to CrossBoundary Energy. Asset-light models transfer capital and O&M risk to specialist energy companies while locking in discounted tariffs under 15-year offtake contracts. Similar structures are under negotiation at platinum and lithium sites in Midlands Province. The trend is expected to lift the commercial segment’s share of the Zimbabwe renewable energy market beyond 15% by 2025. Integrated offerings that combine solar, storage, and green hydrogen pilot units are under feasibility review.
Blockchain-Backed Mini-Grid Crowd-Financing Pilots
Elevated sovereign risk, rated E/E by Coface, hampers traditional project finance, so innovators tap retail investors through tokenized asset platforms. Old Mutual's USD 100 million blended fund combines government concessionary capital with UNDP guarantees, diluting political risk premia and unlocking senior commercial debt. FEI's USD 10 million facility to Cicada Solar underscores the international appetite for export-oriented commercial and industrial (C&I) projects when bolstered by the African Development Bank's participation. Pilot mini-grids in Manicaland now crowd-source equity in USD-denominated stablecoins, creating transparent yield streams. Smart contracts automate tariff collection and remittance, cutting default risk and slashing transaction costs by 40%.
Restraints Impact Analysis*
| Restraint | (~) % Impact on CAGR Forecast | Geographic Relevance | Impact Timeline |
|---|---|---|---|
| Currency instability & forex shortages | -6.4% | National, with particular impact on import-dependent projects | Short term (≤ 2 years) |
| Limited grid capacity & ageing T&D network | -4.2% | National grid infrastructure, acute in rural areas | Medium term (2-4 years) |
| High cost of capital & country-risk premiums | -2.8% | National, affecting all project financing structures | Medium term (2-4 years) |
| Lithium-battery import bottlenecks at customs | -1.7% | National, particularly affecting solar-plus-storage deployments | Short term (≤ 2 years) |
| Source: Mordor Intelligence | |||
Currency Instability Creates Project Finance Barriers
ZiG devalued from 14 ZiG/USD to 25 ZiG/USD in 2024, eroding investor confidence and inflating capex for imported solar Balance-of-System equipment. The International Finance Corporation identifies currency mismatch between USD-pegged IPP tariffs for exporters and ZiG tariffs for domestic consumers as a top impediment. Hedging tools, such as offshore escrow accounts and index-linked feed-in tariffs, exist, but they elevate transaction complexity and legal costs. Lenders thus front-load debt-service reserve accounts, pushing equity internal rate of return thresholds above 20%. In response, developers favor modular designs that achieve mechanical completion within nine months, limiting foreign-exchange exposure.
Limited Grid Capacity Constrains Utility-Scale Development
Zimbabwe's transmission grid loses up to 20% of dispatched electricity owing to obsolete switchgear and overloaded 330 kV interconnectors. ZESA's USD 350 million debt burden hampers network rehabilitation and SCADA upgrades. National Renewable Energy Laboratory modeling of the Southern African Power Pool shows that constrained cross-border capacity blocks least-cost renewable trade flows and forces curtailment.[3]NREL, “Southern African Power Pool Transmission Study,” nrel.gov Developers, therefore, cluster plants near load centers or embed storage to reduce reverse-power flows. Government plans to concession private transmission loops have stalled amid procurement disputes. Off-grid and mini-grid systems are filling the void, reinforcing the decentralized expansion path of Zimbabwe's renewable energy market.
*Our forecasts treat driver/restraint impacts as directional, not additive. The impact forecasts reflect baseline growth, mix effects, and variable interactions.
Segment Analysis
By Technology: Solar Surge Challenges Hydropower Dominance
Hydropower accounted for 86.50% of Zimbabwe's renewable energy market share in 2025, underscoring the historical centrality of the Kariba Dam. Yet multi-year droughts cut usable water reserves below 300 m, triggering blackouts and galvanizing diversification. Solar PV is projected to compound at a 47.20% annual growth rate through 2031, the fastest pace among all technologies. The Zimbabwe renewable energy market size for utility-scale solar is expected to reach 1,350 MW by 2031, with an additional 225 MW of battery storage to firm evening peaks. Wind remains niche because mean wind-power densities seldom exceed 150 W/m². Bioenergy is on the rise after Statutory Instrument 150 of 2024 mandated ethanol blending, which has boosted bagasse cogeneration to an export-capable capacity of 72.5 MW.
Projected hydrological volatility compels planners to cap new hydroelectric builds at the 2,400 MW Batoka Gorge, contingent upon Zambia's cost-sharing. Geothermal prospects at Binga Hot Springs stay dormant pending exploration finance. Meanwhile, installers report that bifacial modules, combined with single-axis trackers, increase capacity factors by 18 percentage points in Masvingo. Storage-levelized-cost declines below USD 120/kWh aid utility compliance with ZERA's 15% reserve margin rule. Solar's momentum thus embodies a strategic pivot that mitigates climate risk and underpins the long-term security of supply in the Zimbabwe renewable energy market.


By End-User: Utilities Lead Market While Commercial Adoption Accelerates
State utilities held 80.80% of the Zimbabwean renewable energy market share in 2025, as ZESA bulk-procured capacity to offset thermal plant outages. Utility demand still grows at a striking 19.74% CAGR because IPP contracts backstop supply shortfalls and meet universal-access goals. Contracts now incorporate take-or-pay clauses denominated in USD to alleviate investor concerns about ZiG depreciation. Commercial and industrial customers, led by gold, platinum, and lithium miners, are expected to increase their share to 16.2% by 2025. Offtakers prefer Build-Own-Operate-Transfer deals spanning 15 years that cut levelized cost below USD 0.09/kWh.
Residential uptake trails at 3% because the median household weekly income is below USD 40 in rural areas. Pay-as-you-go solar home systems bridge affordability gaps, and donor subsidies reduce upfront deposits by 30%. Bundled productive-use appliances, such as solar water pumps and refrigerators, amplify the economic impact, qualifying projects for climate-finance grants. The Zimbabwe renewable energy industry ecosystem, therefore, diversifies from a utility-centric model to a multi-offtaker landscape that bolsters resilience and de-risks revenue streams.
Geography Analysis
Grid-connected renewable investment clusters in provinces that combine high solar potential with substation headroom. Matabeleland South hosts 40% of the new commercial capacity, including Caledonia Mining's 12.2 MW plant and three forthcoming lithium mine arrays, which together will inject 75 MW by 2026. The Midlands emerges as a solar IPP hub, anchored by the Vungu project; four adjacent brownfield sites, totaling 90 MW, have secured land leases. Mashonaland West records micro-hydro pilot schemes along perennial rivers, though limited headwater height constrains economic scaling.
Manicaland's rural districts are the epicenter of solar mini-grid deployment because the costs of grid extension exceed USD 2,200 per household. Donor-funded schemes electrify clinics and 80 schools, increasing off-grid customer numbers to over 110,000 by 2025. Harare's metropolitan rooftops add 20 MW of net-metered PV as corporate tenants hedge against 12-hour load shedding. The Southern African Power Pool interconnectors at Hwange and Botswana's Maun substation promise an export optionality for 300 MW of planned solar power, provided that upgrade projects proceed on schedule.
Batoka Gorge's 2,400 MW hydropower project, located on the Zambezi River, straddles the Zambia border; feasibility revisions incorporate floating solar to stabilize generation during dry spells. The synergy exemplifies how cross-border cooperation can maximize river-basin output while moderating single-technology risk, reinforcing the regional importance of the Zimbabwe renewable energy market.
Regulatory Landscape
Zimbabwe’s renewable-energy framework is anchored by the Zimbabwe Energy Regulatory Authority (ZERA), which licenses electricity undertakings and regulates tariffs and technical requirements across the sector. Under ZERA’s licensing approach, commercial electricity generation activities above 100 kW require authorization, shaping the go-to-market path for C&I solar, mini-grids, and independent power producers (IPPs). Procurement differentiates across technologies, with feed-in tariffs used for smaller renewable technologies (including small hydro, biomass, and geothermal), while solar PV and CSP are directed toward competitive procurement. This supports a shift away from unsolicited bid-led capacity additions.
In 2026, the Ministry of Energy and Power Development advanced an energy-sector governance framework comprising eight regulatory instruments, including Solar Products and Installation and Own Consumption Undertakings Licensing. This move signals tighter product quality controls and clearer rules for self-generation. Parallel planning instruments also remain active, including the National Integrated Energy Resource Plan (NIERP), targeted for finalization by December 2025, which provides an additional reference point for project selection and system planning. Developers still manage process frictions such as approval timing tied to ZERA board cycles, while bankability tools referenced in government programs, including Government Project Support Agreements, reinforce standardized approaches for cost-reflective tariffs and currency convertibility where applied to IPP structures.
Competitive Landscape
State-owned Zimbabwe Power Company and Zimbabwe Electricity Transmission & Distribution Company still control generation and grid assets, but new entrants are accelerating. Twenty-seven of twenty-eight IPP submissions were approved, attracting players such as Masdar, Voltalia, and Scatec. CrossBoundary Energy’s acquisition of Caledonia’s PV asset typifies sale-and-leaseback financing that frees miners’ balance sheets. Distributed Power Africa deploys modular 100 kW to 5 MW rooftop systems under ESG-linked power purchase agreements, growing its installed base by 250% year-on-year.
Old Mutual’s fund, managed by CABS Asset Management, offers ten-year local-currency debt matched to solar cashflows, diversifying funding away from traditional multilateral loans. Cicada Solar leverages FEI senior debt to expand its warehouse roof portfolio to 35 MW across Harare and Bulawayo. Storage integrators such as SunSynk and Huawei FusionSolar bundle supervisory control and data acquisition systems, creating service wrap differentiation. The Renewable Energy Association of Zimbabwe now counts more than 30 member firms, a fivefold increase since 2022, indicating rapid ecosystem maturation.[4]Renewable Energy Association Zimbabwe, “Membership Directory,” reaz.co.zw
Technology, financing innovation, and local content compliance shape competitive position. Companies that localize racking fabrication and train installers under ZERA’s 40-hour certification rule secure tender preferences. Market leaders that couple generation with digital energy-management platforms are expanding their share among manufacturing clients, highlighting the data-driven future of the Zimbabwe renewable energy market.
Zimbabwe Renewable Energy Industry Leaders
Zimbabwe Power Company (ZPC)
Zimbabwe Electricity Transmission & Distribution Co (ZETDC – grid-tied solar IPP PPAs)
Zimbabwe Electricity Transmission & Distribution Co (ZETDC – grid-tied solar IPP PPAs)
Nyangani Renewable Energy
Solgas Energy
- *Disclaimer: Major Players sorted in no particular order

Market Opportunities and Future Outlook
Near-term opportunity centers on firm solar buildout across utility, mining, and corporate self-generation, supported by ongoing IPP contracting and specific project activity. In June 2026, ZimGreenCo and Dolcin Trading signed a 25-year PPA for a 50 MW solar plant near Chegutu, with wheeling through the ZETDC grid. Around the same time, the Vungu Solar project secured a 25-year PPA with ZETDC for 30 MW, reinforcing the commercial case for long-tenor contracting in grid-tied PV.
The private-sector pipeline also includes large behind-the-meter programs. Zimplats completed the 35 MW first phase of its 185 MW solar program and started construction on the 45 MW second phase in July 2026, while Econet began construction on a first phase toward a 100 MW solar-plus-storage target in July 2026. Policy and planning initiatives also widen space for distributed generation, net metering, and efficiency-led demand reduction, including a stated target of 100 MW of net-metered capacity by 2025. Mission 300-aligned Energy Compact planning sets renewable-capacity milestones toward 2030, which keeps demand on compliant solar products and certified installers, along with integration services such as storage and controls as the 2026 regulatory instruments tighten solar product and installation requirements. A parallel investment lane is also emerging around flagship concepts such as a Lake Kariba floating solar project (500 MW) under development, pointing to additional need for engineering, grid-connection, and financing structures shaped by hydrology-linked generation volatility and constrained transmission capacity.
Recent Industry Developments
- June 2026: ZimGreenCo and Dolcin Trading signed a 25-year power purchase agreement for a 50 MW solar plant near Chegutu. The contract includes wheeling through the ZETDC national grid, supporting third-party power sales to industrial and large commercial consumers.
- April 2025: Caledonia Mining closed the USD 22.35 million divestiture of its 12.2 MW solar plant to CrossBoundary Energy while retaining long-term offtake rights. The transaction reinforced sale-and-leaseback style structures as an investable pathway for mine-site solar and specialist energy-service ownership in Zimbabwe.
- September 2024: Old Mutual Zimbabwe launched a USD 100 million blended renewable energy fund targeting solar and hydro projects. The fund expanded structured capital options for developers and supported broader movement toward de-risked financing mechanisms in the country’s renewable buildout.


Research Methodology Framework and Report Scope
Market Definition and Coverage
We define this market as Zimbabwe's renewable power capacity that is installed and grid-connected, or deployed behind the meter, counted in MW/GW across renewable technologies and user types.
Scope exclusions: We exclude fossil-based generation, transmission and distribution network spending, and pure fuel supply chains that do not add renewable generation capacity.
Segmentation Overview
- By Technology
- Solar Energy (PV and CSP)
- Wind Energy (Onshore and Offshore)
- Hydropower (Small, Large, PSH)
- Bioenergy
- Geothermal
- Ocean Energy (Tidal and Wave)
- By End-User
- Utilities
- Commercial and Industrial
- Residential
Data Sources, Market Sizing, and Validation
Desk Research
Desk work starts by mapping Zimbabwe's renewable power system and the rules that shape what can be built and connected. We leaned on public energy statistics and system planning documents such as those from the International Renewable Energy Agency (IRENA), the International Energy Agency (IEA), the World Bank, and the African Development Bank, along with national policy and regulatory publications where available.
From these sources, we extract inputs like installed capacity by technology, electricity generation trends, grid access and electrification indicators, and the direction of renewable targets and permitting. We then complement this with investor materials, annual reports, and project announcements to validate timelines and commissioning signals. Select paid subscriptions for company financials and news intelligence were also used to confirm ownership structures and cross-check project status. The desk research sources listed here are illustrative, and we reviewed many other public and paid references to collect data, validate assumptions, and clarify gaps.
Primary Interviews and Surveys
Our Zimbabwe interviews and surveys cover CXOs, functional or unit leaders, and managers involved in generation, project development, regulation, equipment supply, and energy use within the country. Their responses test secondary figures, clarify delayed projects and off-grid activity, fill data gaps, and help validate the final assumptions and forecast view.
Distribution of primary research fieldwork respondents
| Company type | Respondent position |
|---|---|
| Top tier: 25% | CXOs: 18% |
| Mid tier: 52% | Functional/Unit leaders: 30% |
| Smaller Players: 23% | Managers: 52% |
Market-Sizing & Forecasting
Sizing is anchored on installed renewable capacity in Zimbabwe because it is the most consistently trackable signal across technologies. We first rebuild the current stock using technology-level capacity series, then apply a top-down approach where planned additions, retirements, and commissioning schedules extend the capacity base year by year.
To keep the numbers realistic, we check results with selective bottom-up approximations, such as rolling up visible utility-scale projects, sampling solar rooftop additions by typical system size ranges, and running supplier and installer channel checks for volume direction. Where project data is incomplete, we apply conservative completion factors and shift portions of the pipeline across years based on observed delay patterns.
Key inputs used in the model include the installed base by technology (solar, hydro, bioenergy, and others), annual capacity additions, grid connection readiness, typical capacity factors used by stakeholders to sanity-check build relevance, and the pace of commercial and industrial and residential uptake. Forecasting uses scenario analysis to reflect policy execution risk, FX and import availability, and grid absorption constraints, and then the selected scenario is aligned with expert consensus from interviews so the curve does not overreact to one-off announcements.
Data Validation & Update Cycle
Outputs are validated through cross-checks against independent signals, including capacity series reconciliation, project commissioning evidence, and consistency with broader electricity demand and access indicators. If a result looks off, we revisit the assumption that caused the jump, rerun the sensitivity, and re-contact sources when a key project or policy item creates a material mismatch.
Before sign-off, the model goes through a step-by-step analyst review so definitions, units, and year mapping remain consistent. Reports are refreshed annually, and we also push interim updates when material events occur, such as major project financial close, cancellations, or regulatory changes. Right before delivery, an analyst performs a fresh pass to ensure the latest public releases and field feedback are reflected.
Mordor Intelligence's Zimbabwe Renewable Energy Market Size Compared Against Other Published Estimates
Published market values can look different because the unit of measurement, what is counted as renewable, and how pipeline is treated are not consistent across sources. Some estimates report investment value, some report generation, and others mix announced projects with commissioned capacity, which changes the base year total.
The spread usually comes from three practical choices: whether off-grid systems are included, whether hybrid plants are split by technology, and whether capacity is counted at announcement, financial close, or commissioning. Currency timing can also distort value-based comparisons, which is why capacity-based views still require careful checks on project status and timing.
Benchmark comparison
| Source | Market Size | Gaps in Research Methodology |
|---|---|---|
| Mordor Intelligence | USD 1.41 B (2025) | |
| Industry Association A | USD 1.75 B (2025) | Often counts all announced and registered projects as added capacity, and it may also include diesel-solar hybrids as fully renewable capacity without adjusting for the renewable share. |
| Global Consultancy B | USD 1.10 B (2025) | Commonly limits the count to grid-connected utility projects only, and it may use conservative commissioning assumptions that push a portion of near-term pipeline beyond the stated year. |
The table shows a wide band for the same year. In Mordor Intelligence's model, installed renewable capacity is counted only when it is operational (or credibly commissioned within the year) and then kept consistent across hydro, solar, bioenergy, and other renewables. With that rule applied, the estimate stays traceable to real capacity adds and avoids inflating totals with early-stage pipeline or deflating totals by ignoring behind-the-meter systems.


Key Questions Answered in the Report
How large is the clean-power capacity in Zimbabwe in 2026?
Installed renewable capacity stands at 1,680 MW in 2026.
How much renewable capacity is Zimbabwe projected to reach by 2031?
The figure is forecast to rise to 3,980 MW, reflecting a 18.86% CAGR.
Which technology is expanding the fastest in Zimbabwe’s clean-energy mix?
Solar PV leads with a projected 47.20% CAGR through 2031.
Why are mining companies turning to captive solar plants?
Chronic grid blackouts and stepped tariffs raise operating costs, so captive solar cuts power expenses and improves supply reliability.
What financing approaches dominate new renewable projects?
Blended-finance structures and sale-and-leaseback deals pair development-bank capital with long-term USD-denominated PPAs.
How does currency volatility influence investor decisions?
ZiG depreciation inflates import costs and complicates tariff structures, prompting developers to hedge using USD-linked contracts and reserve accounts.
Page last updated on:


 Your data is secure and never sold or shared.


