
Zero Trust Security Market Size and Share
Market Overview
| Study Period | 2020 - 2031 |
|---|---|
| Market Size (2026) | USD 48.43 Billion |
| Market Size (2031) | USD 102.01 Billion |
| Growth Rate (2026 - 2031) | 16.07 % |
| Fastest Growing Market | Asia Pacific |
| Largest Market | North America |
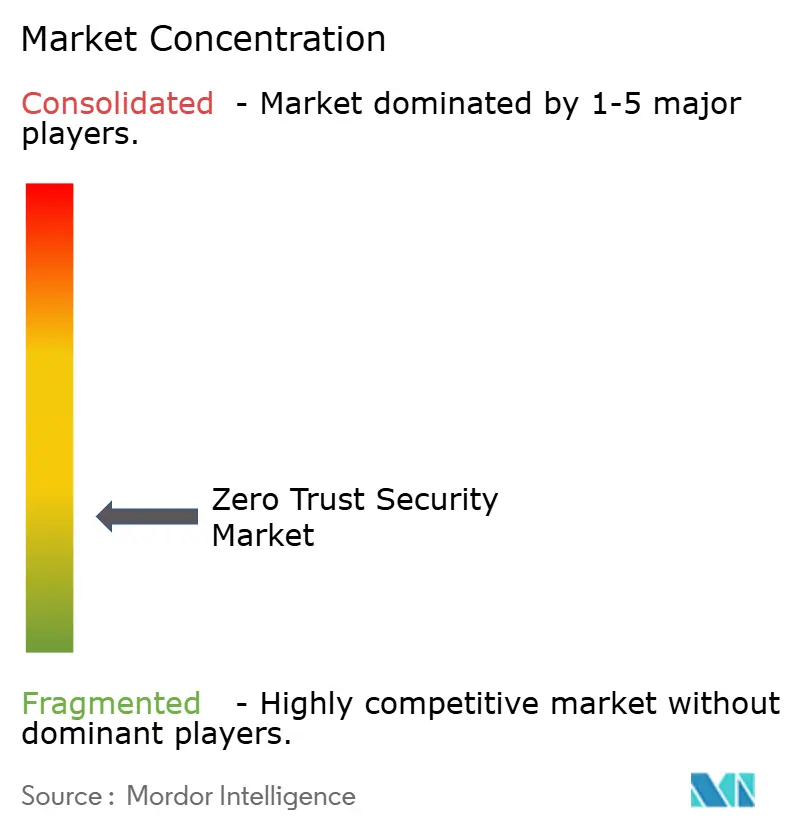
| Market Concentration | Low |
Major Players *Disclaimer: Major Players sorted in no particular order Image © Mordor Intelligence. Reuse requires attribution under CC BY 4.0. | |
Zero Trust Security Market Analysis by Mordor Intelligence
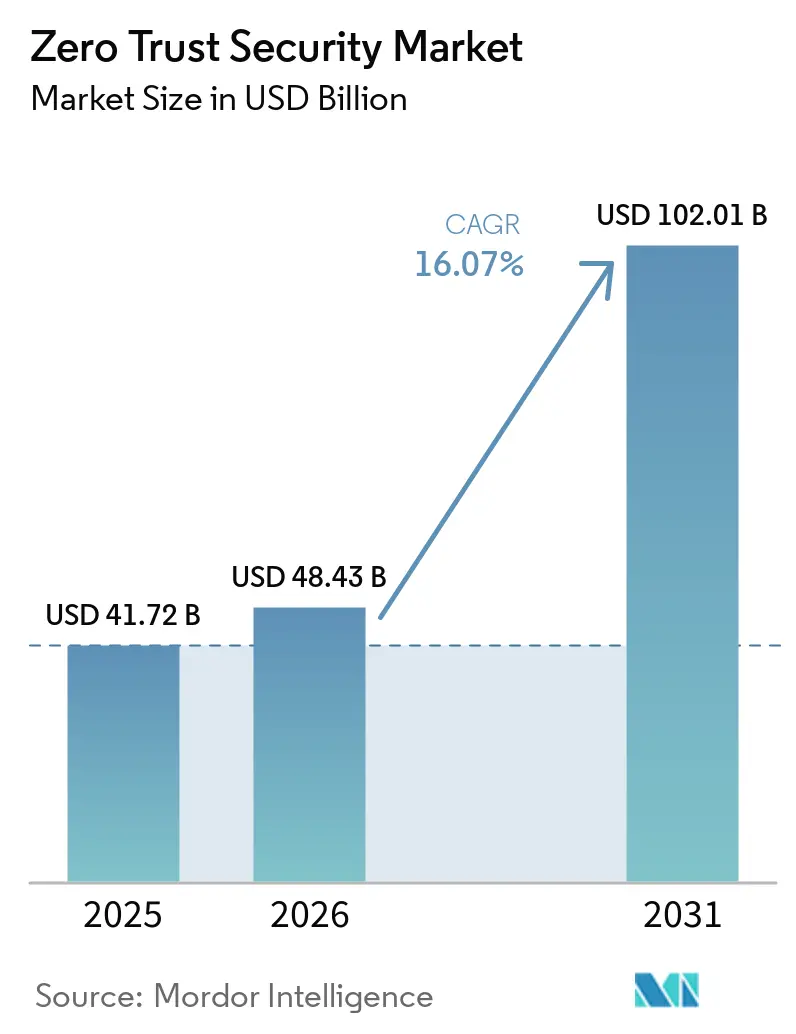
The Zero Trust Security market size is expected to grow from USD 41.72 billion in 2025 to USD 48.43 billion in 2026 and is forecast to reach USD 102.01 billion by 2031 at 16.07% CAGR over 2026-2031. Remote work permanence, cloud-native architectures, and escalating breach costs push organizations away from perimeter-centric defenses toward continuous verification models that harden every asset. Regulatory mandates—from the 2021 United States executive order to evolving data-protection rules in Europe and Asia—continue to codify zero trust requirements. Enterprises also confront a surge in machine-to-machine traffic that exposes unsecured APIs, while ransomware incidents now touch virtually every industry segment. Vendors respond by embedding identity, network, and endpoint controls into unified cloud platforms, driving a steady shift from product sales to outcome-based service engagements.
Key Report Takeaways
- By offering, Solutions led with 66.55% revenue share in 2025, yet Services are forecast to advance at a 19.05% CAGR through 2031.
- By deployment mode, On-premise held 53.85% of the zero trust security market share in 2025, while Cloud deployments are expanding at a 19.66% CAGR to 2031.
- By organization size, Large enterprises accounted for 59.62% of spending in 2025; small and medium-sized enterprises (SMEs) are poised to grow at an 18.02% CAGR.
- By authentication type, Single-factor methods retained a 53.64% share in 2025 as multi-factor options increase at a 19.78% CAGR.
- By end-user industry, Banking, financial services, and insurance (BFSI) captured 23.12% share in 2025, whereas Healthcare shows the fastest trajectory at an 18.21% CAGR.
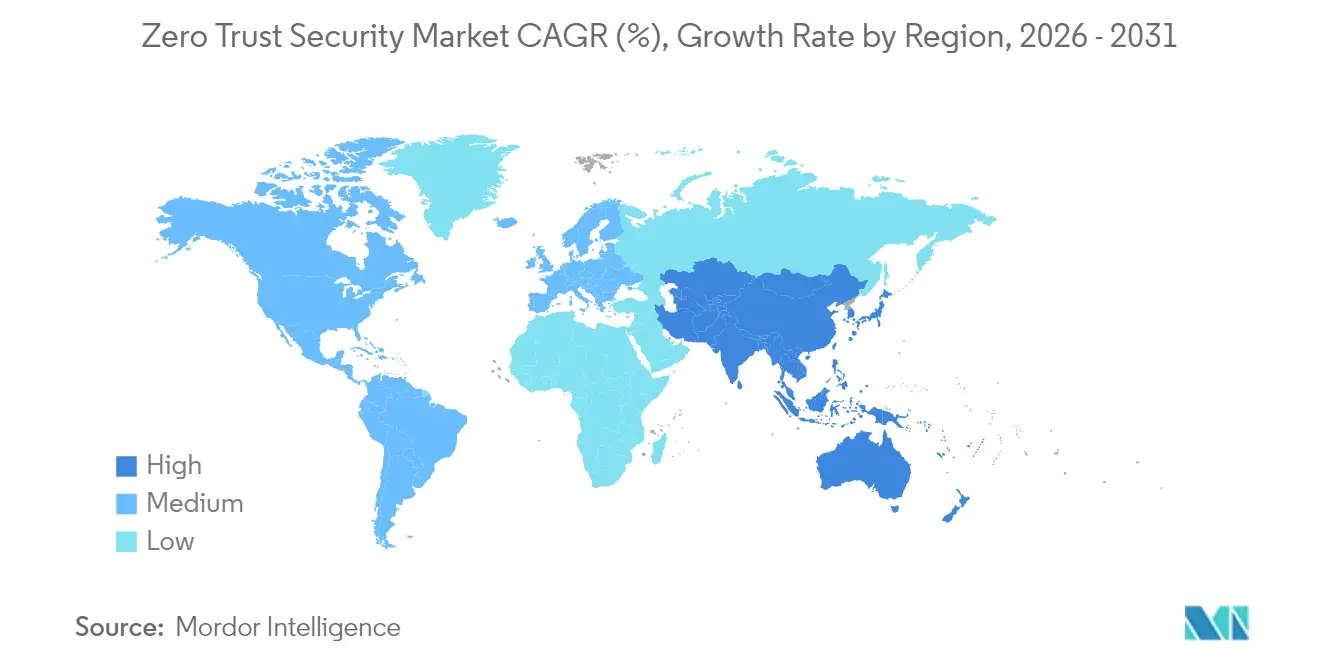
- By geography, North America contributed 34.72% of 2025 revenue, yet Asia-Pacific is projected to climb at a 18.63% CAGR through 2031.
Note: Market size and forecast figures in this report are generated using Mordor Intelligence’s proprietary estimation framework, updated with the latest available data and insights as of 2026.
Market Trends and Insights
Drivers Impact Analysis of Zero Trust Security Market*
| Driver | (~) % Impact on CAGR Forecast | Geographic Relevance | Impact Timeline |
|---|---|---|---|
| Increasing number of data breaches | +3.2% | Global, with concentration in North America and Europe | Short term (≤ 2 years) |
| Expansion of remote/hybrid workforces | +2.8% | Global, led by North America and Europe | Medium term (2-4 years) |
| Rising regulatory mandates | +2.1% | North America and EU primary, APAC emerging | Long term (≥ 4 years) |
| Explosion of machine & API traffic | +1.9% | Global, concentrated in cloud-native regions | Medium term (2-4 years) |
| Smart-NIC micro-segmentation | +1.4% | North America and APAC core markets | Long term (≥ 4 years) |
| Identity-network convergence | +1.6% | Global, with early adoption in enterprise segments | Medium term (2-4 years) |
| Source: Mordor Intelligence | |||
Increasing number of data breaches
Zero-day vulnerabilities tripled in 2024, and ransomware represented one-third of all breaches across 92% of industries. [1] Human factors contributed to 68% of incidents, pressing enterprises to adopt continuous verification that assumes internal compromise. Third-party weaknesses climbed 68%, forcing organizations to extend zero trust principles to suppliers. Insider threats cost financial institutions USD 16.2 million per event on average. Breach economics, therefore, favor preventative spending on zero trust controls over expensive post-incident remediation.
Expansion of remote/hybrid workforces
Permanent remote work invalidates VPN-centric access. Organizations that adopted zero trust architectures saw an 83% cut in incident-response times and an 80% drop in successful breaches. NTT DATA’s rollout connected 50,000 users in 30 days, proving cloud-delivered scalability. Remote Browser Isolation tools further protect distributed staff without hindering productivity, fueling sustained demand for zero-trust network access.
Rising regulatory mandates
The U.S. executive order obliges all federal agencies to transition to zero trust, spurring private-sector copycat programs. PCI DSS updates in finance and HIPAA refinements in healthcare promote continuous verification over perimeter checks. Supply-chain security laws increasingly require vendors to prove zero trust compliance, favoring integrated platforms that simplify audit evidence.
Explosion of machine and API traffic
API calls now outnumber human web requests, exposing unattended endpoints. Platforms embed AI to profile real-time traffic and flag anomalies. Akamai’s 2024 acquisitions of Neosec and Noname Security underscored growing demand for API-centric defenses. [2] Manufacturers use zero-trust micro-segmentation to shield industrial IoT devices, maintaining uptime while limiting lateral movement.
Restraints Impact Analysis of Zero Trust Security Market*
| Restraint | (~) % Impact on CAGR Forecast | Geographic Relevance | Impact Timeline |
|---|---|---|---|
| Legacy integration hurdles | -2.1% | Global, more pronounced in established enterprises | Medium term (2-4 years) |
| High up-front architecture cost | -1.8% | SME segments globally, emerging markets | Short term (≤ 2 years) |
| Shadow-IT SaaS bypass | -1.2% | North America & Europe primarily | Short term (≤ 2 years) |
| Supplier data-sharing clauses | -0.9% | Global, regulatory compliance regions | Long term (≥ 4 years) |
| Source: Mordor Intelligence | |||
Legacy integration hurdles
Decades-old applications often lack modern authentication hooks, forcing custom connectors that extend deployment schedules. Healthcare facilities struggle to retrofit network-enabled medical devices built without security in mind. [3] Manufacturers face similar constraints with operational technology, where uptime trumps security. Vendors that package pre-configured integrations ease friction and shorten project payback.
High up-front architecture cost
Comprehensive zero-trust programs require identity orchestration, network segmentation, and automated policy engines. Capital intensity can deter SMEs, even though a single breach routinely eclipses initial spending. Subscription-based cloud services mitigate capital hurdles, enabling pay-as-you-go adoption. Still, organizations must weigh deployment scope against resource limits, reinforcing the value of managed service offerings that bundle technology and expertise.
*Our forecasts treat driver/restraint impacts as directional, not additive. The impact forecasts reflect baseline growth, mix effects, and variable interactions.
Zero Trust Security Market Segment Analysis
By Offering:
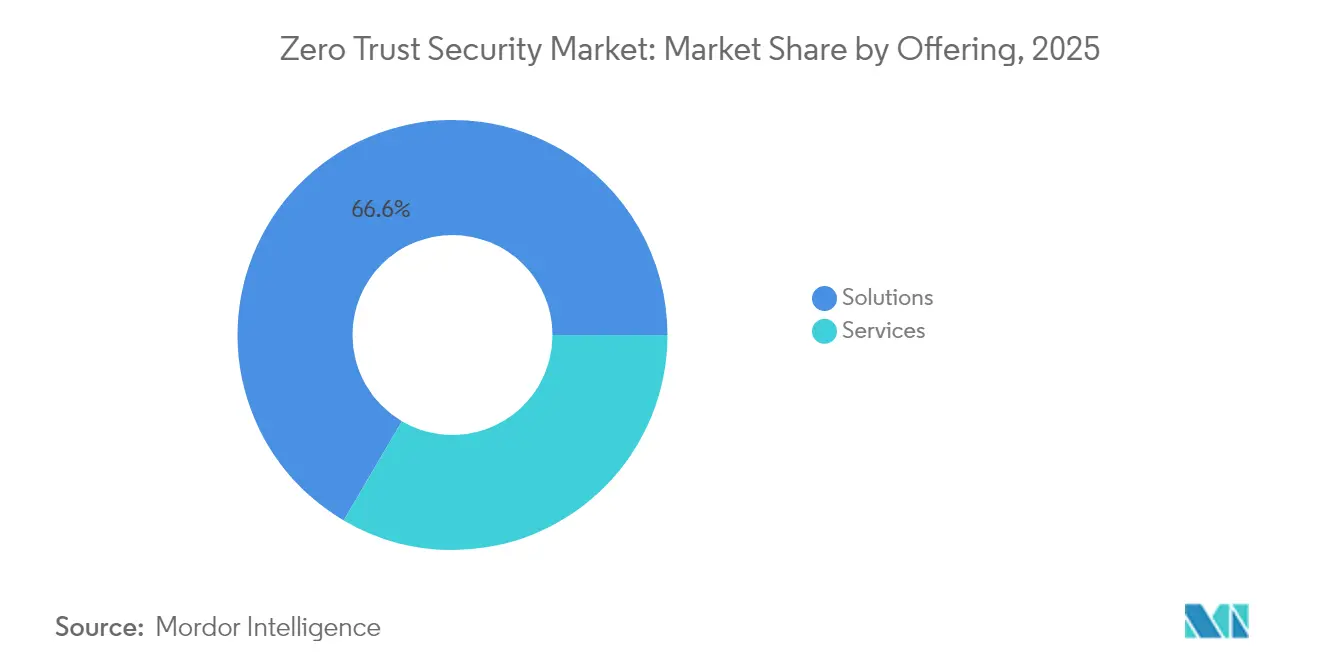
Services Surge Despite Solutions DominanceSolutions accounted for 66.55% of 2025 revenue, anchoring the zero trust security market through integrated policy engines and analytics dashboards. However, services are rising at a 19.05% CAGR as enterprises rely on partners to design, deploy, and fine-tune architectures across hybrid landscapes.
Professional services guide strategy, while managed offerings deliver continuous optimization without ballooning headcount. High-profile rollouts—such as Cimpress transforming global access controls—underline the organizational change management needed alongside technology shifts, explaining why the zero trust security market continues to pivot toward service-led value delivery.

By Deployment Mode:
Cloud Acceleration Challenges On-Premise DominanceOn-premise solutions preserved 53.85% of 2025 spending, reflecting regulated workloads that remain inside corporate data centers. Cloud deployments, growing at 19.66% CAGR, attract firms seeking instant scalability and simplified updates.
Hybrid patterns dominate: sensitive data stays on-site while SaaS gateways manage identity and policy logic. As compliance frameworks evolve to recognize cloud residency controls, the zero trust security market size attached to cloud models is expected to expand rapidly, narrowing the on-premise lead over the forecast period.
By Organisation Size:
SME Adoption Accelerates Despite Enterprise DominanceLarge enterprises captured 59.62% of outlays in 2025, leveraging budgets to build bespoke zero-trust blueprints. SMEs, advancing at an 18.02% CAGR, increasingly consume right-sized SaaS bundles that collapse identity, network, and endpoint security into a single pane.
Cost-distributed subscriptions flatten entry barriers, letting smaller firms enjoy enterprise-grade protection. Vendors that automate policy creation and furnish 24×7 SOC oversight resonate strongly with resource-constrained buyers, reinforcing growth momentum within this segment of the zero trust security market.
By Authentication Type:
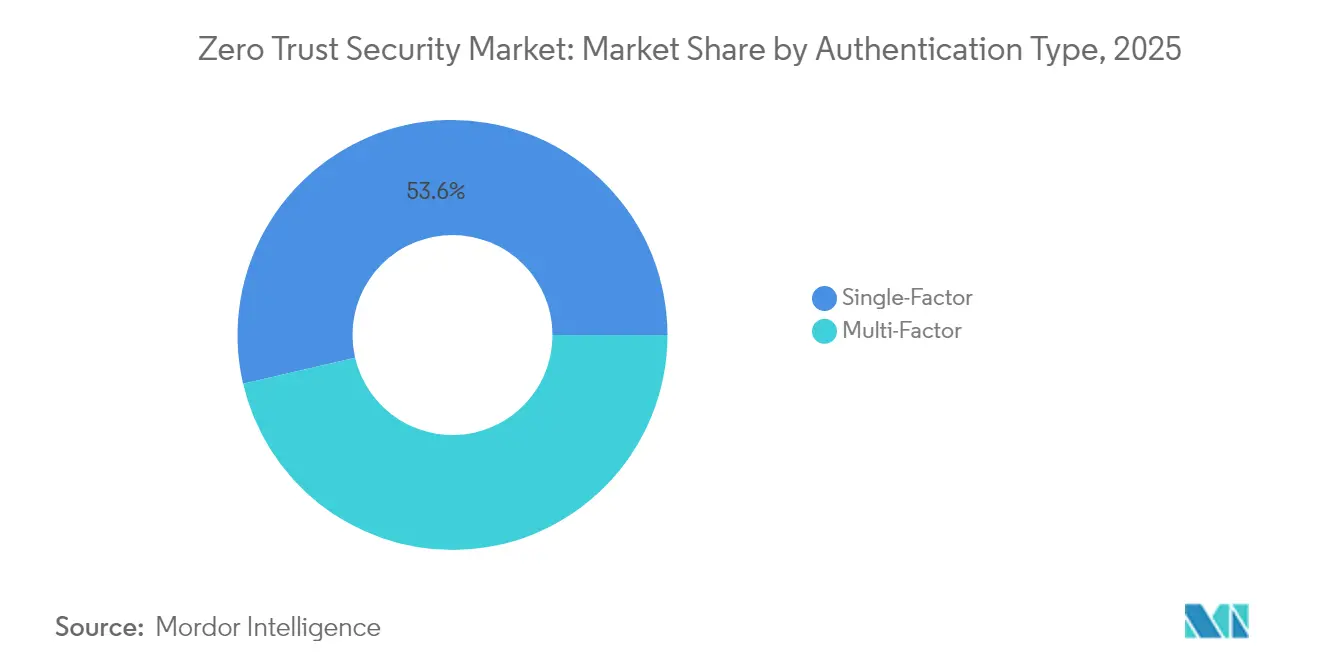
Multi-Factor Growth Challenges Single-Factor PersistenceSingle-factor approaches still hold a 53.64% share, a legacy of password-centric systems and user-experience fears. Multi-factor usage, expanding at 19.78% CAGR, gains traction as breach costs climb and regulators advocate layered checks.
Modern zero trust platforms weave biometrics, device fingerprinting, and behavior analytics to maintain frictionless experiences. This convergence is shrinking the password stronghold, indicating that the zero trust security market share of single-factor methods will erode steadily through 2031.
By End-user Industry:
Healthcare Acceleration Challenges BFSI LeadershipBFSI owned 23.12% of 2025 revenue thanks to early adoption and strict oversight. Healthcare is pacing an 18.21% CAGR as ransomware targets patient data and life-critical systems.
Manufacturing, energy, and government follow, driven by operational technology exposure. Retail and e-commerce deploy zero trust to secure expanding digital storefronts. Cross-industry momentum confirms that zero trust has progressed from niche pilot to mainstream risk-management standard across the zero trust security industry.
Geography Analysis
North America Zero Trust Security Market
North America secured 34.72% of 2025 revenue through mature regulations, extensive cloud adoption, and vendor density. Federal mandates push agencies and contractors toward consistent architectures, while financial hubs in New York and Toronto showcase reference deployments that ripple across other verticals. Competitive pressure, however, is intensifying as newer cloud-native entrants challenge incumbents on price and automation.
APAC Zero Trust Security Market
Asia-Pacific commands the fastest CAGR at 18.63% to 2031. Governments from Singapore to Japan enact cybersecurity roadmaps that embed zero trust principles, letting firms leapfrog legacy firewalls in favor of cloud-delivered controls. Manufacturing clusters rely on micro-segmentation to protect converged IT/OT environments, further expanding the zero-trust security market in the region.
EMEA Zero Trust Security Market
Europe’s steady progression stems from GDPR and sector-specific directives that favor privacy-preserving architectures. Vendors that provide granular audit trails and EU-based data centers gain traction. Meanwhile, the Middle East and Africa register emerging potential as digital governments fund modernization, though adoption still lags due to limited local skill sets and infrastructure.
Regulatory Landscape
Zero trust has shifted from recommended practice to formal compliance and procurement gating across key jurisdictions. In the United States, Executive Order 14028 is operationalized through OMB Memorandum M-22-09, which sets federal zero trust objectives and has been reinforced via subsequent memos extending maturation through FY 2026. CISA also published its Zero Trust Architecture Implementation report (January 2025) to align agency progress with the federal maturity model.
In Europe, Directive (EU) 2022/2555 (NIS2) entered into force in January 2023 and required national transposition by October 17, 2024, which raised baseline risk-management controls tied to continuous authentication, access governance, and segmentation capabilities. In January 2026, the European Commission advanced a proposal (2026/0012(COD)) for targeted amendments impacting NIS2 and the EU Cybersecurity Act, signaling further standardization and added policy focus on long-term crypto-agility (including post-quantum considerations) that shapes identity, access, and trust architecture roadmaps.
Value Chain Analysis
The zero trust security value chain begins with standards and reference architectures that shape requirements and interoperability, then moves to core technology suppliers such as identity and access management, endpoint security, network security and segmentation, policy engines, analytics, and API security. Platform vendors package these capabilities as suites, and downstream, systems integrators, cloud service providers, and managed security service providers design and operate deployments for enterprises and public-sector buyers, typically distributed through cloud marketplaces, channel partners, and direct enterprise sales.
Implementation and assurance activities are increasingly influenced by government-authored guidance that reduces integration friction and de-risks procurement. NIST SP 1800-35 (June 2025) provides 19 example implementations aligned with NIST SP 800-207, while CISA guidance extends zero trust principles into operational technology environments (April 2026). Software supply-chain transparency is also becoming a visible dependency across the chain, supported by joint SBOM guidance released by CISA, NSA, and international partners (September 2025), which raises expectations for vendor attestations, dependency visibility, and audit-ready evidence across integrated zero trust stacks.
Competitive Landscape
The zero trust security market hosts a blend of platform giants and agile specialists. Palo Alto Networks, Cisco, and Fortinet layer identity, network, and endpoint controls into consolidated suites. Zscaler processes more than half a trillion daily transactions through its cloud-native Zero Trust Exchange, reinforcing scale advantages.
Strategic moves illustrate consolidation: Arista integrated zero-trust features into CloudVision for automated network segmentation. Akamai absorbed Neosec and Noname Security to fortify API protection. Veeam and Microsoft co-developed AI-powered resilience aligned with zero-trust tenets.
Innovation centers on AI-driven behavior scoring; Cloudflare’s recent patent for multi-domain application mapping exemplifies the focus on automated policy decisions. Emerging players such as Zero Networks advance automated micro-segmentation that installs in minutes, winning mindshare among resource-strained teams. [4] The competitive narrative, therefore, pivots on speed, automation, and breadth of ecosystem integrations rather than on standalone feature depth.
Zero Trust Security Industry Leaders
-
Palo Alto Networks Inc.
-
Cisco Systems Inc.
-
Zscaler Inc.
-
Okta Inc.
-
Fortinet Inc.
- *Disclaimer: Major Players sorted in no particular order
Zero Trust Security Market Companies Covered in this Report
- Palo Alto Networks Inc.
- Cisco Systems Inc.
- Zscaler Inc.
- Okta Inc.
- Fortinet Inc.
- CrowdStrike Holdings Inc.
- Check Point Software Tech.
- IBM Corporation
- Akamai Technologies Inc.
- Illumio Inc.
- Appgate Inc.
- Netskope Inc.
- Cloudflare Inc.
- Duo Security LLC
- BeyondTrust Corp.
- CyberArk Software Ltd.
- Ping Identity Corp.
- SailPoint Technologies
- One Identity LLC
- Banyan Security Inc.
- Zero Networks Ltd.
- Elisity Inc.
- Versa Networks Inc.
- Vectra AI Inc.
- Guardicore Ltd. (Cisco Networks)
Market Opportunities and Future Outlook
Public-sector programs are continuing to produce deployment runbooks that commercial buyers reuse, creating near-term demand for packaged implementations, managed services, and audit-evidence automation. The revised Federal Zero Trust Data Security Guide (CIO.gov, May 2025) and the Department of Defense Directive-Type Memorandum 25-003 (July 2025), which establishes a Zero Trust Portfolio Management Office and a Chief Zero Trust Officer role, also formalize cross-domain coordination and procurement alignment.
A second opportunity area centers on interoperability-led adoption. Buyers increasingly prefer architectures that map to accepted maturity models and reference builds rather than bespoke designs. NIST SP 1800-35 (June 2025) offers 19 commercially built example implementations with industry collaborators, and the National Security Agency published a Zero Trust Implementation Guidelines (ZIGs) Primer for National Security Systems (January 2026). Together, these anchors reinforce demand for modular, standards-aligned identity, segmentation, and policy enforcement, and they also surface adjacent needs such as continuous control validation, data-centric policy mapping, and operationalization for IT/OT environments, supported by CISA guidance on adapting zero trust principles to operational technology (April 2026).
Recent Industry Developments in Zero Trust Security Market
- July 2026: Palo Alto Networks announced general availability of Prisma AIRS AI Gateway. The update extends zero trust controls into AI usage by centralizing policy, inspection, and governance for AI interactions, moving platform roadmaps beyond users and devices toward agentic workflows.
- June 2026: Zscaler unveiled new product innovations to secure agentic AI, including capabilities such as an AI Access Graph and updates tied to its Zero Trust Exchange. This broadens zero trust from connectivity and access decisions into visibility and control for AI-driven data flows and identities across cloud applications and services.
- May 2025: Veeam and Microsoft expanded their collaboration to launch AI-enabled data-resilience services aligned with zero-trust principles. The announcement links zero trust access controls with recovery-oriented cyber resilience, supporting enterprise programs that pair continuous verification with hardened backup and restoration workflows.
Zero Trust Security Market Report Scope and Research Methodology
Market Definition and Coverage
For this study, the zero trust security market covers tools and services that enforce continuous verification before access is granted to users, devices, applications, and workloads across enterprise, cloud, and edge environments, with revenues counted in USD at the vendor selling level.
Scope exclusions: We exclude broad managed security service contracts where zero trust is only referenced as an add-on rather than a separately scoped deliverable.
Segments Covered in This Report
- By Offering
- Solutions
- Services
- By Deployment Mode
- On-premise
- Cloud
- By Organisation Size
- Small and Medium Enterprises (SMEs)
- Large Enterprises
- By Authentication Type
- Single-Factor
- Multi-Factor
- By End-user Industry
- IT and Telecom
- BFSI
- Manufacturing
- Healthcare
- Energy and Utilities
- Retail and E-commerce
- Government and Defense
- Other End-user Industries
- By Geography
- North America
- United States
- Canada
- Mexico
- South America
- Brazil
- Argentina
- Chile
- Rest of South America
- Europe
- Germany
- United Kingdom
- France
- Italy
- Spain
- Russia
- Rest of Europe
- Asia-Pacific
- China
- India
- Japan
- South Korea
- Australia
- Singapore
- Malaysia
- Rest of Asia-Pacific
- Middle East and Africa
- Middle East
- United Arab Emirates
- Saudi Arabia
- Turkey
- Rest of Middle East
- Africa
- South Africa
- Nigeria
- Rest of Africa
- Middle East
- North America
Data Sources, Market Sizing, and Validation
Desk Research
Desk research was used to set the demand context and anchor our assumptions in traceable public signals. We reviewed policy and standards publications and adoption guidance, such as NIST Zero Trust Architecture (SP 800-207), CISA zero trust maturity work, and similar national cybersecurity frameworks that shape buying behavior. We also referenced public spend and risk signals from sources such as the US Bureau of Economic Analysis (digital investment context), World Bank and OECD indicators (enterprise digitization), and ITU cybersecurity benchmarking.
To translate this context into a market model, we used company filings, earnings call transcripts, investor decks, and product documentation to understand how zero trust revenues are recognized and bundled. Patent databases were used selectively to map innovation activity around identity, policy engines, and micro-segmentation, which helped in stress testing product scope. A news and financials subscription and a company financials and intelligence subscription were also used for faster cross checks on corporate actions and segment notes. These desk research sources are illustrative, and many other public references were used for data collection, validation, and clarification.
Primary Interviews and Surveys
Primary work was used to validate what is really purchased under zero trust programs and what is simply labeled that way in marketing. We spoke with buyers and implementers across large enterprises and mid-sized organizations, and also with channel partners and solution specialists who see deal structure and renewal behavior across regions. For a global view, checks were spread across major geographies so our assumptions on adoption timing, pricing pressure, and cloud versus on-premises mix could be adjusted.
Distribution of primary research fieldwork respondents
| Company type | Respondent position | Region |
|---|---|---|
| Top tier: 30% | CXOs: 15% | APAC: 47% |
| Mid tier: 48% | Functional/Unit leaders: 26% | EMEA: 30% |
| Smaller Players: 22% | Managers: 59% | Americas: 23% |
Market-Sizing & Forecasting
Sizing was built using a top-down approach where enterprise security spend pools were reconstructed by region, and then filtered using zero trust adoption rates and spend intensity tied to access, identity, and segmentation control layers. To keep the totals realistic, the model was corroborated through selective bottom-up approximations, such as sampled vendor revenue disclosures, channel mix checks, and simple ASP times volume math for major modules, which were then used to adjust shares where gaps appeared.
A few practical inputs were treated as key levers, since they move the numbers the most. These included the pace of zero trust program rollouts in regulated sectors, cloud migration intensity (which shifts demand toward policy and identity layers), ZTNA and micro-segmentation deployment patterns, average contract duration and renewal rates, and pricing movement between bundled platforms and point products. Where a vendor did not break out revenues cleanly, we handled the gap by mapping product scope to the closest disclosed security category and applying interview-based allocation ratios that were checked again against regional shipment and booking commentary.
For forecasting, scenario analysis was used because buyer spending can swing with breach cycles and budget tightening, and the inputs can be updated quickly when new signals appear. Growth rates were then moderated using a short ARIMA check on recent revenue trend direction for relevant security subcategories, which kept the path from drifting too far from observed momentum.
Data Validation & Update Cycle
Outputs were validated through triangulation across independent signals, including regional enterprise IT spend direction, security budget sentiment shared in interviews, and the implied revenue capacity of major product categories. Outliers were flagged when growth or share shifts could not be explained by adoption timing, pricing, or procurement mix, and those points were reworked before sign-off. Before numbers were finalized, at least one additional analyst review was completed to challenge assumptions, recalculate key steps, and ensure the logic is repeatable.
Reports are refreshed annually, and interim updates are triggered when material events occur, such as major policy changes, large platform acquisitions, or sharp shifts in cloud security spending. Right before delivery, a fresh pass is completed so clients receive the most current view possible using the latest available disclosures and interview checks.
Mordor Intelligence's Zero Trust Security Market Size Compared With Other Published Estimates
Published market values for zero trust security can look far apart because each publisher draws the line around different product bundles and then uses different timing for currency and revenue recognition. Differences also show up when one estimate leans more on vendor messaging, while another relies on buyer-side signals about what is actually being deployed and paid for.
The biggest gap driver in this market is scope, especially whether broad managed security services, adjacent SASE spending, or general IAM suites are fully counted even when zero trust is not a separately priced module. Results also move when adoption rates are assumed to jump faster than implementation capacity allows, and when pricing is projected without checking how platform bundling is compressing standalone module ASPs. The spread you see below is mainly explained by excluding MSSP contracts where zero trust is only mentioned as a feature, a rule applied consistently in the model used by Mordor Intelligence.
Benchmark comparison
| Source | Market Size | Gaps in Research Methodology |
|---|---|---|
| Mordor Intelligence | USD 48.43 B (2026) | |
| Global Consultancy A | USD 36.50 B (2024) | Uses an earlier base year and narrower module coverage, with several identity and policy layers treated as part of broader IAM rather than zero trust specific revenue, which reduces the total. |
| Industry Data Firm B | USD 42.91 B (2025) | Blends adjacent security platform revenue into the total and applies more aggressive adoption uplift assumptions, while giving limited clarity on how bundled contracts are split across modules. |
When these estimates are lined up, it becomes clear that the main differences come from what is counted as zero trust revenue and how bundles are allocated across products and services. Our approach keeps the total tied to verifiable module scope and practical deployment pacing, which makes the number easier to reconcile with disclosures and buyer checks over time.
Key Questions Answered in the Report
What is the current value of the zero trust security market?
The zero trust security market size is valued at USD 48.43 billion in 2026.
How fast is the zero trust security market expected to grow?
It is forecast to expand at a 16.07% CAGR, reaching USD 102.01 billion by 2031.
Which segment of the market is growing the quickest?
Cloud deployments are advancing at a 19.66% CAGR as organizations migrate security control planes to SaaS models.
Why are services gaining traction within zero trust programs?
Complex strategy, integration, and continuous optimization requirements push enterprises to rely on professional and managed services, which are growing at a 19.05% CAGR.
Which region shows the highest growth rate?
Asia-Pacific exhibits the fastest expected CAGR at 18.63%, driven by digital-transformation initiatives and supportive regulatory actions.
What primary factor drives zero trust adoption?
Rising data-breach volumes and associated costs compel firms to replace perimeter defenses with continuous verification frameworks.