
Zero Liquid Discharge (ZLD) Systems Market Size and Share
Market Overview
| Study Period | 2021 - 2031 |
|---|---|
| Market Size (2026) | USD 8.01 Billion |
| Market Size (2031) | USD 11.96 Billion |
| Growth Rate (2026 - 2031) | 8.34 % |
| Fastest Growing Market | Asia Pacific |
| Largest Market | Asia Pacific |
| Market Concentration | Medium |
Major Players *Disclaimer: Major Players sorted in no particular order Image © Mordor Intelligence. Reuse requires attribution under CC BY 4.0. | |
Zero Liquid Discharge (ZLD) Systems Market Analysis by Mordor Intelligence
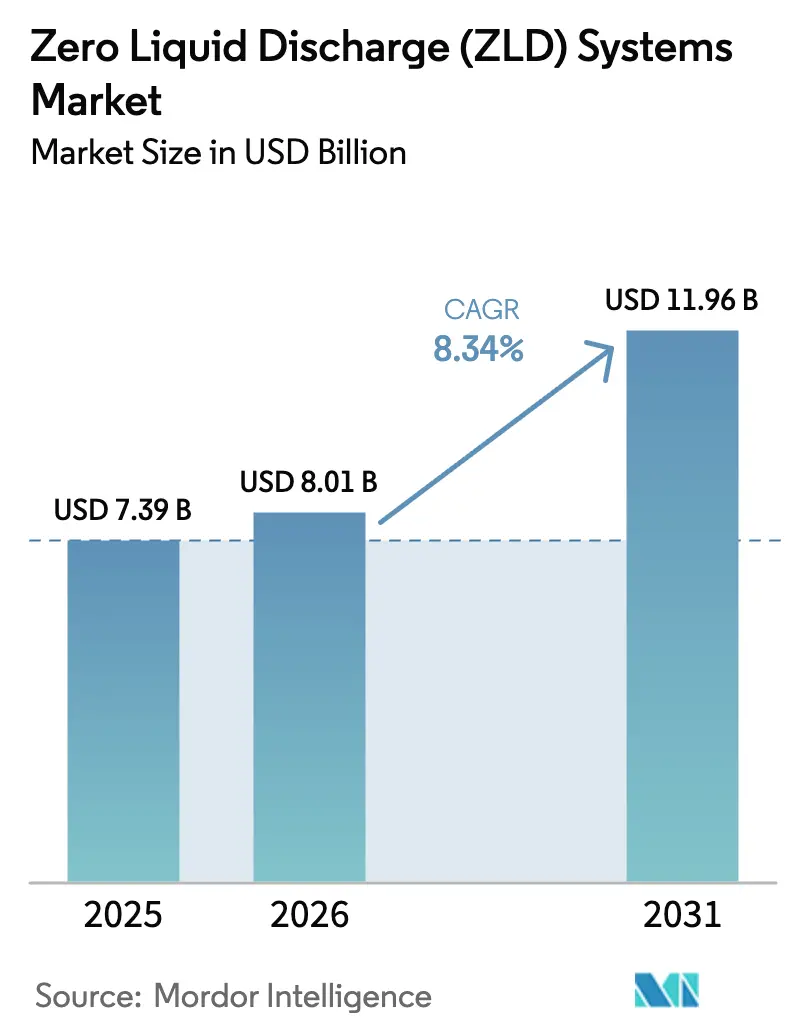
The Zero Liquid Discharge Systems Market size is expected to grow from USD 7.39 billion in 2025 to USD 8.01 billion in 2026 and is forecast to reach USD 11.96 billion by 2031 at 8.34% CAGR over 2026-2031. Rapid industrial growth in the Asia–Pacific, semiconductor water-reuse targets in East Asia, and upstream produced-water directives in the Middle East are amplifying demand, while hybrid membrane-thermal configurations are emerging as the preferred architecture where electricity costs are high. Competitive dynamics remain fluid: the top five vendors hold about 45% share, yet no single supplier exceeds 15%, creating scope for regional specialists that offer modular, rapid-deployment packages. At the same time, digital twins and remote monitoring are lowering the operations-and-maintenance expertise threshold, reducing downtime and improving levelized water costs. Although high capital outlay and energy use still restrain adoption - pushing levelized water costs above USD 5 per cubic meter in thermal-heavy plants - declining renewable-electricity prices are narrowing the gap with conventional treatment-plus-discharge.
Key Report Takeaways
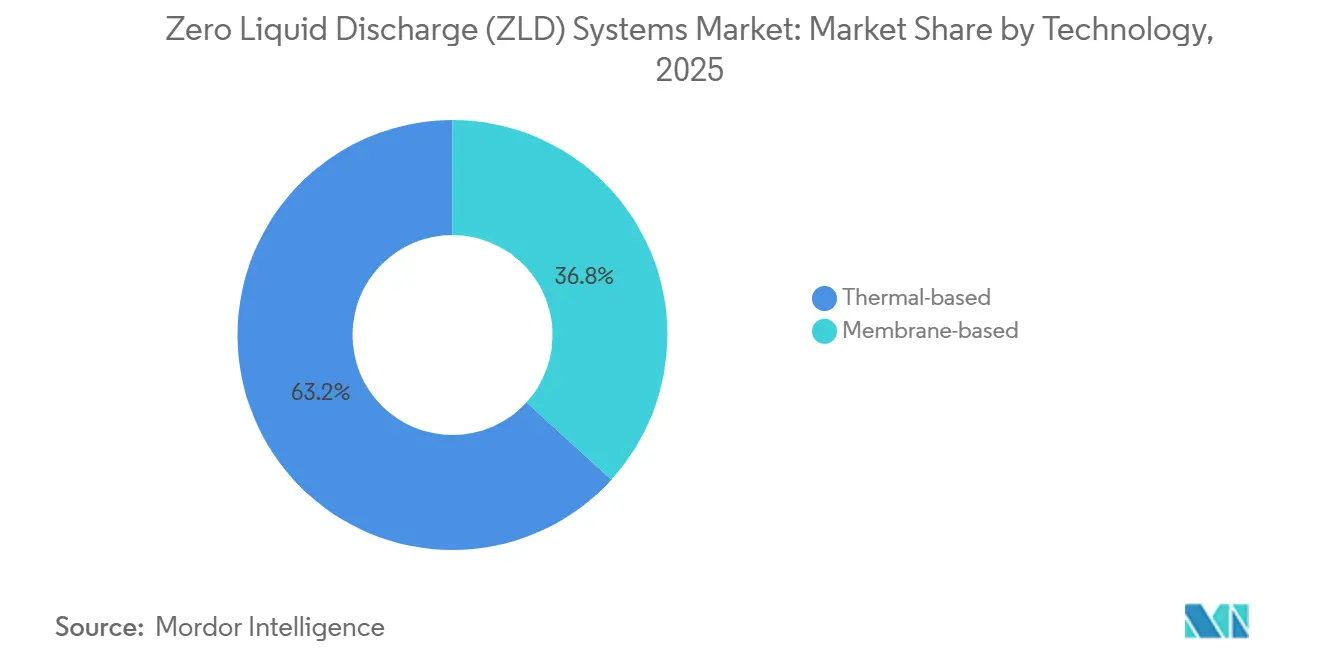
- By technology, thermal-based systems led with 63.24% revenue share in 2025; membrane-based configurations are forecast to expand at a 9.12% CAGR through 2031.
- By process phase, evaporation and crystallization accounted for a 49.48% share of the Zero Liquid Discharge systems market size in 2025, while pretreatment is advancing at a 9.35% CAGR to 2031.
- By end-user industry, power generation held 37.89% of the Zero Liquid Discharge systems market share in 2025, and it also records the highest projected CAGR at 9.42% through 2031.
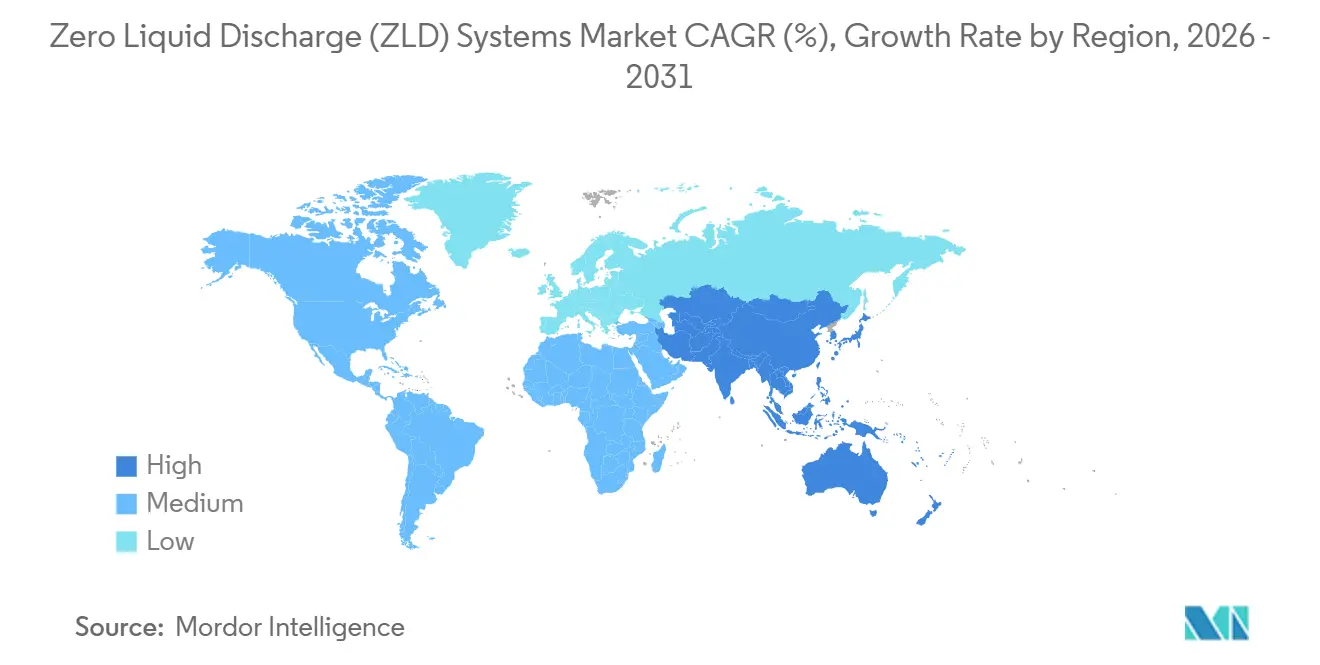
- By geography, Asia–Pacific commanded 32.67% revenue share in 2025 and is set to grow at a 9.69% CAGR to 2031.
Note: Market size and forecast figures in this report are generated using Mordor Intelligence’s proprietary estimation framework, updated with the latest available data and insights as of January 2026.
Market Trends and Insights
Drivers Impact Analysis of Zero Liquid Discharge (ZLD) Systems Market*
| Drivers | (~)% Impact on CAGR Forecast | Geographic Relevance | Impact Timeline |
|---|---|---|---|
| Growing demand for freshwater in water-stressed regions | +2.3% | APAC, Middle East, Southern Europe | Medium term (2–4 years) |
| Semiconductor-grade brine-treat recycling targets | +1.5% | Taiwan, South Korea, Japan, United States | Long term (≥ 4 years) |
| Upstream produced-water reuse mandates in the Middle East | +1.2% | Saudi Arabia, UAE, Kuwait | Short term (≤ 2 years) |
| Tightening zero-effluent regulations in OECD and BRICS | +2.1% | Global, led by EU and China | Medium term (2–4 years) |
| Expansion of water-intensive process industries | +1.8% | India, China, Bangladesh, Vietnam | Long term (≥ 4 years) |
| Source: Mordor Intelligence | |||
Growing Demand for Freshwater in Water-Stressed Regions
Industrial withdrawals equal 19% of global freshwater use, but in basins such as the Indus, Yellow, and Murray–Darling, the share surpasses 40%, putting factories in direct competition with farms and cities[1]. Governments are responding with volumetric caps and escalating abstraction fees, making closed-loop systems financially attractive. India’s 2023 National Water Policy obliges thermal power stations in water-scarce zones to recycle 90% of process water by 2030, implicitly mandating ZLD for cooling-tower purge and flue-gas desulfurization blowdown[2]. China’s Yangtze River Protection Law, tightened in 2024, bans new industrial discharges within 1 km of the river, pushing chemical parks toward membrane-thermal hybrids that cut steam demand by 60% compared with multi-effect evaporators. Hybrid ZLD designs that pair brine concentrators with mechanical vapor recompression crystallizers are therefore scaling fastest in water-short provinces. These configurations lower operating costs, raise water-recycling ratios, and secure plant permits, reinforcing demand for the Zero Liquid Discharge systems market across Asia–Pacific.
Semiconductor-Grade Brine-Treat Recycling Targets
Fabrication plants consume 2,000–4,000 L of ultrapure water per wafer, creating high-salinity reject streams rich in fluoride, ammonia, and silica. TSMC already recycles 92% of process water at its Hsinchu and Tainan fabs and has set a 98% target for 2028, requiring advanced ZLD pilots. South Korea introduced a semiconductor effluent limit of 500 mg/L total dissolved solids in 2025, effectively mandating brine concentration for new fabs. Intel’s Ocotillo complex in Arizona has demonstrated a forward-osmosis pretreatment that reduces reverse-osmosis energy usage by 30%, enabling cost-effective ZLD even at electricity tariffs of USD 0.08/kWh. Together, these actions anchor ZLD as a condition for fab permitting, strengthen local community support, and widen the addressable Zero Liquid Discharge systems market for high-tech manufacturing corridors.
Upstream Produced-Water Reuse Mandates in the Middle East
Saudi Arabia now requires oil producers to reuse or reinject 85% of produced water by 2027, up from 65% in 2023. Reservoir brines often exceed 150,000 mg/L total dissolved solids, necessitating thermal evaporation or high-recovery RO followed by crystallization. ADNOC awarded a USD 180 million contract in 2025 for modular ZLD units at five onshore fields, targeting zero discharge by 2029 and recovering salts for resale. Kuwait Oil Company is piloting solar-driven membrane distillation to offset the energy burden of thermal processes, leveraging intense insolation to lower operating costs. As mandates spread across Gulf Cooperation Council states, demand is shifting toward skid-mounted packages that can be relocated between wells, opening a fresh niche in the Zero Liquid Discharge systems market.
Tightening Zero-Effluent Regulations in OECD and BRICS
The EU Industrial Emissions Directive, revised in December 2024, lists ZLD as the reference technique for brine management in water-scarce member states. Germany’s Federal Environment Agency mirrored this stance in February 2025, guiding new chemical parks along the Rhine-Main and Ruhr toward ZLD adoption. China expanded its zero-discharge zone list in July 2025 to 47 industrial clusters in the Yellow River basin, enforcing compliance by 2028. Brazil tightened dissolved-solids limits for the São Francisco River basin in 2024, making conventional biological treatment obsolete for salinity control. Harmonization of discharge rules raises the compliance baseline worldwide, removing siting advantages that once favored lax jurisdictions and propelling the Zero Liquid Discharge systems market in developed and emerging regions alike.
Restraints Impact Analysis of Zero Liquid Discharge (ZLD) Systems Market*
| Restraints | (~)% Impact on CAGR Forecast | Geographic Relevance | Impact Timeline |
|---|---|---|---|
| High CAPEX and energy intensity of ZLD configurations | -1.4% | Global, acute in Sub-Saharan Africa and Latin America | Medium term (2–4 years) |
| Scarcity of skilled operations and maintenance personnel | -0.9% | APAC emerging markets, Middle East | Short term (≤ 2 years) |
| Limited fiscal incentives for water-circularity projects | -1.0% | Global | Medium term (2–4 years) |
| Source: Mordor Intelligence | |||
High CAPEX and Energy Intensity of ZLD Configurations
A 1,000 m³/day plant costs USD 8–15 million to build and consumes 50–80 kWh/m3, translating to USD 4–6/m3 operating costs at typical tariffs. Where electricity exceeds USD 0.10/kWh, and water tariffs sit below USD 1/m3 - as in South Africa - the ZLD payback stretches beyond 15 years, deterring investment unless regulators compel compliance. Argentina’s textile and tanning clusters face similar economics, with 2024 industrial water averaging USD 0.80/m3, far below ZLD break-even levels. Mechanical vapor recompression and hybrid membrane-thermal systems can cut energy consumption by 50%, but steep upfront premiums and sensitivity to fouling limit uptake to well-capitalized users. Consequently, financing hurdles remain a drag on the Zero Liquid Discharge systems market.
Scarcity of Skilled Operations and Maintenance Personnel
ZLD plants require tight control of scaling, antiscalant dosing, and crystallizer performance; yet 62% of operators in India, Indonesia, and Vietnam report difficulty hiring technicians versed in both membrane and thermal technologies. Saudi Aramco notes that ZLD facilities demand 30% more maintenance labor than conventional separators, driving its investment in predictive analytics. Veolia’s 2025 digital-twin platform trims on-site staffing by 20%, while Siemens and Xylem embed machine-learning algorithms that adjust antiscalant dosage and cleaning cycles automatically. Even so, greenfield projects often face commissioning delays as local teams ramp up skills, extending project timelines and curbing short-term growth in the Zero Liquid Discharge systems market.
*Our forecasts treat driver/restraint impacts as directional, not additive. The impact forecasts reflect baseline growth, mix effects, and variable interactions.
Zero Liquid Discharge (ZLD) Systems Market Segment Analysis
By Technology:
Hybrid Designs Erode Thermal DominanceThermal-based units retained 63.24% of the Zero Liquid Discharge systems market share in 2025 because multi-effect evaporators handle brines above 100,000 mg/L without membrane fouling. Waste-heat integration in power and petrochemical complexes further improves economics, anchoring continued demand. Nonetheless, membrane-centric packages are advancing at a 9.12% CAGR through 2031 as electricity costs rise and renewable power becomes abundant. Reverse osmosis coupled with forward osmosis or electrodialysis concentrates brine to 150,000 mg/L at just 30–40 kWh/m3, half that of conventional thermal routes. DuPont’s 2025 high-rejection RO element extends lifespan to seven years in Chinese dye-house pilots, lowering replacement cost and reinforcing the shift toward membranes. Hybrid RO-plus-crystallizer plants now dominate greenfield bids, offering lower levelized water costs and design flexibility, a trend that underpins growth in the Zero Liquid Discharge systems market across high-electricity regions.
Second-order impacts are equally material. Membrane adoption reduces steam-cycle complexity, enabling containerized and skid-mounted footprints that accelerate deployment in upstream oilfields. Vendors that integrate digital monitoring - predicting fouling and optimizing cleaning - are differentiating offerings without cutting prices, a strategy that shields margins even as membrane costs fall. Collectively, these factors point to a gradual but meaningful rebalancing of the Zero Liquid Discharge systems market size in favor of membrane-dominant configurations over the forecast horizon.
By Process Phase:
Pretreatment Surges Amid Fouling ConcernsEvaporation and crystallization consumed 49.48% of the Zero Liquid Discharge systems market size in 2025 because they embody the capital-heavy end stage that converts concentrated brine into solids. Yet pretreatment spending is growing 9.35% annually, reflecting recognition that upstream fouling control governs downstream uptime and energy demand. Plants are deploying antiscalants, multimedia filtration, and ion-exchange polishing to shield RO membranes and heat-exchanger surfaces from calcium sulfate, silica, and organics. Brine-concentration steps - RO and electrodialysis - are expanding in tandem, minimizing the flow that reaches thermal units and thus trimming energy costs. Innovation is moving into solids handling: Saltworks Technologies launched eutectic freeze crystallization in 2025, enabling saleable sodium chloride and sulfate streams while slashing landfill fees. As operators chase value recovery and circular-economy goals, comprehensive lifecycle calculations increasingly favor investments beyond the traditional evaporator-focused core, a dynamic that broadens the addressable Zero Liquid Discharge systems market.
Upfront pretreatment also accelerates plant commissioning by standardizing feedwater quality, making modular plants feasible for small and medium users. Vendors that bundle chemical dosing, rapid media exchange, and cloud diagnostics are shortening payback periods, tilting procurement specifications toward integrated platforms. These shifts underscore why pretreatment now stands out as the fastest-growing internal segment of the Zero Liquid Discharge systems market.
By End-User Industry:
Power Generation Leads but Pharmaceuticals AcceleratePower generation captured 37.89% of the Zero Liquid Discharge systems market share in 2025 and continues to top growth tables with a 9.42% CAGR as India, China, and Indonesia build coal and combined-cycle stations under water-scarcity constraints. Integrated ZLD sidesteps retrofit headaches and secures water permits, making it standard in new projects. In oil and gas, modular systems shrink trucking mileage for produced water, aligning with carbon-reduction goals and lowering disposal fees. Chemicals and petrochemicals face converging EU REACH rules and Chinese park consolidation that embed ZLD within environmental risk management. Mining firms deploy ZLD to mitigate acid-mine drainage; BHP’s Escondida retrofit in 2025 eliminated 1.2 million m³/year of pond discharge, supporting community relations.
Pharmaceutical producers, a minor slice today, are scaling fastest after the U.S. Food and Drug Administration tightened effluent limits for endocrine disruptors in 2025, compelling active-drug separation before discharge. ZLD satisfies both compliance and corporate ESG targets, especially where plants rely on scarce municipal supplies. Food and beverage, along with pulp-and-paper operators, are piloting containerized units as water tariffs climb. This diversification reduces concentration risk and expands the Zero Liquid Discharge systems market size across a broader client base than a decade ago.


Geography Analysis
APAC Zero Liquid Discharge (ZLD) Systems Market
Asia-Pacific commanded 32.67% of global revenue in 2025 and is forecast to grow at a 9.69% CAGR through 2031, underpinned by stringent basin-wide discharge bans in China’s Yellow River corridor and India’s multi-river clean-up mission. China shut 23 non-compliant chemical plants in 2025, triggering retrofit orders across Shanxi and Inner Mongolia. India’s extension of ZLD mandates to facilities within 10 km of major rivers affects more than 4,200 plants, propelling domestic EPC order books. Japan and South Korea subsidize fab-level water reuse; Japan set aside USD 120 million in 2025 to reach 95% reuse by 2030, accelerating procurement of high-purity ZLD modules. ASEAN incentives, such as Vietnam’s 2 percentage-point corporate-tax discount for zero-discharge sites, extend growth to export-oriented clusters.
North America Zero Liquid Discharge (ZLD) Systems Market
North America retains a large installed base owing to shale-gas water reuse and California’s 80% industrial-recycle mandate. Chevron recycled 78% of Permian produced water in 2025 and targets 90% by 2028 via ZLD pilots. California broadened recycled-water requirements to refineries and chemical plants in 2025, driving EPC backlog. Canada trials ZLD in oil-sands tailings ponds to shorten reclamation timelines. Mexico raised industrial water tariffs 35% in 2024, tipping brewery and auto-plant economics toward closed-loop recovery. Robust capital markets and mature EPC capacity accelerate deployment across the continent.
EMEA and South America Zero Liquid Discharge (ZLD) Systems Market
Europe’s uptake hinges on the Industrial Emissions Directive and local abstraction caps. Germany’s Rhine-Main chemical complex leads retrofits, while France’s variable salinity levy nudges inland firms toward ZLD. The UK tightened permits for coastal desalination concentrator brines in 2025, demanding either dilution or ZLD to protect marine ecosystems. Italy designated 12 zero-discharge industrial zones in the Po basin in mid-2025, giving incentives for textiles and ceramics plants. South America concentrates activity in Brazil’s São Francisco basin, where 18 mines added ZLD in 2025 to secure licenses. In the Middle East and Africa, Saudi Arabia and the UAE drive demand through produced-water mandates, while South African mines deploy ZLD to manage acid-mine drainage despite high electricity tariffs.
Regulatory Landscape
Regulation is increasingly translating water-reuse targets and sector-specific effluent limits into de facto ZLD requirements for high-salinity streams. In the United States, the EPA finalized revisions to the Steam Electric Power Generating Point Source Category rules in December 2025 (40 CFR Part 423), reinforcing zero-discharge limitations for specific wastewaters such as flue gas desulfurization (FGD) wastewater, bottom ash transport water, and combustion residual leachate. That shift is driving compliance-led demand for high-recovery concentration and crystallization trains at power assets.
In India, policy and funding are moving in parallel, with tighter reuse obligations supported by public programs. The Liquid Waste Management Rules 2024 introduced phased wastewater treatment and reuse obligations for bulk water users, and several states issued reuse policies to raise minimum reuse ratios over time. Alongside compliance pressure, Rajasthan initiated a Hybrid Annuity Model (HAM) scheme in May 2026 to support Common Effluent Treatment Plants (CETPs) using ZLD technology (grant support up to INR 150 crore), lowering adoption barriers for clustered industries that cannot justify single-site ZLD capex.
Value Chain Analysis
The ZLD systems value chain begins with process design and water chemistry characterization, then runs through a multi-stage equipment stack: pretreatment (filtration, softening, chemical dosing, and specialty separations), membrane concentration (RO and related high-recovery configurations), and thermal evaporation and crystallization (often mechanical vapor recompression), followed by solids handling and disposal or salt recovery. Key inputs include membranes, heat exchangers, evaporators or crystallizers, anti-scalants and cleaning chemicals, instrumentation, and automation software. Downstream value is captured in EPC integration, commissioning, and long-term operations and maintenance (O&M) contracts, where uptime, scaling control, and energy optimization influence lifecycle cost.
Procurement typically flows through EPCs and integrated water players that bundle equipment, automation, and service into performance-linked guarantees (water recovery and residue quality). Demand is strongest when permitting and Consent to Operate renewals hinge on zero-discharge outcomes, which pushes end users to favor vendors that can integrate pretreatment with hybrid membrane-thermal architectures and remote monitoring to mitigate operator scarcity. Project wins and commissioning activity in India underscore how regional integrators and component suppliers convert policy into orders, with containerized and modular packages increasingly used to shorten installation cycles for industrial clusters and greenfield manufacturing sites.
Competitive Landscape
The Zero Liquid Discharge systems market is moderately fragmented. Competition revolves around three axes. First, energy efficiency: vendors that leverage mechanical vapor recompression or integrate waste-heat recovery offer 25–40% lower operating costs, capturing premium margins. Second, modularization: skid-mounted units sized 250–750 m³/day allow rapid field deployment in oilfields and small chemical parks, an arena where Praj Industries and Saltworks Technologies excel through containerized designs financed on a water-as-a-service model. Third, digital integration: Siemens’ May 2025 AI-driven brine optimizer trims antiscalant use by 18% and extends membrane life, differentiating bids even when capex is higher. Longer term, digital twins and outcome-based contracts (volume-of-water-recovered pricing) may shift risk from owners to suppliers, boosting recurring revenue. Vendors expanding service portfolios position themselves to capture annuity streams while intensifying customer lock-in. Consequently, although consolidation has inched upward, competitive intensity remains high and innovation pipelines robust.
Zero Liquid Discharge (ZLD) Systems Industry Leaders
-
Veolia Water Solutions & Technologies
-
GEA Group Aktiengesellschaft
-
Aquatech
-
ALFA LAVAL
-
Xylem
- *Disclaimer: Major Players sorted in no particular order

Zero Liquid Discharge (ZLD) Systems Market Companies Covered in this Report
- ALFA LAVAL
- Aquarion AG
- Aquatech
- Doosan Corporation
- Dow
- GEA Group Aktiengesellschaft
- H2O GmbH
- Hydranautics (A Nitto Group Company)
- Mitsubishi Heavy Industries, Ltd.
- Praj Industries
- SafBon Water Technology
- Saltworks Technologies Inc.
- Siemens
- Thermax Limited
- Toshiba Water Solutions Private Limited
- Veolia Water Solutions & Technologies
- Xylem
Read Analysis of Zero Liquid Discharge (ZLD) Systems Companies
Market Opportunities and Future Outlook
White-space is expanding around compliance-led retrofits and greenfield capacity additions in water-stressed industrial corridors, especially where ZLD is shifting from a site-level ESG choice to an operating prerequisite. India illustrates this direction through a combination of enforcement and capex-sharing mechanisms: Rajasthan's May 2026 HAM support for ZLD-enabled CETPs reduces the economic hurdle for textile, chemical, and mixed industrial clusters, while broader reuse obligations for bulk water users increase demand for scalable pretreatment, brine concentration, and crystallization packages.
New growth lanes are also showing up in industrial investments that embed closed-loop water from day one. In January 2026, VA TECH WABAG secured an industrial water treatment contract from Bharat Petroleum Corporation Limited for the Bina Refinery that includes a ZLD plant, indicating refinery-level demand for integrated treatment plus brine management. Project awards in 2026 in India, including Spray Engineering Devices Limited winning ZLD orders for solar PV manufacturing and Effwa Infra receiving a ZLD project from JSW JFE Electrical Steel, also support a procurement shift toward end-to-end EPC scope with high-recovery targets. This creates room for suppliers that combine energy-efficient thermal systems (MVR, low-temperature evaporation) with membrane concentration and digital O&M to manage levelized water cost.
Recent Industry Developments in Zero Liquid Discharge (ZLD) Systems Market
- May 2026: Aquatech acquired FTS H2O to expand its brine concentration and ZLD capabilities, with added emphasis on membrane-driven brine recovery and lithium processing workflows. The deal broadens Aquatech's technology stack around high-salinity water management, where ZLD projects increasingly pair water recovery with resource recovery.
- May 2026: GEA introduced its meVap portfolio at IFAT 2026, highlighting MVR-based evaporation, distillation, and crystallization solutions aimed at lowering the energy intensity of thermal separation. The launch supports industrial customers seeking ZLD architectures that reduce steam demand and integrate more readily with electrified and decarbonized utility setups.
- December 2024: The EU revised the Industrial Emissions Directive, listing ZLD as a reference technique for brine management in water-scarce member states. This regulatory anchor raises the compliance baseline for industrial facilities handling high-TDS effluents, strengthening the business case for hybrid membrane-thermal ZLD solutions across regulated European sites.
Zero Liquid Discharge (ZLD) Systems Market Report Scope and Research Methodology
Market Definition and Coverage
For this study, the zero liquid discharge (ZLD) systems market is defined as revenues earned from complete installations that treat industrial wastewater so no liquid effluent is released, and the output is reusable water plus solid residue that meets disposal norms.
Scope exclusions: We exclude standalone brine concentration skid packages that are sold without a crystallizer and are not delivered as a full ZLD train.
Segments Covered in This Report
- By Technology
- Thermal-based
- Membrane-based
- By Process Phase
- Pretreatment
- Brine Concentration
- Evaporation and Crystallization
- Solids Handling and Disposal
- By End-user Industry
- Power Generation
- Oil and Gas
- Chemicals and Petrochemicals
- Metallurgy and Mining
- Pharmaceuticals
- Other End-user Industries
- By Geography
- Asia-Pacific
- China
- India
- Japan
- South Korea
- ASEAN Countries
- Rest of Asia-Pacific
- North America
- United States
- Canada
- Mexico
- Europe
- Germany
- France
- United Kingdom
- Italy
- Rest of Europe
- South America
- Brazil
- Argentina
- Rest of South America
- Middle-East and Africa
- Saudi Arabia
- South Africa
- Rest of Middle-East and Africa
- Asia-Pacific
Data Sources, Market Sizing, and Validation
Desk Research
Desk research was used to map the demand pool and the compliance drivers that push plants toward ZLD, before the numbers were modeled. We mainly relied on public sources such as US EPA water and effluent guidance, Eurostat industrial and environmental datasets, UN Water and FAO AQUASTAT water stress indicators, World Bank industry and infrastructure series, and national pollution control boards and environment ministries in key countries.
To convert that context into a usable market model, we also reviewed company annual reports and project case studies, association and regulator websites, and reputable press that tracks industrial wastewater upgrades. In a few places, paid databases were used for company financials and intelligence, patent filings, and tender and contract tracking to validate where large projects are being awarded. These examples are not exhaustive, and many other public sources were used for data collection, validation, and clarification during the research.
Primary Interviews and Surveys
Primary work focused on validating what gets counted as a true ZLD system in bids, and then confirming typical system sizing, service attachment rates, and timeline patterns. We spoke with system integrators, EPC teams, industrial water managers, and component-side experts across APAC, EMEA, and the Americas so assumptions could be checked against real procurement and operating decisions.
Distribution of primary research fieldwork respondents
| Company type | Respondent position | Region |
|---|---|---|
| Top tier: 37% | CXOs: 15% | APAC: 46% |
| Mid tier: 47% | Functional/Unit leaders: 42% | EMEA: 36% |
| Smaller Players: 16% | Managers: 43% | Americas: 18% |
Market-Sizing & Forecasting
Sizing starts from a top-down build that reconstructs the addressable demand using industrial wastewater generation and reuse pressure, then narrows it to sites where discharge norms and dissolved solids make ZLD a realistic compliance path. That demand pool is translated into spending by applying adoption rates, typical plant capacity bands, and installed-cost ranges for full ZLD trains, followed by region and industry weighting based on where mandates and water stress are most visible.
To keep the totals grounded, we corroborate results with selective bottom-up checks using sampled project awards, supplier and integrator revenue splits, and a simple ASP times volume view for major system blocks (pretreatment, concentrator, crystallizer) and attached services. Inputs that matter in this market include tightening discharge limits for TDS and chlorides, industrial output trends in high-effluent sectors, capacity additions in power and chemicals, frequency of new-build versus retrofit projects, energy price direction that affects thermal-heavy designs, and the share of projects that include long-term O&M.
For forecasting, scenario analysis is used because adoption is heavily influenced by regulation timing and capex cycles, and then assumptions are cross-checked with expert expectations by region. Where bottom-up evidence is thin in smaller geographies, we apply proxy indicators like industrial capex and water stress, and then re-check the implied project counts against known tender activity before finalizing the series.
Data Validation & Update Cycle
Outputs are checked in multiple steps so the final numbers stay consistent with real-world signals. We compare implied project counts, typical system sizes, and service shares against independent indicators like tender volume, permitting activity, and capex commentary from industrial operators, and outliers are flagged for rework.
Before sign-off, assumptions are reviewed by another analyst and any material variance triggers re-contact with selected experts to confirm what changed and why. Reports are refreshed annually, and interim updates are made when major regulatory shifts, large awards, or sharp energy cost moves can change short-term demand. Right before delivery, a fresh pass is completed so clients receive the latest updated view.
Mordor Intelligence's Zero Liquid Discharge Zld Systems Market Size Measured Against Other Published Estimates
Published ZLD market numbers often differ because the boundary of what counts as a complete ZLD installation is not consistent across sources, and the timing of regulatory and project-cycle assumptions also varies. Currency conversion choices and the year used as the anchor point can widen the gap further, even when the growth story looks similar.
Project award signals, tender language that specifies a crystallizer, and service attachment evidence are the checks that keep Mordor Intelligence tied to complete ZLD trains rather than partial brine-treatment packages, which can inflate totals if counted. Differences can also come from how each estimate treats EPC scope versus equipment-only sales, and whether aftermarket and commissioning are included only when they are directly linked to a specific ZLD unit.
Benchmark comparison
| Source | Market Size | Gaps in Research Methodology |
|---|---|---|
| Mordor Intelligence | USD 8.01 B (2026) | |
| Global Consultancy A | USD 8.05 B (2024) | Uses an earlier base year and appears to apply a broad ZLD definition with limited clarity on whether full-train installations are separated from partial brine concentration solutions, which can shift the addressable pool. |
| Industry Publisher B | USD 6.69 B (2024) | Leans on a more conservative adoption curve across end-use industries and may exclude some engineering and commissioning revenues, which reduces the captured spend even when project activity exists. |
Overall, the spread is mainly explained by scope boundaries, base-year alignment, and how adoption and installed-cost progression are applied. By tying the count to complete ZLD trains and then validating the implied project flow with external activity signals, the estimate stays practical to replicate and easier for decision-makers to trace back to clear variables.
Key Questions Answered in the Report
What is the projected value of the Zero Liquid Discharge systems market in 2031?
The market is projected to reach USD 11.96 billion by 2031, expanding at an 8.34% CAGR.
Which segment currently holds the largest Zero Liquid Discharge systems market share?
Thermal-based technology led with a 63.24% share in 2025.
Why is Asia–Pacific the fastest-growing region for Zero Liquid Discharge deployment?
Regulatory discharge bans and rapid industrialization drive a 9.69% regional CAGR.
How are semiconductor companies influencing Zero Liquid Discharge adoption?
Fab operators in Taiwan, South Korea, and the United States are targeting 98% water reuse, embedding ZLD into permitting.
What is the main restraint limiting Zero Liquid Discharge uptake?
High capital and energy costs push levelized water prices above USD 5/m³ in thermal-heavy plants.
Which technology trend is lowering operational barriers for Zero Liquid Discharge owners?
Digital twins and AI-driven control systems reduce skilled-labor requirements and cut downtime.