| Study Period | 2017 - 2030 |
| Base Year For Estimation | 2024 |
| Forecast Data Period | 2025 - 2030 |
| Market Size (2025) | USD 110.6 Billion |
| Market Size (2030) | USD 143.8 Billion |
| CAGR (2025 - 2030) | 5.39 % |
| Market Concentration | Low |
Major Players*Disclaimer: Major Players sorted in no particular order |

Yogurt Market Analysis
The Yogurt Market size is estimated at 110.6 billion USD in 2025, and is expected to reach 143.8 billion USD by 2030, growing at a CAGR of 5.39% during the forecast period (2025-2030).
The yogurt industry is experiencing significant transformation driven by changing consumer preferences and retail dynamics. Supermarkets and hypermarkets continue to dominate the distribution landscape, accounting for 61.43% of off-trade yogurt sales in 2022, attributed to their ability to offer a wide variety of products and competitive pricing. The retail landscape is evolving with the emergence of innovative marketing strategies, including group buying initiatives, live streaming promotions, and targeted discount campaigns, particularly in the e-commerce sector. These developments have contributed to a more dynamic and competitive market environment, with major retail chains expanding their yogurt market offerings across different price points and categories.
Consumer preferences are increasingly shifting toward healthier and more innovative product variants, with a growing emphasis on functional benefits and unique flavors. This trend is particularly evident in mature markets, where 32% of UK consumers indicated a willingness to pay premium prices for innovative yogurt flavors in 2022. Manufacturers are responding by introducing new flavor combinations and functional variants, including protein-enriched formulations and probiotic-enhanced products. The yogurt industry has witnessed a surge in product innovation, with companies focusing on clean-label products, reduced sugar content, and enhanced nutritional profiles to meet evolving consumer demands.
The distribution channel landscape is undergoing significant transformation with the rapid growth of e-commerce platforms. Online retail, while currently representing 3.29% of total yogurt sales in 2022, is emerging as the fastest-growing distribution channel, driven by convenience and digital innovation. Major online retailers are leveraging advanced technologies and personalized marketing strategies to enhance customer experience and capture market share. The integration of digital platforms has enabled better inventory management, personalized recommendations, and improved customer engagement, leading to more efficient distribution networks.
Flavor preferences continue to play a crucial role in yogurt market dynamics, with distinct regional variations emerging in consumer choices. In the United States, for instance, strawberry remains the most popular flavor choice with 8% consumer preference, followed by vanilla and blueberry at 4% each, demonstrating the importance of traditional flavor profiles in major markets. Manufacturers are increasingly focusing on developing region-specific flavor profiles while maintaining consistent quality standards across their product portfolios. This strategic approach to product development and flavor innovation has become essential for maintaining a competitive advantage in the global yogurt market.
Global Yogurt Market Trends
The increasing awareness of the health benefits of yogurt, including its role in weight management, gut health, and nutrition, along with a wide range of flavors and versatile consumption options, is driving the growing demand for yogurt globally.
- A larger number of people are consuming yogurt due to its health benefits. Yogurt is considered a protein-rich food source that improves metabolism. Therefore, eating yogurt throughout the day helps to burn more calories. Apart from weight loss, yogurt also enhances gut bacteria. Thus, the demand for yogurt is continuously rising and gaining popularity worldwide. Factors like increasing government-run health and wellness campaigns designed to combat obesity and related problems (diabetes, high blood pressure, heart disease, and high cholesterol) are encouraging consumers to purchase healthier products. This is directly boosting the consumption of dairy products, including yogurt. The per capita consumption of yogurt is expected to increase by 2.67% globally during 2023-2024.
- Yogurt is available in many flavors and can be taken as a drink, a frozen good, or a dessert. Labels offer expanded nutrient information and often carry the Heart and Stroke Foundation health check symbol. Yogurt is often fortified with additional vitamins, minerals, and fiber, enhancing the consumption of yogurt among consumers. For instance, as of 2021, 80.8% of consumers in the United States consumed flavored yogurt due to its significant nutritional benefits.
- The demand for yogurt-based recipes is increasing in cafes and restaurants, which is further boosting the market’s growth. This is also attributed to growth in the foodservice industry in different countries, especially in Southeast Asia, due to strategic expansion by foreign food chains and growing inbound tourists. In 2022, the number of tourist arrivals amounted to around 11.15 million, a drastic increase from the previous years.

Understand The Key Trends Shaping This Market
Download PDF
OTHER KEY INDUSTRY TRENDS COVERED IN THE REPORT
- Milk production has been increasing due to factors such as improved weather conditions, rising volume of milk per cow, and the changing dietary habits of consumers globally.
Segment Analysis: Product Type
Flavored Yogurt Segment in Global Yogurt Market
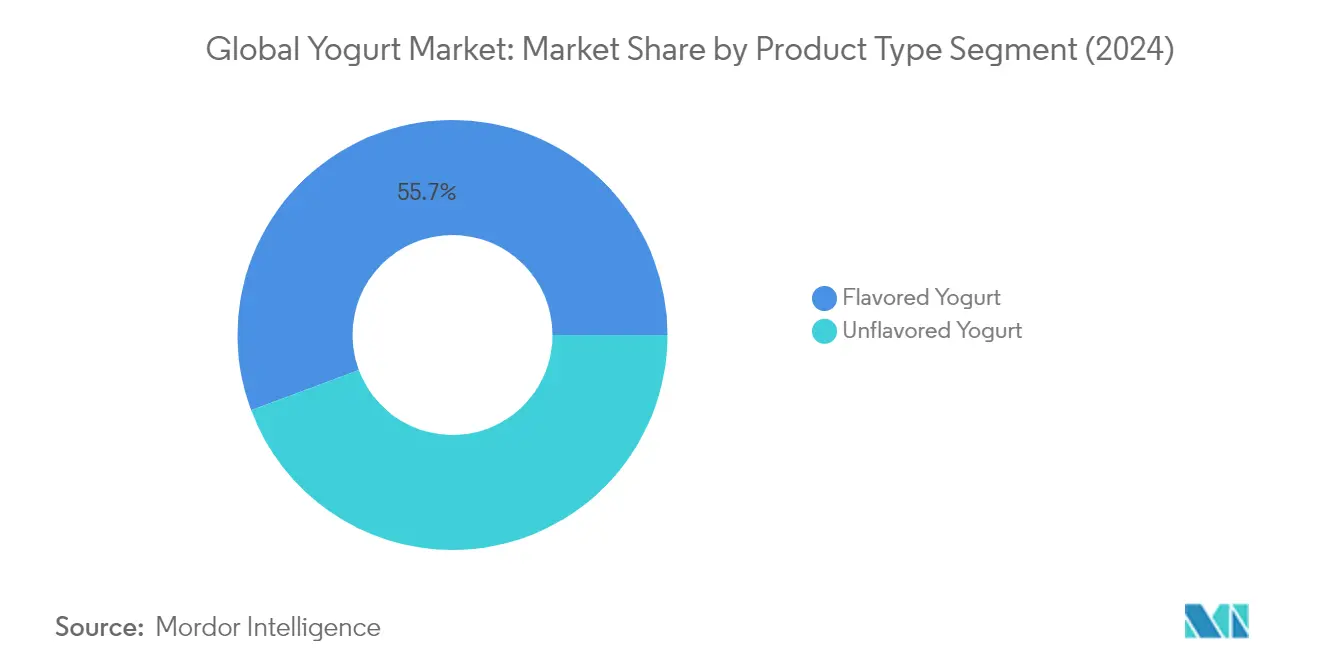
Flavored yogurt dominates the global yogurt market, commanding approximately 56% of the total yogurt market share in 2024. This significant market position is attributed to consumers' evolving preferences for different flavors and the segment's versatility as a breakfast option, snack, dessert, or beverage. The segment's popularity is particularly strong in China, which accounts for nearly 24% of global flavored yogurt market consumption. Consumer demand is driven by the segment's nutritional benefits, with most flavored yogurts containing around 170 calories and 5-7g of protein per serving, while flavored Greek yogurt variants offer approximately 120 calories and 12g of protein per 5.3 oz serving. The market's growth is further supported by manufacturers' continuous innovation in flavor profiles, including both traditional fruit flavors and newer vegetable-based options such as carrot, beet, tomato, and sweet potato, catering to diverse consumer preferences.
Unflavored Yogurt Segment in Global Yogurt Market
The unflavored yogurt segment is experiencing the fastest growth in the global yogurt market, with an expected growth rate of approximately 5% during 2024-2029. This accelerated growth is primarily driven by increasing consumer awareness of health benefits and the rising demand for protein-rich food sources that improve metabolism. The segment's growth is particularly strong among health-conscious consumers who prefer products without added sugars and preservatives. High-protein unflavored yogurt has gained significant traction as a better-for-you snack offering satiety and sustained energy, with more than three in four active global consumers using it as a snack. The segment's expansion is further supported by manufacturers focusing on developing products with gluten-free and non-GMO claims, catering to consumers' growing preference for clean-label products.
Segment Analysis: Distribution Channel
Supermarkets and Hypermarkets Segment in Global Yogurt Market
Supermarkets and hypermarkets dominate the global yogurt market segmentation, commanding approximately 54% market share in 2024. This channel's prominence is attributed to its ability to offer extensive shelf space, diverse product selections, and strategic product positioning that influences impulse purchases. The proximity factor of these channels, especially in large cities and metropolitan areas, provides them with a significant advantage in influencing consumer purchasing decisions. These retail formats offer a wide variety of brands, flavors, and packaging options, catering to different consumer preferences and price points. Major supermarket chains worldwide maintain dedicated sections for dairy products, including yogurt, with both international and local brands prominently displayed. The channel's success is further enhanced by frequent price promotions, bulk purchase options, and the convenience of one-stop shopping for consumers.
Online Retail Segment in Global Yogurt Market
The online retail channel is experiencing remarkable growth in the yogurt market, driven by increasing smartphone penetration and widespread internet accessibility. This segment is projected to demonstrate robust expansion between 2024 and 2029, supported by the growing consumer preference for convenient shopping options. E-commerce platforms are revolutionizing yogurt distribution through innovative features such as subscription services, bulk purchase discounts, and same-day delivery options. Major online retailers are enhancing their cold chain capabilities and implementing sophisticated delivery systems to ensure product quality and freshness. The segment's growth is further accelerated by the integration of mobile apps, digital payment solutions, and personalized shopping experiences. Online platforms are also leveraging data analytics to understand consumer preferences and optimize their product offerings, while implementing loyalty programs and targeted promotions to retain customers.
Remaining Segments in Distribution Channel
The yogurt market's distribution landscape is further diversified through several other significant channels. Convenience stores serve as crucial points of sale, particularly for on-the-go consumption, offering easily accessible locations and quick purchasing options. Specialist retailers focus on premium and artisanal yogurt products, catering to niche market segments with specific dietary preferences or quality requirements. The on-trade channel, encompassing restaurants, cafes, and food service establishments, plays a vital role in introducing innovative yogurt-based dishes and desserts to consumers. Other distribution channels, including warehouse clubs and gas stations, contribute to market accessibility by providing additional purchasing options for consumers. Each of these channels serves distinct consumer needs and preferences, contributing to the overall market dynamics and accessibility of yogurt products.
Yogurt Market Geography Segment Analysis
Yogurt Market in Africa
The African yogurt market demonstrates significant potential driven by increasing consumer awareness of probiotic benefits and rising disposable incomes. The region's market dynamics are shaped by diverse consumer preferences across countries like Egypt, Nigeria, and South Africa, with each market showing unique consumption patterns. Government initiatives supporting dairy production and frequent product launches in the flavored category are contributing to market expansion. The trend toward healthier eating habits and growing urbanization are also key factors influencing yogurt consumption by country across the continent.
Yogurt Market in South Africa
South Africa stands as the dominant force in the African yogurt market, holding approximately 42% yogurt market share in 2024. The country's robust dairy industry and well-established distribution networks contribute to its market leadership. Consumer preferences in South Africa are increasingly shifting toward yogurt products with health claims such as low-fat, reduced sugar, and gluten-free variants. The country's food-based dietary guidelines, developed by the Nutrition Society of South Africa, actively promote daily consumption of yogurt to meet essential nutrient requirements. The market is characterized by significant domestic production capabilities and strong penetration of both local and international brands.
Yogurt Market in Egypt
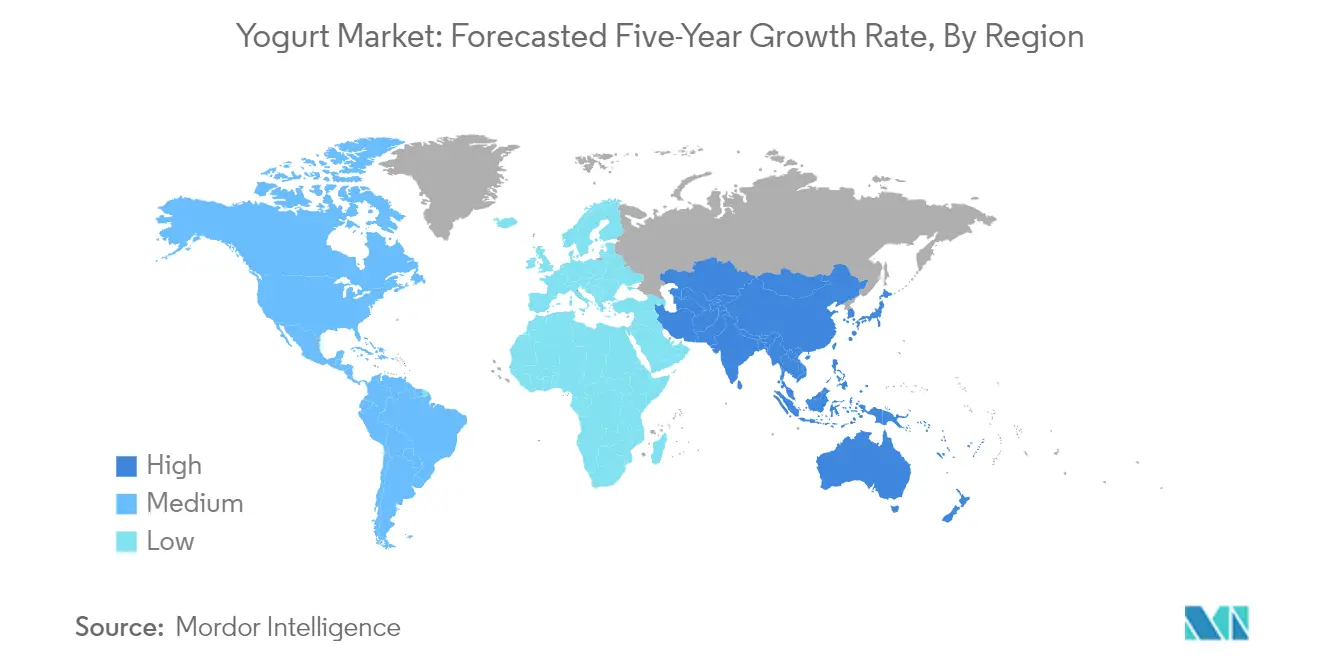
Egypt emerges as the fastest-growing yogurt market in Africa, projected to grow at approximately 7% during 2024-2029. The country's growth trajectory is supported by its well-developed dairy processing infrastructure and increasing consumer preference for yogurt-based traditional dishes. Egyptian consumers are increasingly gravitating toward unflavored yogurt, which is deeply integrated into local culinary traditions. The market is witnessing innovation in product offerings, with manufacturers introducing new variants catering to health-conscious consumers. Distribution channels are evolving, with convenience stores playing a crucial role in product accessibility and market penetration.
Yogurt Market in Asia-Pacific
The Asia-Pacific yogurt market represents a dynamic landscape characterized by diverse consumer preferences and eating habits across different countries. The region encompasses major markets including China, India, Japan, South Korea, Australia, and several Southeast Asian nations. Consumer awareness about health benefits, particularly probiotics and gut health, is driving market growth. The region shows strong innovation in product development, with manufacturers introducing new flavors and functional variants to meet evolving consumer demands. Distribution channels are evolving with the rise of modern retail formats and e-commerce platforms.
Yogurt Market in China
China dominates the Asia-Pacific yogurt market, commanding approximately 56% yogurt market share in 2024. The country's yogurt industry benefits from strong domestic production capabilities and widespread distribution networks. Chinese consumers show increasing preference for yogurt as a healthy beverage option, with particular interest in probiotic and functional variants. The market is characterized by strong innovation in flavors and formats, with manufacturers continuously introducing new products to meet evolving consumer preferences. The country's robust retail infrastructure and growing e-commerce penetration further support market expansion.
Yogurt Market in India
India represents the fastest-growing market in the Asia-Pacific region, with an expected growth rate of approximately 12% during 2024-2029. The country's yogurt market is driven by its deep-rooted cultural connection to dairy products and increasing health consciousness among consumers. Indian consumers are increasingly adopting yogurt as a healthy snack and breakfast option, while also maintaining traditional consumption patterns. The market is witnessing significant investment in production capabilities and cold chain infrastructure. Modern retail formats and innovative packaging solutions are making yogurt more accessible to urban and rural consumers alike. The yogurt market size in India continues to expand, reflecting the country's growing demand for dairy products.
Yogurt Market in Europe
The European yogurt market showcases a mature and sophisticated landscape with a strong presence across countries including Germany, France, the UK, Italy, and Spain. Consumer preferences in the region are increasingly shifting toward premium and functional yogurt variants. The market is characterized by strong innovation in product development, particularly in areas of sugar reduction and clean label products. Sustainability and environmental considerations are becoming increasingly important factors in consumer purchasing decisions.
Yogurt Market in Germany
Germany maintains its position as the largest yogurt market in Europe, supported by its robust dairy industry and strong consumer base. The country's market is characterized by high per capita consumption and strong preference for both traditional and innovative yogurt variants. German consumers show particular interest in protein-rich and functional yogurt products, driving manufacturers to expand their premium product offerings. The market benefits from well-established distribution networks and a strong presence of both domestic and international brands.
Yogurt Market in Italy
Italy emerges as the fastest-growing yogurt market in Europe, driven by increasing consumer preference for healthier snacking options and functional dairy products. The Italian market shows strong innovation in product development, particularly in probiotic and low-fat variants. Consumer awareness about the health benefits of yogurt continues to drive market growth, with particular emphasis on digestive health and protein content. The country's traditional food culture, combined with modern health trends, creates unique opportunities for yogurt manufacturers.
Yogurt Market in Middle East
The Middle Eastern yogurt market demonstrates strong growth potential, influenced by traditional dietary habits and increasing health consciousness across countries including Iran, Saudi Arabia, the UAE, and other Gulf nations. Iran leads in market size while the UAE shows the fastest growth rate in the region. Yogurt plays a significant role in Middle Eastern cuisine, used both as a standalone product and an ingredient in various traditional dishes. The market is witnessing modernization in production techniques and distribution channels, with supermarkets and hypermarkets playing an increasingly important role. Consumer preferences are evolving with growing demand for both traditional and innovative yogurt products, including probiotic and functional variants.
Yogurt Market in North America
The North American yogurt market demonstrates sophisticated consumer preferences and strong innovation in product development across the United States, Canada, and Mexico. The United States leads in market size while Mexico shows the fastest growth rate in the region. The market is characterized by strong demand for Greek yogurt, probiotic variants, and plant-based alternatives. Health consciousness and convenience drive consumer choices, with increasing emphasis on protein content and functional benefits. Distribution channels are well-developed, with a strong presence across retail formats and growing importance of online channels. The US yogurt market continues to evolve with new product launches focusing on clean label ingredients and innovative flavors.
Yogurt Market in South America
The South American yogurt market shows promising growth potential, with Brazil and Argentina as key markets in the region. Brazil leads in market size while Argentina demonstrates the fastest growth rate. The region's yogurt consumption is influenced by increasing health awareness and changing dietary habits. Manufacturers are focusing on product innovation, particularly in probiotic and functional yogurt segments. Distribution networks are expanding, with modern retail formats gaining importance alongside traditional channels. The market shows strong potential for premium products, especially in urban areas, while maintaining demand for traditional yogurt variants.
Get Analysis on Important Geographic Markets
Download PDF
Yogurt Industry Overview
Top Companies in Yogurt Market
The global yogurt market is characterized by intense competition among major players like Danone SA, Inner Mongolia Yili Industrial Group, China Mengniu Dairy Company, and Yakult Honsha Co. Ltd. These largest yogurt companies are heavily focused on product innovations, particularly in developing new flavors, functional varieties, and healthier formulations with reduced sugar content and added probiotics. Operational agility is demonstrated through investments in advanced manufacturing facilities and research centers, enabling rapid response to changing consumer preferences. Strategic moves predominantly involve partnerships with technology companies and local distributors to enhance distribution networks and digital capabilities. Geographic expansion remains a key focus, with companies particularly targeting emerging markets in Asia-Pacific and Africa through both organic growth and acquisitions, while simultaneously strengthening their presence in established markets through portfolio diversification and brand-building initiatives.
Market Structure Favors Large Integrated Players
The yogurt market exhibits a relatively consolidated structure dominated by large multinational corporations with integrated supply chains and extensive distribution networks. These major players benefit from economies of scale, established brand recognition, and significant research and development capabilities, allowing them to maintain their competitive edge. Regional players maintain strong positions in their respective local markets through a deep understanding of local preferences and established relationships with retailers. The market has witnessed significant consolidation through mergers and acquisitions, particularly in emerging markets where global players seek to establish or strengthen their presence.
The competitive dynamics are characterized by a mix of global conglomerates and specialized dairy companies, with the former leveraging their diverse product portfolios and extensive resources to maintain market leadership. Market entry barriers are substantial due to high capital requirements, stringent regulatory compliance needs, and the importance of established distribution networks. The industry has seen a trend of larger companies acquiring smaller, innovative brands to expand their product offerings and capture growing consumer segments, particularly in the premium and health-focused categories.
Innovation and Distribution Drive Future Success
Success in the yogurt industry increasingly depends on companies' ability to innovate across product formulations, packaging, and marketing strategies while maintaining efficient distribution networks. Incumbents must focus on continuous product innovation, particularly in developing functional and health-oriented varieties, while simultaneously expanding their distribution reach through both traditional and digital channels. Companies need to invest in sustainable practices and transparent supply chains to meet growing consumer demands for environmentally responsible products. The ability to quickly adapt to changing consumer preferences and maintain strong relationships with retailers remains crucial for maintaining yogurt market share.
For contenders looking to gain ground, focusing on niche market segments and developing unique value propositions through specialized products or innovative delivery models presents significant opportunities. Success factors include building strong local brand identities, developing efficient cold chain logistics capabilities, and establishing strategic partnerships with retailers and distributors. Companies must also prepare for potential regulatory changes, particularly regarding health claims, ingredient labeling, and environmental standards. The market's future will be shaped by companies' ability to balance innovation with operational efficiency while maintaining strong relationships with both retailers and end consumers.
Yogurt Market Leaders
-
China Mengniu Dairy Company Ltd
-
Danone SA
-
Inner Mongolia Yili Industrial Group Co. Ltd
-
Nestlé SA
-
Yakult Honsha Co. Ltd
- *Disclaimer: Major Players sorted in no particular order

Need More Details on Market Players and Competitors?
Download PDF
Yogurt Market News
- July 2022: Amul announced an investment of USD 60 million to build a new dairy plant in Rajkot to expand its production capabilities across milk, yogurt, and buttermilk products.
- June 2022: Danone North America partnered with White Plains, Boulder, and Colo and launched Activia+ Multi-Benefit Probiotic Yogurt Drinks.
- July 2021: Miss Fresh partnered with China Mengniu Dairy to offer the full range of Mengniu's 70 high-quality dairy products to bring more nutritious and healthy choices to the MissFresh app and WeChat Mini Program users.
Free With This Report
We provide a comprehensive and exhaustive set of data pointers for global, regional, and country-level metrics that illustrate the fundamentals of the dairy industry. With the help of 45+ free charts, clients can access in-depth market analysis based on per capita consumption numbers and production data of raw materials for dairy, through granular-level segmental information supported by a repository of market data, trends, and expert analysis. Data and analysis on dairy, categories of dairy products, product types, etc., are available in the form of comprehensive reports as well as excel based data worksheets.


Yogurt Market Report - Table of Contents
1. EXECUTIVE SUMMARY & KEY FINDINGS
2. REPORT OFFERS
3. INTRODUCTION
- 3.1 Study Assumptions & Market Definition
- 3.2 Scope of the Study
- 3.3 Research Methodology
4. KEY INDUSTRY TRENDS
- 4.1 Per Capita Consumption
-
4.2 Raw Material/commodity Production
- 4.2.1 Milk
-
4.3 Regulatory Framework
- 4.3.1 Australia
- 4.3.2 Canada
- 4.3.3 China
- 4.3.4 India
- 4.3.5 Japan
- 4.3.6 Mexico
- 4.3.7 Netherlands
- 4.3.8 South Korea
- 4.3.9 Spain
- 4.3.10 United States
- 4.4 Value Chain & Distribution Channel Analysis
5. MARKET SEGMENTATION (includes market size in Value in USD and Volume, Forecasts up to 2030 and analysis of growth prospects)
-
5.1 Product Type
- 5.1.1 Flavored Yogurt
- 5.1.2 Unflavored Yogurt
-
5.2 Distribution Channel
- 5.2.1 Off-Trade
- 5.2.1.1 Convenience Stores
- 5.2.1.2 Online Retail
- 5.2.1.3 Specialist Retailers
- 5.2.1.4 Supermarkets and Hypermarkets
- 5.2.1.5 Others (Warehouse clubs, gas stations, etc.)
- 5.2.2 On-Trade
-
5.3 Region
- 5.3.1 Africa
- 5.3.1.1 By Product Type
- 5.3.1.2 By Distribution Channel
- 5.3.1.3 Egypt
- 5.3.1.4 Nigeria
- 5.3.1.5 South Africa
- 5.3.1.6 Rest of Africa
- 5.3.2 Asia-Pacific
- 5.3.2.1 By Product Type
- 5.3.2.2 By Distribution Channel
- 5.3.2.3 Australia
- 5.3.2.4 China
- 5.3.2.5 India
- 5.3.2.6 Indonesia
- 5.3.2.7 Japan
- 5.3.2.8 Malaysia
- 5.3.2.9 New Zealand
- 5.3.2.10 Pakistan
- 5.3.2.11 South Korea
- 5.3.2.12 Rest of Asia Pacific
- 5.3.3 Europe
- 5.3.3.1 By Product Type
- 5.3.3.2 By Distribution Channel
- 5.3.3.3 Belgium
- 5.3.3.4 France
- 5.3.3.5 Germany
- 5.3.3.6 Italy
- 5.3.3.7 Netherlands
- 5.3.3.8 Russia
- 5.3.3.9 Spain
- 5.3.3.10 Turkey
- 5.3.3.11 United Kingdom
- 5.3.3.12 Rest of Europe
- 5.3.4 Middle East
- 5.3.4.1 By Product Type
- 5.3.4.2 By Distribution Channel
- 5.3.4.3 Bahrain
- 5.3.4.4 Iran
- 5.3.4.5 Kuwait
- 5.3.4.6 Oman
- 5.3.4.7 Qatar
- 5.3.4.8 Saudi Arabia
- 5.3.4.9 United Arab Emirates
- 5.3.4.10 Rest of Middle East
- 5.3.5 North America
- 5.3.5.1 By Product Type
- 5.3.5.2 By Distribution Channel
- 5.3.5.3 Canada
- 5.3.5.4 Mexico
- 5.3.5.5 United States
- 5.3.5.6 Rest of North America
- 5.3.6 South America
- 5.3.6.1 By Product Type
- 5.3.6.2 By Distribution Channel
- 5.3.6.3 Argentina
- 5.3.6.4 Brazil
- 5.3.6.5 Rest of South America
6. COMPETITIVE LANDSCAPE
- 6.1 Key Strategic Moves
- 6.2 Market Share Analysis
- 6.3 Company Landscape
-
6.4 Company Profiles (includes Global Level Overview, Market Level Overview, Core Business Segments, Financials, Headcount, Key Information, Market Rank, Market Share, Products and Services, and Analysis of Recent Developments).
- 6.4.1 China Mengniu Dairy Company Ltd
- 6.4.2 Danone SA
- 6.4.3 Fonterra Co-operative Group Limited
- 6.4.4 Groupe Lactalis
- 6.4.5 Gujarat Cooperative Milk Marketing Federation Ltd
- 6.4.6 Inner Mongolia Yili Industrial Group Co. Ltd
- 6.4.7 Nestlé SA
- 6.4.8 Saputo Inc.
- 6.4.9 The Hain Celestial Group Inc.
- 6.4.10 Yakult Honsha Co. Ltd
7. KEY STRATEGIC QUESTIONS FOR DAIRY AND DAIRY ALTERNATIVE CEOS
8. APPENDIX
-
8.1 Global Overview
- 8.1.1 Overview
- 8.1.2 Porter’s Five Forces Framework
- 8.1.3 Global Value Chain Analysis
- 8.1.4 Market Dynamics (DROs)
- 8.2 Sources & References
- 8.3 List of Tables & Figures
- 8.4 Primary Insights
- 8.5 Data Pack
- 8.6 Glossary of Terms
You Can Purchase Parts Of This Report. Check Out Prices For Specific Sections
Get Price Break-up Now
List of Tables & Figures
- Figure 1:
- PER CAPITA CONSUMPTION OF YOGURT, KG, GLOBAL, 2017 - 2029
- Figure 2:
- PRODUCTION OF MILK, METRIC TONNES, GLOBAL, 2017 - 2021
- Figure 3:
- VOLUME OF YOGURT, METRIC TONNES, BY GLOBAL, 2017 - 2029
- Figure 4:
- VALUE OF YOGURT, USD MN, BY GLOBAL, 2017 - 2029
- Figure 5:
- VOLUME OF YOGURT MARKET BY PRODUCT TYPE, METRIC TONNES, GLOBAL, 2017 - 2029
- Figure 6:
- VALUE OF YOGURT MARKET BY PRODUCT TYPE, USD MN, GLOBAL, 2017 - 2029
- Figure 7:
- VOLUME SHARE OF YOGURT MARKET BY PRODUCT TYPE, %, GLOBAL, 2017 VS 2023 VS 2029
- Figure 8:
- VALUE SHARE OF YOGURT MARKET BY PRODUCT TYPE, %, GLOBAL, 2017 VS 2023 VS 2029
- Figure 9:
- VOLUME OF FLAVORED YOGURT MARKET, METRIC TONNES, GLOBAL, 2017 - 2029
- Figure 10:
- VALUE OF FLAVORED YOGURT MARKET, USD MN, GLOBAL, 2017 - 2029
- Figure 11:
- VALUE SHARE OF FLAVORED YOGURT MARKET, BY DISTRIBUTION CHANNEL , %, GLOBAL, 2022 VS 2029
- Figure 12:
- VOLUME OF UNFLAVORED YOGURT MARKET, METRIC TONNES, GLOBAL, 2017 - 2029
- Figure 13:
- VALUE OF UNFLAVORED YOGURT MARKET, USD MN, GLOBAL, 2017 - 2029
- Figure 14:
- VALUE SHARE OF UNFLAVORED YOGURT MARKET, BY DISTRIBUTION CHANNEL , %, GLOBAL, 2022 VS 2029
- Figure 15:
- VOLUME OF YOGURT MARKET BY DISTRIBUTION CHANNEL, METRIC TONNES, GLOBAL, 2017 - 2029
- Figure 16:
- VALUE OF YOGURT MARKET BY DISTRIBUTION CHANNEL, USD MN, GLOBAL, 2017 - 2029
- Figure 17:
- VOLUME SHARE OF YOGURT MARKET, BY DISTRIBUTION CHANNEL , %, GLOBAL, 2017 VS 2023 VS 2029
- Figure 18:
- VALUE SHARE OF YOGURT MARKET, BY DISTRIBUTION CHANNEL , %, GLOBAL, 2017 VS 2023 VS 2029
- Figure 19:
- VOLUME OF YOGURT MARKET BY SUB DISTRIBUTION CHANNELS, METRIC TONNES, GLOBAL, 2017 - 2029
- Figure 20:
- VALUE OF YOGURT MARKET BY SUB DISTRIBUTION CHANNELS, USD MN, GLOBAL, 2017 - 2029
- Figure 21:
- VOLUME SHARE OF YOGURT MARKET, BY SUB DISTRIBUTION CHANNELS , %, GLOBAL, 2017 VS 2023 VS 2029
- Figure 22:
- VALUE SHARE OF YOGURT MARKET, BY SUB DISTRIBUTION CHANNELS , %, GLOBAL, 2017 VS 2023 VS 2029
- Figure 23:
- VOLUME OF YOGURT MARKET SOLD VIA CONVENIENCE STORES, METRIC TONNES, GLOBAL, 2017 - 2029
- Figure 24:
- VALUE OF YOGURT MARKET SOLD VIA CONVENIENCE STORES, USD MN, GLOBAL, 2017 - 2029
- Figure 25:
- VALUE SHARE OF YOGURT MARKET, SOLD VIA CONVENIENCE STORES, BY CATEGORY , %, GLOBAL, 2022 VS 2029
- Figure 26:
- VOLUME OF YOGURT MARKET SOLD VIA ONLINE RETAIL, METRIC TONNES, GLOBAL, 2017 - 2029
- Figure 27:
- VALUE OF YOGURT MARKET SOLD VIA ONLINE RETAIL, USD MN, GLOBAL, 2017 - 2029
- Figure 28:
- VALUE SHARE OF YOGURT MARKET, SOLD VIA ONLINE RETAIL, BY CATEGORY , %, GLOBAL, 2022 VS 2029
- Figure 29:
- VOLUME OF YOGURT MARKET SOLD VIA SPECIALIST RETAILERS, METRIC TONNES, GLOBAL, 2017 - 2029
- Figure 30:
- VALUE OF YOGURT MARKET SOLD VIA SPECIALIST RETAILERS, USD MN, GLOBAL, 2017 - 2029
- Figure 31:
- VALUE SHARE OF YOGURT MARKET, SOLD VIA SPECIALIST RETAILERS, BY CATEGORY , %, GLOBAL, 2022 VS 2029
- Figure 32:
- VOLUME OF YOGURT MARKET SOLD VIA SUPERMARKETS AND HYPERMARKETS, METRIC TONNES, GLOBAL, 2017 - 2029
- Figure 33:
- VALUE OF YOGURT MARKET SOLD VIA SUPERMARKETS AND HYPERMARKETS, USD MN, GLOBAL, 2017 - 2029
- Figure 34:
- VALUE SHARE OF YOGURT MARKET, SOLD VIA SUPERMARKETS AND HYPERMARKETS, BY CATEGORY , %, GLOBAL, 2022 VS 2029
- Figure 35:
- VOLUME OF YOGURT MARKET SOLD VIA OTHERS (WAREHOUSE CLUBS, GAS STATIONS, ETC.), METRIC TONNES, GLOBAL, 2017 - 2029
- Figure 36:
- VALUE OF YOGURT MARKET SOLD VIA OTHERS (WAREHOUSE CLUBS, GAS STATIONS, ETC.), USD MN, GLOBAL, 2017 - 2029
- Figure 37:
- VALUE SHARE OF YOGURT MARKET, SOLD VIA OTHERS (WAREHOUSE CLUBS, GAS STATIONS, ETC.), BY CATEGORY , %, GLOBAL, 2022 VS 2029
- Figure 38:
- VOLUME OF YOGURT MARKET SOLD VIA ON-TRADE, METRIC TONNES, GLOBAL, 2017 - 2029
- Figure 39:
- VALUE OF YOGURT MARKET SOLD VIA ON-TRADE, USD MN, GLOBAL, 2017 - 2029
- Figure 40:
- VALUE SHARE OF YOGURT MARKET, SOLD VIA ON-TRADE, BY CATEGORY , %, GLOBAL, 2022 VS 2029
- Figure 41:
- VOLUME OF YOGURT MARKET BY REGION, METRIC TONNES, GLOBAL, 2017 - 2029
- Figure 42:
- VALUE OF YOGURT MARKET BY REGION, USD MN, GLOBAL, 2017 - 2029
- Figure 43:
- VOLUME SHARE OF YOGURT MARKET, BY REGION , %, GLOBAL, 2017 VS 2023 VS 2029
- Figure 44:
- VALUE SHARE OF YOGURT MARKET, BY REGION , %, GLOBAL, 2017 VS 2023 VS 2029
- Figure 45:
- VOLUME OF YOGURT MARKET BY PRODUCT TYPE, METRIC TONNES, GLOBAL, 2017 - 2029
- Figure 46:
- VALUE OF YOGURT MARKET BY PRODUCT TYPE, USD MN, GLOBAL, 2017 - 2029
- Figure 47:
- VOLUME SHARE OF YOGURT MARKET BY PRODUCT TYPE, %, GLOBAL, 2017 VS 2023 VS 2029
- Figure 48:
- VALUE SHARE OF YOGURT MARKET BY PRODUCT TYPE, %, GLOBAL, 2017 VS 2023 VS 2029
- Figure 49:
- VOLUME OF YOGURT MARKET BY DISTRIBUTION CHANNEL, METRIC TONNES, AFRICA, 2017 - 2029
- Figure 50:
- VALUE OF YOGURT MARKET BY DISTRIBUTION CHANNEL, USD MN, AFRICA, 2017 - 2029
- Figure 51:
- VOLUME SHARE OF YOGURT MARKET, BY DISTRIBUTION CHANNEL , %, AFRICA, 2017 VS 2023 VS 2029
- Figure 52:
- VALUE SHARE OF YOGURT MARKET, BY DISTRIBUTION CHANNEL , %, AFRICA, 2017 VS 2023 VS 2029
- Figure 53:
- VOLUME OF YOGURT MARKET BY COUNTRY, METRIC TONNES, AFRICA, 2017 - 2029
- Figure 54:
- VALUE OF YOGURT MARKET BY COUNTRY, USD MN, AFRICA, 2017 - 2029
- Figure 55:
- VOLUME SHARE OF YOGURT MARKET, BY COUNTRY , %, AFRICA, 2017 VS 2023 VS 2029
- Figure 56:
- VALUE SHARE OF YOGURT MARKET, BY COUNTRY , %, AFRICA, 2017 VS 2023 VS 2029
- Figure 57:
- VOLUME OF YOGURT MARKET, METRIC TONNES, EGYPT, 2017 - 2029
- Figure 58:
- VALUE OF YOGURT MARKET, USD MN, EGYPT, 2017 - 2029
- Figure 59:
- VALUE SHARE OF YOGURT MARKET, BY PRODUCT TYPE , %, EGYPT, GLOBAL, 2022 VS 2029
- Figure 60:
- VOLUME OF YOGURT MARKET, METRIC TONNES, NIGERIA, 2017 - 2029
- Figure 61:
- VALUE OF YOGURT MARKET, USD MN, NIGERIA, 2017 - 2029
- Figure 62:
- VALUE SHARE OF YOGURT MARKET, BY PRODUCT TYPE , %, NIGERIA, GLOBAL, 2022 VS 2029
- Figure 63:
- VOLUME OF YOGURT MARKET, METRIC TONNES, SOUTH AFRICA, 2017 - 2029
- Figure 64:
- VALUE OF YOGURT MARKET, USD MN, SOUTH AFRICA, 2017 - 2029
- Figure 65:
- VALUE SHARE OF YOGURT MARKET, BY PRODUCT TYPE , %, SOUTH AFRICA, GLOBAL, 2022 VS 2029
- Figure 66:
- VOLUME OF YOGURT MARKET, METRIC TONNES, REST OF AFRICA, 2017 - 2029
- Figure 67:
- VALUE OF YOGURT MARKET, USD MN, REST OF AFRICA, 2017 - 2029
- Figure 68:
- VALUE SHARE OF YOGURT MARKET, BY PRODUCT TYPE , %, REST OF AFRICA, GLOBAL, 2022 VS 2029
- Figure 69:
- VOLUME OF YOGURT MARKET BY PRODUCT TYPE, METRIC TONNES, GLOBAL, 2017 - 2029
- Figure 70:
- VALUE OF YOGURT MARKET BY PRODUCT TYPE, USD MN, GLOBAL, 2017 - 2029
- Figure 71:
- VOLUME SHARE OF YOGURT MARKET BY PRODUCT TYPE, %, GLOBAL, 2017 VS 2023 VS 2029
- Figure 72:
- VALUE SHARE OF YOGURT MARKET BY PRODUCT TYPE, %, GLOBAL, 2017 VS 2023 VS 2029
- Figure 73:
- VOLUME OF YOGURT MARKET BY DISTRIBUTION CHANNEL, METRIC TONNES, ASIA-PACIFIC, 2017 - 2029
- Figure 74:
- VALUE OF YOGURT MARKET BY DISTRIBUTION CHANNEL, USD MN, ASIA-PACIFIC, 2017 - 2029
- Figure 75:
- VOLUME SHARE OF YOGURT MARKET, BY DISTRIBUTION CHANNEL , %, ASIA-PACIFIC, 2017 VS 2023 VS 2029
- Figure 76:
- VALUE SHARE OF YOGURT MARKET, BY DISTRIBUTION CHANNEL , %, ASIA-PACIFIC, 2017 VS 2023 VS 2029
- Figure 77:
- VOLUME OF YOGURT MARKET BY COUNTRY, METRIC TONNES, ASIA-PACIFIC, 2017 - 2029
- Figure 78:
- VALUE OF YOGURT MARKET BY COUNTRY, USD MN, ASIA-PACIFIC, 2017 - 2029
- Figure 79:
- VOLUME SHARE OF YOGURT MARKET, BY COUNTRY , %, ASIA-PACIFIC, 2017 VS 2023 VS 2029
- Figure 80:
- VALUE SHARE OF YOGURT MARKET, BY COUNTRY , %, ASIA-PACIFIC, 2017 VS 2023 VS 2029
- Figure 81:
- VOLUME OF YOGURT MARKET, METRIC TONNES, AUSTRALIA, 2017 - 2029
- Figure 82:
- VALUE OF YOGURT MARKET, USD MN, AUSTRALIA, 2017 - 2029
- Figure 83:
- VALUE SHARE OF YOGURT MARKET, BY PRODUCT TYPE , %, AUSTRALIA, GLOBAL, 2022 VS 2029
- Figure 84:
- VOLUME OF YOGURT MARKET, METRIC TONNES, CHINA, 2017 - 2029
- Figure 85:
- VALUE OF YOGURT MARKET, USD MN, CHINA, 2017 - 2029
- Figure 86:
- VALUE SHARE OF YOGURT MARKET, BY PRODUCT TYPE , %, CHINA, GLOBAL, 2022 VS 2029
- Figure 87:
- VOLUME OF YOGURT MARKET, METRIC TONNES, INDIA, 2017 - 2029
- Figure 88:
- VALUE OF YOGURT MARKET, USD MN, INDIA, 2017 - 2029
- Figure 89:
- VALUE SHARE OF YOGURT MARKET, BY PRODUCT TYPE , %, INDIA, GLOBAL, 2022 VS 2029
- Figure 90:
- VOLUME OF YOGURT MARKET, METRIC TONNES, INDONESIA, 2017 - 2029
- Figure 91:
- VALUE OF YOGURT MARKET, USD MN, INDONESIA, 2017 - 2029
- Figure 92:
- VALUE SHARE OF YOGURT MARKET, BY PRODUCT TYPE , %, INDONESIA, GLOBAL, 2022 VS 2029
- Figure 93:
- VOLUME OF YOGURT MARKET, METRIC TONNES, JAPAN, 2017 - 2029
- Figure 94:
- VALUE OF YOGURT MARKET, USD MN, JAPAN, 2017 - 2029
- Figure 95:
- VALUE SHARE OF YOGURT MARKET, BY PRODUCT TYPE , %, JAPAN, GLOBAL, 2022 VS 2029
- Figure 96:
- VOLUME OF YOGURT MARKET, METRIC TONNES, MALAYSIA, 2017 - 2029
- Figure 97:
- VALUE OF YOGURT MARKET, USD MN, MALAYSIA, 2017 - 2029
- Figure 98:
- VALUE SHARE OF YOGURT MARKET, BY PRODUCT TYPE , %, MALAYSIA, GLOBAL, 2022 VS 2029
- Figure 99:
- VOLUME OF YOGURT MARKET, METRIC TONNES, NEW ZEALAND, 2017 - 2029
- Figure 100:
- VALUE OF YOGURT MARKET, USD MN, NEW ZEALAND, 2017 - 2029
- Figure 101:
- VALUE SHARE OF YOGURT MARKET, BY PRODUCT TYPE , %, NEW ZEALAND, GLOBAL, 2022 VS 2029
- Figure 102:
- VOLUME OF YOGURT MARKET, METRIC TONNES, PAKISTAN, 2017 - 2029
- Figure 103:
- VALUE OF YOGURT MARKET, USD MN, PAKISTAN, 2017 - 2029
- Figure 104:
- VALUE SHARE OF YOGURT MARKET, BY PRODUCT TYPE , %, PAKISTAN, GLOBAL, 2022 VS 2029
- Figure 105:
- VOLUME OF YOGURT MARKET, METRIC TONNES, SOUTH KOREA, 2017 - 2029
- Figure 106:
- VALUE OF YOGURT MARKET, USD MN, SOUTH KOREA, 2017 - 2029
- Figure 107:
- VALUE SHARE OF YOGURT MARKET, BY PRODUCT TYPE , %, SOUTH KOREA, GLOBAL, 2022 VS 2029
- Figure 108:
- VOLUME OF YOGURT MARKET, METRIC TONNES, REST OF ASIA PACIFIC, 2017 - 2029
- Figure 109:
- VALUE OF YOGURT MARKET, USD MN, REST OF ASIA PACIFIC, 2017 - 2029
- Figure 110:
- VALUE SHARE OF YOGURT MARKET, BY PRODUCT TYPE , %, REST OF ASIA PACIFIC, GLOBAL, 2022 VS 2029
- Figure 111:
- VOLUME OF YOGURT MARKET BY PRODUCT TYPE, METRIC TONNES, GLOBAL, 2017 - 2029
- Figure 112:
- VALUE OF YOGURT MARKET BY PRODUCT TYPE, USD MN, GLOBAL, 2017 - 2029
- Figure 113:
- VOLUME SHARE OF YOGURT MARKET BY PRODUCT TYPE, %, GLOBAL, 2017 VS 2023 VS 2029
- Figure 114:
- VALUE SHARE OF YOGURT MARKET BY PRODUCT TYPE, %, GLOBAL, 2017 VS 2023 VS 2029
- Figure 115:
- VOLUME OF YOGURT MARKET BY DISTRIBUTION CHANNEL, METRIC TONNES, EUROPE, 2017 - 2029
- Figure 116:
- VALUE OF YOGURT MARKET BY DISTRIBUTION CHANNEL, USD MN, EUROPE, 2017 - 2029
- Figure 117:
- VOLUME SHARE OF YOGURT MARKET, BY DISTRIBUTION CHANNEL , %, EUROPE, 2017 VS 2023 VS 2029
- Figure 118:
- VALUE SHARE OF YOGURT MARKET, BY DISTRIBUTION CHANNEL , %, EUROPE, 2017 VS 2023 VS 2029
- Figure 119:
- VOLUME OF YOGURT MARKET BY COUNTRY, METRIC TONNES, EUROPE, 2017 - 2029
- Figure 120:
- VALUE OF YOGURT MARKET BY COUNTRY, USD MN, EUROPE, 2017 - 2029
- Figure 121:
- VOLUME SHARE OF YOGURT MARKET, BY COUNTRY , %, EUROPE, 2017 VS 2023 VS 2029
- Figure 122:
- VALUE SHARE OF YOGURT MARKET, BY COUNTRY , %, EUROPE, 2017 VS 2023 VS 2029
- Figure 123:
- VOLUME OF YOGURT MARKET, METRIC TONNES, BELGIUM, 2017 - 2029
- Figure 124:
- VALUE OF YOGURT MARKET, USD MN, BELGIUM, 2017 - 2029
- Figure 125:
- VALUE SHARE OF YOGURT MARKET, BY PRODUCT TYPE , %, BELGIUM, GLOBAL, 2022 VS 2029
- Figure 126:
- VOLUME OF YOGURT MARKET, METRIC TONNES, FRANCE, 2017 - 2029
- Figure 127:
- VALUE OF YOGURT MARKET, USD MN, FRANCE, 2017 - 2029
- Figure 128:
- VALUE SHARE OF YOGURT MARKET, BY PRODUCT TYPE , %, FRANCE, GLOBAL, 2022 VS 2029
- Figure 129:
- VOLUME OF YOGURT MARKET, METRIC TONNES, GERMANY, 2017 - 2029
- Figure 130:
- VALUE OF YOGURT MARKET, USD MN, GERMANY, 2017 - 2029
- Figure 131:
- VALUE SHARE OF YOGURT MARKET, BY PRODUCT TYPE , %, GERMANY, GLOBAL, 2022 VS 2029
- Figure 132:
- VOLUME OF YOGURT MARKET, METRIC TONNES, ITALY, 2017 - 2029
- Figure 133:
- VALUE OF YOGURT MARKET, USD MN, ITALY, 2017 - 2029
- Figure 134:
- VALUE SHARE OF YOGURT MARKET, BY PRODUCT TYPE , %, ITALY, GLOBAL, 2022 VS 2029
- Figure 135:
- VOLUME OF YOGURT MARKET, METRIC TONNES, NETHERLANDS, 2017 - 2029
- Figure 136:
- VALUE OF YOGURT MARKET, USD MN, NETHERLANDS, 2017 - 2029
- Figure 137:
- VALUE SHARE OF YOGURT MARKET, BY PRODUCT TYPE , %, NETHERLANDS, GLOBAL, 2022 VS 2029
- Figure 138:
- VOLUME OF YOGURT MARKET, METRIC TONNES, RUSSIA, 2017 - 2029
- Figure 139:
- VALUE OF YOGURT MARKET, USD MN, RUSSIA, 2017 - 2029
- Figure 140:
- VALUE SHARE OF YOGURT MARKET, BY PRODUCT TYPE , %, RUSSIA, GLOBAL, 2022 VS 2029
- Figure 141:
- VOLUME OF YOGURT MARKET, METRIC TONNES, SPAIN, 2017 - 2029
- Figure 142:
- VALUE OF YOGURT MARKET, USD MN, SPAIN, 2017 - 2029
- Figure 143:
- VALUE SHARE OF YOGURT MARKET, BY PRODUCT TYPE , %, SPAIN, GLOBAL, 2022 VS 2029
- Figure 144:
- VOLUME OF YOGURT MARKET, METRIC TONNES, TURKEY, 2017 - 2029
- Figure 145:
- VALUE OF YOGURT MARKET, USD MN, TURKEY, 2017 - 2029
- Figure 146:
- VALUE SHARE OF YOGURT MARKET, BY PRODUCT TYPE , %, TURKEY, GLOBAL, 2022 VS 2029
- Figure 147:
- VOLUME OF YOGURT MARKET, METRIC TONNES, UNITED KINGDOM, 2017 - 2029
- Figure 148:
- VALUE OF YOGURT MARKET, USD MN, UNITED KINGDOM, 2017 - 2029
- Figure 149:
- VALUE SHARE OF YOGURT MARKET, BY PRODUCT TYPE , %, UNITED KINGDOM, GLOBAL, 2022 VS 2029
- Figure 150:
- VOLUME OF YOGURT MARKET, METRIC TONNES, REST OF EUROPE, 2017 - 2029
- Figure 151:
- VALUE OF YOGURT MARKET, USD MN, REST OF EUROPE, 2017 - 2029
- Figure 152:
- VALUE SHARE OF YOGURT MARKET, BY PRODUCT TYPE , %, REST OF EUROPE, GLOBAL, 2022 VS 2029
- Figure 153:
- VOLUME OF YOGURT MARKET BY PRODUCT TYPE, METRIC TONNES, GLOBAL, 2017 - 2029
- Figure 154:
- VALUE OF YOGURT MARKET BY PRODUCT TYPE, USD MN, GLOBAL, 2017 - 2029
- Figure 155:
- VOLUME SHARE OF YOGURT MARKET BY PRODUCT TYPE, %, GLOBAL, 2017 VS 2023 VS 2029
- Figure 156:
- VALUE SHARE OF YOGURT MARKET BY PRODUCT TYPE, %, GLOBAL, 2017 VS 2023 VS 2029
- Figure 157:
- VOLUME OF YOGURT MARKET BY DISTRIBUTION CHANNEL, METRIC TONNES, MIDDLE EAST, 2017 - 2029
- Figure 158:
- VALUE OF YOGURT MARKET BY DISTRIBUTION CHANNEL, USD MN, MIDDLE EAST, 2017 - 2029
- Figure 159:
- VOLUME SHARE OF YOGURT MARKET, BY DISTRIBUTION CHANNEL , %, MIDDLE EAST, 2017 VS 2023 VS 2029
- Figure 160:
- VALUE SHARE OF YOGURT MARKET, BY DISTRIBUTION CHANNEL , %, MIDDLE EAST, 2017 VS 2023 VS 2029
- Figure 161:
- VOLUME OF YOGURT MARKET BY COUNTRY, METRIC TONNES, MIDDLE EAST, 2017 - 2029
- Figure 162:
- VALUE OF YOGURT MARKET BY COUNTRY, USD MN, MIDDLE EAST, 2017 - 2029
- Figure 163:
- VOLUME SHARE OF YOGURT MARKET, BY COUNTRY , %, MIDDLE EAST, 2017 VS 2023 VS 2029
- Figure 164:
- VALUE SHARE OF YOGURT MARKET, BY COUNTRY , %, MIDDLE EAST, 2017 VS 2023 VS 2029
- Figure 165:
- VOLUME OF YOGURT MARKET, METRIC TONNES, BAHRAIN, 2017 - 2029
- Figure 166:
- VALUE OF YOGURT MARKET, USD MN, BAHRAIN, 2017 - 2029
- Figure 167:
- VALUE SHARE OF YOGURT MARKET, BY PRODUCT TYPE , %, BAHRAIN, GLOBAL, 2022 VS 2029
- Figure 168:
- VOLUME OF YOGURT MARKET, METRIC TONNES, IRAN, 2017 - 2029
- Figure 169:
- VALUE OF YOGURT MARKET, USD MN, IRAN, 2017 - 2029
- Figure 170:
- VALUE SHARE OF YOGURT MARKET, BY PRODUCT TYPE , %, IRAN, GLOBAL, 2022 VS 2029
- Figure 171:
- VOLUME OF YOGURT MARKET, METRIC TONNES, KUWAIT, 2017 - 2029
- Figure 172:
- VALUE OF YOGURT MARKET, USD MN, KUWAIT, 2017 - 2029
- Figure 173:
- VALUE SHARE OF YOGURT MARKET, BY PRODUCT TYPE , %, KUWAIT, GLOBAL, 2022 VS 2029
- Figure 174:
- VOLUME OF YOGURT MARKET, METRIC TONNES, OMAN, 2017 - 2029
- Figure 175:
- VALUE OF YOGURT MARKET, USD MN, OMAN, 2017 - 2029
- Figure 176:
- VALUE SHARE OF YOGURT MARKET, BY PRODUCT TYPE , %, OMAN, GLOBAL, 2022 VS 2029
- Figure 177:
- VOLUME OF YOGURT MARKET, METRIC TONNES, QATAR, 2017 - 2029
- Figure 178:
- VALUE OF YOGURT MARKET, USD MN, QATAR, 2017 - 2029
- Figure 179:
- VALUE SHARE OF YOGURT MARKET, BY PRODUCT TYPE , %, QATAR, GLOBAL, 2022 VS 2029
- Figure 180:
- VOLUME OF YOGURT MARKET, METRIC TONNES, SAUDI ARABIA, 2017 - 2029
- Figure 181:
- VALUE OF YOGURT MARKET, USD MN, SAUDI ARABIA, 2017 - 2029
- Figure 182:
- VALUE SHARE OF YOGURT MARKET, BY PRODUCT TYPE , %, SAUDI ARABIA, GLOBAL, 2022 VS 2029
- Figure 183:
- VOLUME OF YOGURT MARKET, METRIC TONNES, UNITED ARAB EMIRATES, 2017 - 2029
- Figure 184:
- VALUE OF YOGURT MARKET, USD MN, UNITED ARAB EMIRATES, 2017 - 2029
- Figure 185:
- VALUE SHARE OF YOGURT MARKET, BY PRODUCT TYPE , %, UNITED ARAB EMIRATES, GLOBAL, 2022 VS 2029
- Figure 186:
- VOLUME OF YOGURT MARKET, METRIC TONNES, REST OF MIDDLE EAST, 2017 - 2029
- Figure 187:
- VALUE OF YOGURT MARKET, USD MN, REST OF MIDDLE EAST, 2017 - 2029
- Figure 188:
- VALUE SHARE OF YOGURT MARKET, BY PRODUCT TYPE , %, REST OF MIDDLE EAST, GLOBAL, 2022 VS 2029
- Figure 189:
- VOLUME OF YOGURT MARKET BY PRODUCT TYPE, METRIC TONNES, GLOBAL, 2017 - 2029
- Figure 190:
- VALUE OF YOGURT MARKET BY PRODUCT TYPE, USD MN, GLOBAL, 2017 - 2029
- Figure 191:
- VOLUME SHARE OF YOGURT MARKET BY PRODUCT TYPE, %, GLOBAL, 2017 VS 2023 VS 2029
- Figure 192:
- VALUE SHARE OF YOGURT MARKET BY PRODUCT TYPE, %, GLOBAL, 2017 VS 2023 VS 2029
- Figure 193:
- VOLUME OF YOGURT MARKET BY DISTRIBUTION CHANNEL, METRIC TONNES, NORTH AMERICA, 2017 - 2029
- Figure 194:
- VALUE OF YOGURT MARKET BY DISTRIBUTION CHANNEL, USD MN, NORTH AMERICA, 2017 - 2029
- Figure 195:
- VOLUME SHARE OF YOGURT MARKET, BY DISTRIBUTION CHANNEL , %, NORTH AMERICA, 2017 VS 2023 VS 2029
- Figure 196:
- VALUE SHARE OF YOGURT MARKET, BY DISTRIBUTION CHANNEL , %, NORTH AMERICA, 2017 VS 2023 VS 2029
- Figure 197:
- VOLUME OF YOGURT MARKET BY COUNTRY, METRIC TONNES, NORTH AMERICA, 2017 - 2029
- Figure 198:
- VALUE OF YOGURT MARKET BY COUNTRY, USD MN, NORTH AMERICA, 2017 - 2029
- Figure 199:
- VOLUME SHARE OF YOGURT MARKET, BY COUNTRY , %, NORTH AMERICA, 2017 VS 2023 VS 2029
- Figure 200:
- VALUE SHARE OF YOGURT MARKET, BY COUNTRY , %, NORTH AMERICA, 2017 VS 2023 VS 2029
- Figure 201:
- VOLUME OF YOGURT MARKET, METRIC TONNES, CANADA, 2017 - 2029
- Figure 202:
- VALUE OF YOGURT MARKET, USD MN, CANADA, 2017 - 2029
- Figure 203:
- VALUE SHARE OF YOGURT MARKET, BY PRODUCT TYPE , %, CANADA, GLOBAL, 2022 VS 2029
- Figure 204:
- VOLUME OF YOGURT MARKET, METRIC TONNES, MEXICO, 2017 - 2029
- Figure 205:
- VALUE OF YOGURT MARKET, USD MN, MEXICO, 2017 - 2029
- Figure 206:
- VALUE SHARE OF YOGURT MARKET, BY PRODUCT TYPE , %, MEXICO, GLOBAL, 2022 VS 2029
- Figure 207:
- VOLUME OF YOGURT MARKET, METRIC TONNES, UNITED STATES, 2017 - 2029
- Figure 208:
- VALUE OF YOGURT MARKET, USD MN, UNITED STATES, 2017 - 2029
- Figure 209:
- VALUE SHARE OF YOGURT MARKET, BY PRODUCT TYPE , %, UNITED STATES, GLOBAL, 2022 VS 2029
- Figure 210:
- VOLUME OF YOGURT MARKET, METRIC TONNES, REST OF NORTH AMERICA, 2017 - 2029
- Figure 211:
- VALUE OF YOGURT MARKET, USD MN, REST OF NORTH AMERICA, 2017 - 2029
- Figure 212:
- VALUE SHARE OF YOGURT MARKET, BY PRODUCT TYPE , %, REST OF NORTH AMERICA, GLOBAL, 2022 VS 2029
- Figure 213:
- VOLUME OF YOGURT MARKET BY PRODUCT TYPE, METRIC TONNES, GLOBAL, 2017 - 2029
- Figure 214:
- VALUE OF YOGURT MARKET BY PRODUCT TYPE, USD MN, GLOBAL, 2017 - 2029
- Figure 215:
- VOLUME SHARE OF YOGURT MARKET BY PRODUCT TYPE, %, GLOBAL, 2017 VS 2023 VS 2029
- Figure 216:
- VALUE SHARE OF YOGURT MARKET BY PRODUCT TYPE, %, GLOBAL, 2017 VS 2023 VS 2029
- Figure 217:
- VOLUME OF YOGURT MARKET BY DISTRIBUTION CHANNEL, METRIC TONNES, SOUTH AMERICA, 2017 - 2029
- Figure 218:
- VALUE OF YOGURT MARKET BY DISTRIBUTION CHANNEL, USD MN, SOUTH AMERICA, 2017 - 2029
- Figure 219:
- VOLUME SHARE OF YOGURT MARKET, BY DISTRIBUTION CHANNEL , %, SOUTH AMERICA, 2017 VS 2023 VS 2029
- Figure 220:
- VALUE SHARE OF YOGURT MARKET, BY DISTRIBUTION CHANNEL , %, SOUTH AMERICA, 2017 VS 2023 VS 2029
- Figure 221:
- VOLUME OF YOGURT MARKET BY COUNTRY, METRIC TONNES, SOUTH AMERICA, 2017 - 2029
- Figure 222:
- VALUE OF YOGURT MARKET BY COUNTRY, USD MN, SOUTH AMERICA, 2017 - 2029
- Figure 223:
- VOLUME SHARE OF YOGURT MARKET, BY COUNTRY , %, SOUTH AMERICA, 2017 VS 2023 VS 2029
- Figure 224:
- VALUE SHARE OF YOGURT MARKET, BY COUNTRY , %, SOUTH AMERICA, 2017 VS 2023 VS 2029
- Figure 225:
- VOLUME OF YOGURT MARKET, METRIC TONNES, ARGENTINA, 2017 - 2029
- Figure 226:
- VALUE OF YOGURT MARKET, USD MN, ARGENTINA, 2017 - 2029
- Figure 227:
- VALUE SHARE OF YOGURT MARKET, BY PRODUCT TYPE , %, ARGENTINA, GLOBAL, 2022 VS 2029
- Figure 228:
- VOLUME OF YOGURT MARKET, METRIC TONNES, BRAZIL, 2017 - 2029
- Figure 229:
- VALUE OF YOGURT MARKET, USD MN, BRAZIL, 2017 - 2029
- Figure 230:
- VALUE SHARE OF YOGURT MARKET, BY PRODUCT TYPE , %, BRAZIL, GLOBAL, 2022 VS 2029
- Figure 231:
- VOLUME OF YOGURT MARKET, METRIC TONNES, REST OF SOUTH AMERICA, 2017 - 2029
- Figure 232:
- VALUE OF YOGURT MARKET, USD MN, REST OF SOUTH AMERICA, 2017 - 2029
- Figure 233:
- VALUE SHARE OF YOGURT MARKET, BY PRODUCT TYPE , %, REST OF SOUTH AMERICA, GLOBAL, 2022 VS 2029
- Figure 234:
- MOST ACTIVE COMPANIES BY NUMBER OF STRATEGIC MOVES, COUNT, GLOBAL, 2017 - 2029
- Figure 235:
- MOST ADOPTED STRATEGIES, COUNT, GLOBAL, 2017 - 2029
- Figure 236:
- VALUE SHARE OF MAJOR PLAYERS, %, GLOBAL
Yogurt Industry Segmentation
Flavored Yogurt, Unflavored Yogurt are covered as segments by Product Type. Off-Trade, On-Trade are covered as segments by Distribution Channel. Africa, Asia-Pacific, Europe, Middle East, North America, South America are covered as segments by Region.| Product Type | Flavored Yogurt | ||
| Unflavored Yogurt | |||
| Distribution Channel | Off-Trade | Convenience Stores | |
| Online Retail | |||
| Specialist Retailers | |||
| Supermarkets and Hypermarkets | |||
| Others (Warehouse clubs, gas stations, etc.) | |||
| On-Trade | |||
| Region | Africa | By Product Type | |
| By Distribution Channel | |||
| Egypt | |||
| Nigeria | |||
| South Africa | |||
| Rest of Africa | |||
| Asia-Pacific | By Product Type | ||
| By Distribution Channel | |||
| Australia | |||
| China | |||
| India | |||
| Indonesia | |||
| Japan | |||
| Malaysia | |||
| New Zealand | |||
| Pakistan | |||
| South Korea | |||
| Rest of Asia Pacific | |||
| Europe | By Product Type | ||
| By Distribution Channel | |||
| Belgium | |||
| France | |||
| Germany | |||
| Italy | |||
| Netherlands | |||
| Russia | |||
| Spain | |||
| Turkey | |||
| United Kingdom | |||
| Rest of Europe | |||
| Middle East | By Product Type | ||
| By Distribution Channel | |||
| Bahrain | |||
| Iran | |||
| Kuwait | |||
| Oman | |||
| Qatar | |||
| Saudi Arabia | |||
| United Arab Emirates | |||
| Rest of Middle East | |||
| North America | By Product Type | ||
| By Distribution Channel | |||
| Canada | |||
| Mexico | |||
| United States | |||
| Rest of North America | |||
| South America | By Product Type | ||
| By Distribution Channel | |||
| Argentina | |||
| Brazil | |||
| Rest of South America | |||
Need A Different Region or Segment?
Customize Now
Market Definition
- Butter - Butter is a yellow-to-white solid emulsion of fat globules, water, and inorganic salts produced by churning the cream from cows’ milk
- Category - Milk
- Country - All
- Dairy - Dairy product include milk and any of the foods made from milk, including butter, cheese, ice cream, yogurt, and condensed and dried milk.
- Distribution Channel - All
- Frozen Desserts - Frozen dairy dessert means and includes products containing milk or cream and other ingredients which are frozen or semi-frozen prior to consumption, such as ice milk or sherbet, including frozen dairy desserts for special dietary purposes, and sorbet
- Industry - Dairy Alternatives
- Product Type - All
- Region - Asia Pacific
- Report - United Kingdom Dairy Alternatives Market
- Sour Milk Drinks - Sour milk is thick, curdled milk, with a sour taste, obtained from the fermentation of milk. Sour milk drinks such as kefir, laban, buttermilk have been considered in the study
- Sub-type - All
- Sub_distribution Channels - All
- Dairy Alternatives - Dairy alternatives are foods that are made from plant-based milk/oils instead of their usual animal products, such as cheese, butter, milk, ice cream, yogurt, etc. Plant-based or non-dairy milk alternative is the fast-growing segment in the newer food product development category of functional and specialty beverage across the globe.
- Non-Dairy Butter - Non dairy butter is a vegan butter alternative that is made from a mixture of plant oils. With an increase in alternative diets like vegetarianism, veganism, and gluten intolerance, plant butter is a healthy non-dairy substitute for normal butter.
- Non-Dairy Ice Cream - Plant based ice cream is a growing category. Non-dairy ice cream is a type of dessert made without any animal ingredients. This is typically considered a substitute for regular ice cream for those who cannot or do not eat animal or animal-derived products, including eggs, milk, cream, or honey.
- Plant-Based Milk - Plant based milks are milk substitutes that are made from nuts (e.g., hazelnuts, hemp seeds), seeds (e.g., sesame, walnuts, coconuts, cashews, almonds, rice, oats, etc.) or legumes (e.g., soy). Plant-based milk such as soy milk and almond milk have been popular in East Asia and the Middle East for centuries.
- Report title - Europe Dairy Alternatives Market
| Keyword | Definition |
|---|---|
| Cultured Butter | Cultured butter is prepared by having the raw butter go through chemical processing and has been added with certain emulsifiers and foreign ingredients. |
| Uncultured Butter | This type of butter is one which has not been processed in any way |
| Natural Cheese | The type of cheese in its most natural form. It is made from natural and simple products and ingredients, including fresh and natural salts, natural colors, enzymes, and high-quality milk. |
| Processed Cheese | Processed cheese undergoes the same processes as natural cheese; however, it requires more steps and many different forms of ingredients. Making processed cheese involves melting natural cheese, emulsifying it, and adding preservatives and other artificial ingredients or colorings. |
| Single Cream | Single cream contains around 18% fat. It’s a single layer of cream that appears over boiled milk. |
| Double Cream | Double cream contains 48% fat, more than double the amount of fat of single cream. It’s heavier and thicker than single cream |
| Whipping Cream | This has a much higher fat percentage than single cream (36%). Used to top cakes, pies, and puddings and as a thickener for sauces, soups, and fillings. |
| Frozen Desserts | Desserts that are meant to be eaten in frozen condition. E.g., sherbets, sorbets, frozen yogurts |
| UHT Milk (Ultra-high temperature milk) | Milk heated at a very high temperature. Ultra-high-temperature processing (UHT) of milk involves heating for 1–8 sec at 135–154°C. which kills the spore-forming pathogenic microorganism, resulting in a product with a shelf-life of several months. |
| Non-dairy butter/Plant-based butter | Butter made from plant-derived oil such as coconut, palm, etc. |
| Non-dairy Yogurt | Yogurt made from typically made from nuts, like almonds, cashews, coconuts, and even other foods like soybeans, plantains, oats, and peas |
| On-trade | It refers to restaurants, QSRs, and bars. |
| Off-trade | It refers to supermarkets, hypermarkets, on-line channels, etc. |
| Neufchatel cheese | One of the oldest kinds of cheese in France. It is a soft, slightly crumbly, mold-ripened, bloomy-rind cheese made in the Neufchâtel-en-Bray region of Normandy. |
| Flexitarian | It refers to a consumer preferring a semi-vegetarian diet, that is centered on plant foods with limited or occasional inclusion of meat. |
| Lactose Intolerance | Lactose intolerance is a reaction in digestive system to lactose, the sugar in milk. It causes uncomfortable symptoms in response to the consumption of dairy products. |
| Cream Cheese | Cream cheese is a soft and creamy fresh cheese with a tangy taste made from milk and cream. |
| Sorbets | Sorbet is a frozen dessert made using ice combined with fruit juice, fruit purée, or other ingredients, such as wine, liqueur, or honey. |
| Sherbet | Sherbet is a sweetened frozen dessert made with fruit and some sort of dairy product such as milk or cream. |
| Shelf stable | Foods that can be safely stored at room temperature, or "on the shelf," for at least one year and do not have to be cooked or refrigerated to eat safely. |
| DSD | Direct Store Delivery is the process in supply chain management wherein the product is delivered from manufacturing plant directly to the retailer. |
| OU Kosher | Orthodox Union Kosher is a kosher certification agency based in New York City. |
| Gelato | Gelato is a frozen creamy dessert made with milk, heavy cream and sugar. |
| Grass-fed Cows | Grass-fed cows are allowed to graze in pastures, where they eat a variety of grasses and clover. |
Need More Details on Market Definition?
Ask a Question
Research Methodology
Mordor Intelligence follows a four-step methodology in all our reports.
- Step-1: Identify Key Variables: In order to build a robust forecasting methodology, the variables and factors identified in Step 1 are tested against available historical market numbers. Through an iterative process, the variables required for market forecast are set, and the model is built on the basis of these variables.
- Step-2: Build a Market Model: Market-size estimations for the forecast years are in nominal terms. Inflation is not a part of the pricing, and the average selling price (ASP) is kept constant throughout the forecast period for each country.
- Step-3: Validate and Finalize: In this important step, all market numbers, variables, and analyst calls are validated through an extensive network of primary research experts from the market studied. The respondents are selected across levels and functions to generate a holistic picture of the market studied.
- Step-4: Research Outputs: Syndicated Reports, Custom Consulting Assignments, Databases & Subscription Platforms

Get More Details On Research Methodology
Download PDF


