
X-ray Films Market Size and Share
Market Overview
| Study Period | 2020 - 2031 |
|---|---|
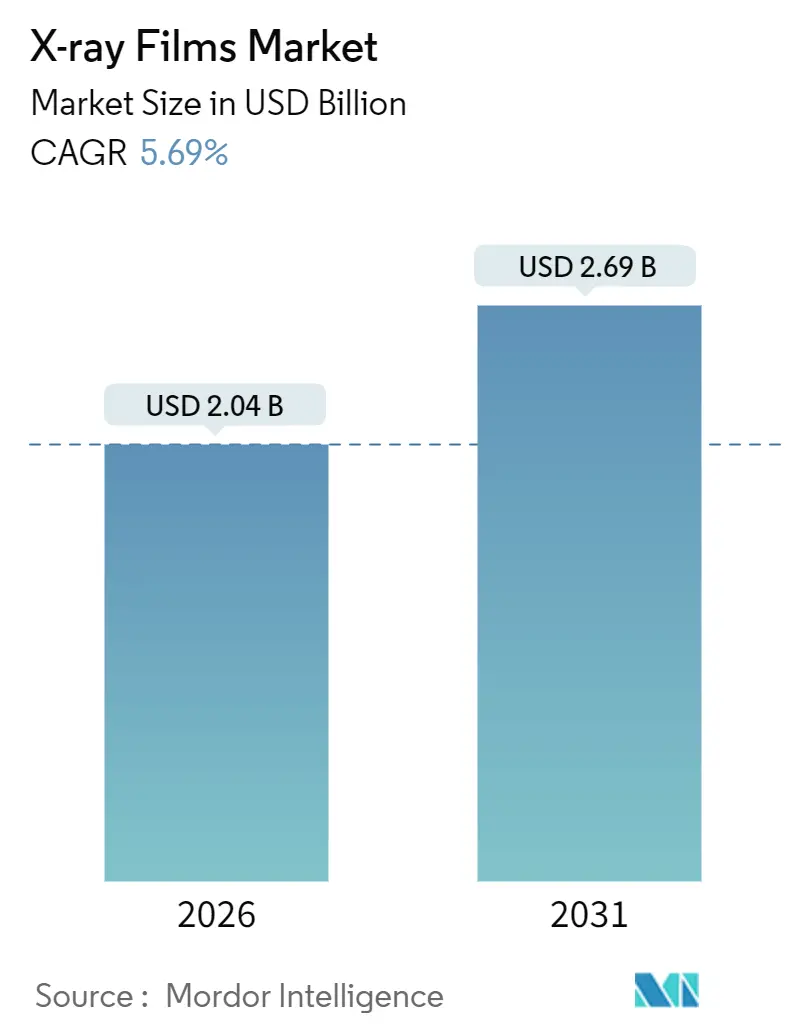
| Market Size (2026) | USD 2.04 Billion |
| Market Size (2031) | USD 2.69 Billion |
| Growth Rate (2026 - 2031) | 5.69% CAGR |
| Fastest Growing Market | Africa |
| Largest Market | Asia Pacific |
| Market Concentration | Medium |
Major Players *Disclaimer: Major Players sorted in no particular order Image © Mordor Intelligence. Reuse requires attribution under CC BY 4.0. | |
X-ray Films Market Analysis by Mordor Intelligence
The X-ray films market size is valued at USD 2.04 billion in 2026 and is projected to reach USD 2.69 billion by 2031, reflecting a 5.69% CAGR throughout the forecast period. Structural demand endures because capital-constrained hospitals in emerging economies cannot always finance flat-panel detectors, industrial codes still mandate film-based archives, and silver recovery offsets disposal costs. Hospitals keep legacy analog suites active while diagnostic centers expand outpatient volumes, and industrial users preserve film workflows for long-term traceability. Vendor strategies now blend digital portfolios with selective film lines, keeping consumables available for price-sensitive buyers. Environmental rules on silver discharge simultaneously raise compliance costs and heighten the economic case for closed-loop recovery systems.
Key Report Takeaways
- By end user, hospitals accounted for 59.23% of the X-ray films market share in 2025, while diagnostic centers are advancing at a 6.72% CAGR through 2031.
- By film type, dry film led with 57.78% of the X-ray films market share in 2025 and is forecast to grow at a 5.82% CAGR.
- By film sensitivity, green film captured 46.71% of 2025 sales, whereas clear film is set to expand at a 6.44% CAGR.
- By film size, the 14 × 17 inch format commanded 39.66% share in 2025, and the 8 × 10 inch segment is rising at a 6.67% CAGR.
- By geography, Asia-Pacific accounted for 52.39% of 2025 revenue, and Africa is poised to grow at a 6.61% CAGR through 2031.
Note: Market size and forecast figures in this report are generated using Mordor Intelligence’s proprietary estimation framework, updated with the latest available data and insights as of January 2026.
Global X-ray Films Market Trends and Insights
Drivers Impact Analysis*
| Driver | (~) % Impact on CAGR Forecast | Geographic Relevance | Impact Timeline |
|---|---|---|---|
| Continued adoption of traditional X-ray equipment in developing economies | +1.2% | Asia-Pacific, Africa, South America | Medium term (2-4 years) |
| Cost-effectiveness of film in low-resource settings | +0.9% | Africa, South Asia, Southeast Asia | Short term (≤ 2 years) |
| Ongoing demand for hard-copy imaging records for legal and clinical documentation | +0.6% | Global, concentrated in Middle East and Africa | Long term (≥ 4 years) |
| Expansion of industrial non-destructive testing requiring film radiography | +0.8% | North America, Europe, Asia-Pacific industrial hubs | Medium term (2-4 years) |
| Silver recovery economics improving film lifecycle value | +0.5% | Global, emphasis on Europe and North America | Long term (≥ 4 years) |
| Rising veterinary imaging volumes in emerging markets sustaining film demand | +0.4% | Asia-Pacific, South America, Africa | Medium term (2-4 years) |
| Source: Mordor Intelligence | |||
Continued Adoption of Traditional X-ray Equipment in Developing Economies
Limited capital, frequent power outages, and gaps in network infrastructure keep analog radiography viable in many hospitals across sub-Saharan Africa and rural South Asia. The World Health Organization reported in 2025 that fewer than half of facilities in the region had reliable electricity, making flat-panel detectors impractical.[1]World Health Organization, “Strengthening Medical Imaging Capacity in Resource-Limited Settings,” who.int Nigeria’s health authority noted that 82% of its functional X-ray units remained film-based in 2024 because digital conversion costs start at USD 80,000 per room. India’s Ayushman Bharat initiative links digital reports in urban centers, yet facilities in Uttar Pradesh, Bihar, and Jharkhand average under 12 hours of daily electricity, so film continues to bridge access gaps. Vendors that maintain local distribution and darkroom chemistry support, therefore, protect a durable segment of the X-ray films market. The result is a staggered adoption curve in which digital and analog technologies coexist well past 2031.
Cost-Effectiveness of Film in Low-Resource Settings
A complete film room, including a three-year supply of consumables, costs USD 25,000-40,000, far below the USD 80,000-350,000 outlay for computed or direct digital radiography, according to a 2024 IAEA guide.[2]International Atomic Energy Agency, “Implementation Guide for Diagnostic Radiology in Low- and Middle-Income Countries,” iaea.org Operating expenses for chemistry and silver recovery remain predictable, whereas digital suites impose annual software fees and hardware refresh cycles that exceed maintenance budgets in many public hospitals. The WHO found that only 28% of African countries run preventive maintenance programs for imaging equipment, resulting in 40-50% downtime on digital units, while film systems require only periodic cassette cleaning. Veterinary clinics and solo dental practices mirror this economics, keeping the X-ray film market active in service niches that large equipment suppliers seldom target. The financial delta strengthens short-term demand even as national procurement policies promote eventual digitization.
Expansion of Industrial Non-Destructive Testing Requiring Film Radiography
Regulated sectors such as aerospace, petrochemical, and nuclear power mandate film archives that must remain readable for up to 60 years. ASTM standards E1742 and E1815 specify film as the reference medium for weld inspection, turbine blade evaluation, and pressure vessel certification.[3]ASTM International, “Standard Practice for Radiographic Examination - E1742,” astm.org NASA’s inspection rules likewise call for film on critical launch-vehicle welds, and U.S. nuclear regulators retain film for reactor documentation. Field conditions heat, dust, and vibration, often degrade portable digital detectors, so contractors still load cassettes on pipelines from the Middle East to Southeast Asia. These codified requirements insulate a stable industrial slice of the X-ray films market and temper the pace of full digital substitution.
Silver Recovery Economics Improving Film Lifecycle Value
Radiographic film contains 1.5-2% silver, and closed-loop recovery yields 90-99% extraction efficiency. Spot silver averaged USD 24-28 per troy ounce in 2025, translating to USD 8-12 recovered per kilogram of processed film after costs. U.S. EPA rules cap silver in wastewater at 5 mg/L, prompting hospitals to hire recyclers that pay USD 3-6 per kilogram for exposed media, offsetting 15-25% of annual film purchases. European REACH regulations and China’s hazardous waste catalog further incentivize silver reclamation, making circular-economy economics a tangible tailwind for the X-ray films market. This revenue stream narrows the total cost gap with digital radiography and extends the relevance of film workflows, especially in industrial facilities that process high volumes of radiographs.
Restraints Impact Analysis*
| Restraint | (~) % Impact on CAGR Forecast | Geographic Relevance | Impact Timeline |
|---|---|---|---|
| Rapid shift to digital radiography and flat-panel detector technology | -1.8% | North America, Europe, developed Asia-Pacific | Short term (≤ 2 years) |
| Environmental regulations on chemical processing and waste disposal | -0.7% | Europe, North America, Japan | Medium term (2-4 years) |
| Shrinking global supply chain for specialty film chemicals increasing costs | -0.5% | Global | Medium term (2-4 years) |
| Hospital decarbonization targets reducing film printer purchases | -0.4% | Europe, North America | Long term (≥ 4 years) |
| Source: Mordor Intelligence | |||
Rapid Shift to Digital Radiography and Flat-Panel Detector Technology
Digital radiography accounted for more than 70% of new installations in high-income regions by 2025, as hospitals prioritized faster workflows, lower patient dose, and cloud archiving. GE HealthCare’s planned USD 2.3 billion acquisition of Intelerad, announced in November 2025, underscores industry commitment to enterprise imaging platforms that bypass film entirely. Konica Minolta ended film production in 2015 and now codesigns AI algorithms with Vietnam’s National Innovation Center, illustrating a pivot from consumables to data-centric services. Reimbursement in the United States favors digital-ready outpatient centers, accelerating the retirement of analog rooms. These dynamics remove the highest-margin buyers from the X-ray films market and intensify price competition in remaining pockets of demand.
Environmental Regulations on Chemical Processing and Waste Disposal
Compliance burdens rise as regulators tighten limits on effluent from silver, lead, and cadmium. The European Union’s REACH framework requires closed-loop systems or costly licensed disposal, adding USD 0.15-0.30 per exposure to operating costs. Similar EPA thresholds in the United States force radiology departments that exceed 5 mg/L silver to register as hazardous-waste generators, with annual fees reaching USD 15,000 for mid-sized hospitals. Japan’s pollutant release law mandates public disclosure for facilities that fail to achieve 90% silver recovery, nudging them toward digital alternatives. These policies compress margins and challenge the long-term viability of wet-processing lines within the X-ray films market.
*Our forecasts treat driver/restraint impacts as directional, not additive. The impact forecasts reflect baseline growth, mix effects, and variable interactions.
Segment Analysis
By End User: Hospitals Dominate While Diagnostic Centers Accelerate
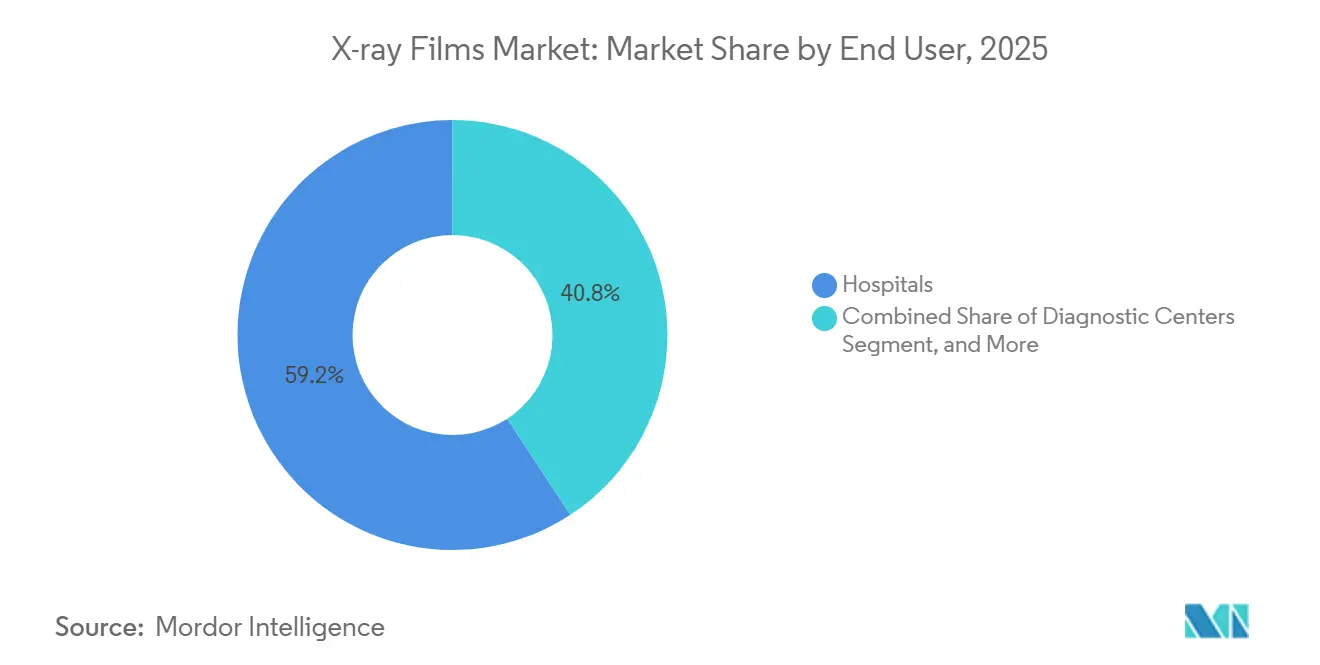
Hospitals commanded 59.23% of 2025 revenue, reflecting large analog installed bases and legal retention rules that still favor hard-copy records in many jurisdictions. Diagnostic centers, however, are advancing at a 6.72% CAGR as payers steer patients toward lower-cost outpatient imaging. This outpatient shift reallocates procedure volume and reshapes the demand profile for X-ray films.
Growth in independent diagnostic testing facilities from 7,000 units in 2018 to more than 11,000 in 2024 broadens the customer pool but also accelerates digital adoption, limiting upside from film. Research institutes and teaching hospitals preserve film rooms for protocol development, especially in low- and middle-income countries, while veterinary clinics in Asia-Pacific and South America use film because pet-owner reimbursements rarely cover digital upgrades. Industrial plants adhere to ASTM film standards, ensuring a stable, if specialized, slice of the X-ray films market for non-destructive testing applications.


By Film Type: Dry Film Expands Through Chemical-Free Processing
Dry film secured 57.78% of 2025 sales and is forecast to climb at a 5.82% CAGR as facilities retire darkrooms to meet environmental mandates. Thermal imaging removes developer and fixer chemicals, shortening turnaround times and aligning with hospital decarbonization targets set by organizations such as NHS England.
Wet film persists in resource-limited clinics that cannot fund USD 15,000-30,000 dry printers, and in industrial fieldwork where wet-processed images deliver marginally better contrast. Even so, dry film’s compliance advantages make it the preferred consumable in regulated markets, and its adoption supports a gradual yet steady shift in X-ray films market share from wet to dry modalities.
By Film Sensitivity: Clear Film Gains Ground in High-Resolution Tasks
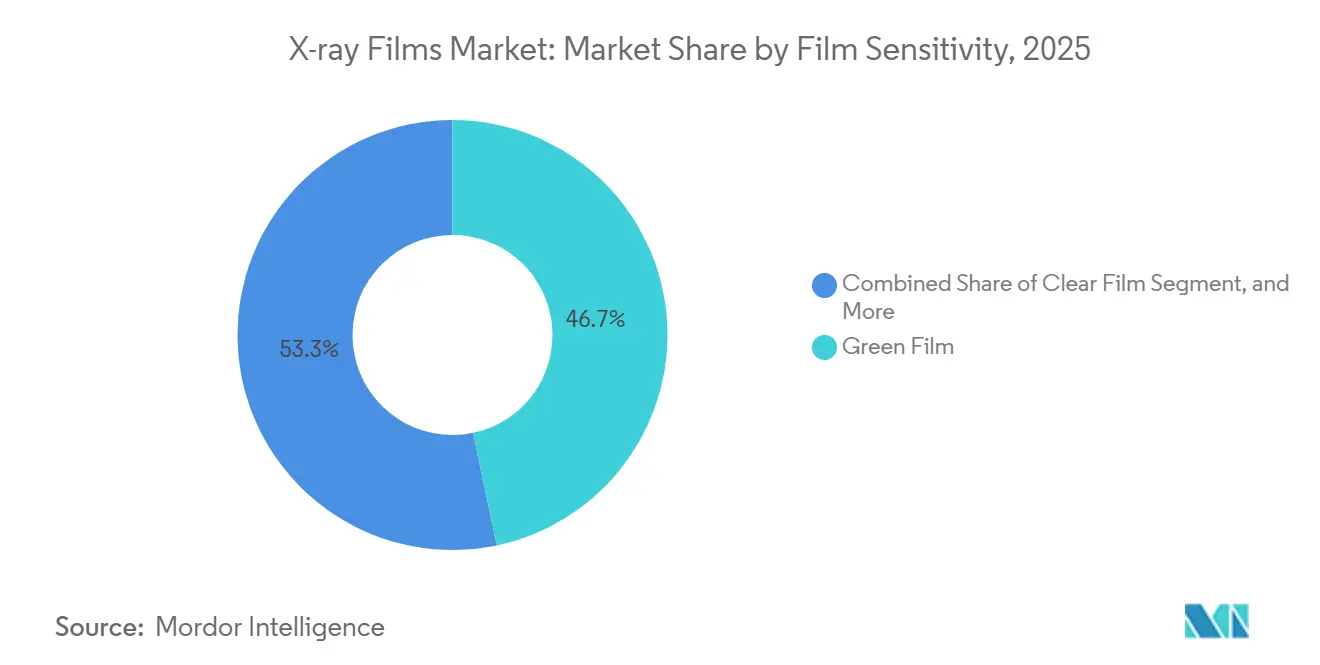
Green film led the sensitivity segment in 2025, with a 46.71% share, as rare-earth screens paired with green emulsions reduced patient dose by up to 70%. Clear film, though, is advancing at a 6.44% CAGR, propelled by aerospace and dental practices that require 12-15 line pairs per millimeter resolution for micro-defect detection.
Industrial codes and NASA specifications call for clear film on critical welds, underscoring the demand, even as medical imaging tilts toward dose-efficient green emulsions. Half-speed and full-speed blue films decline as facilities upgrade their screens, yet veterinary and public health programs still consume blue stock where cost and throughput outweigh image-quality gains. The interplay of these preferences shapes the evolving dynamics of the X-ray films market size at the product level.
By Film Size: Standard Chest Format Still Leads, Small Cassettes Rise
The 14 × 17 inch sheet maintained a 39.66% share in 2025 because adult chest X-rays remain the world’s highest-volume radiographic exam. Smaller 8 × 10-inch sheets, however, are growing at a 6.67% CAGR, fueled by dental, extremity, and veterinary imaging, where reduced material use lowers per-study costs.
Intermediate sizes, such as 10 × 12 inches, support pediatric and portable imaging, while specialty dimensions cater to mammography and turbine-blade inspection. Format diversity enables suppliers to address niche use cases, preserving consumption across healthcare and industrial settings and reinforcing the overall resilience of the X-ray films market.
Geography Analysis
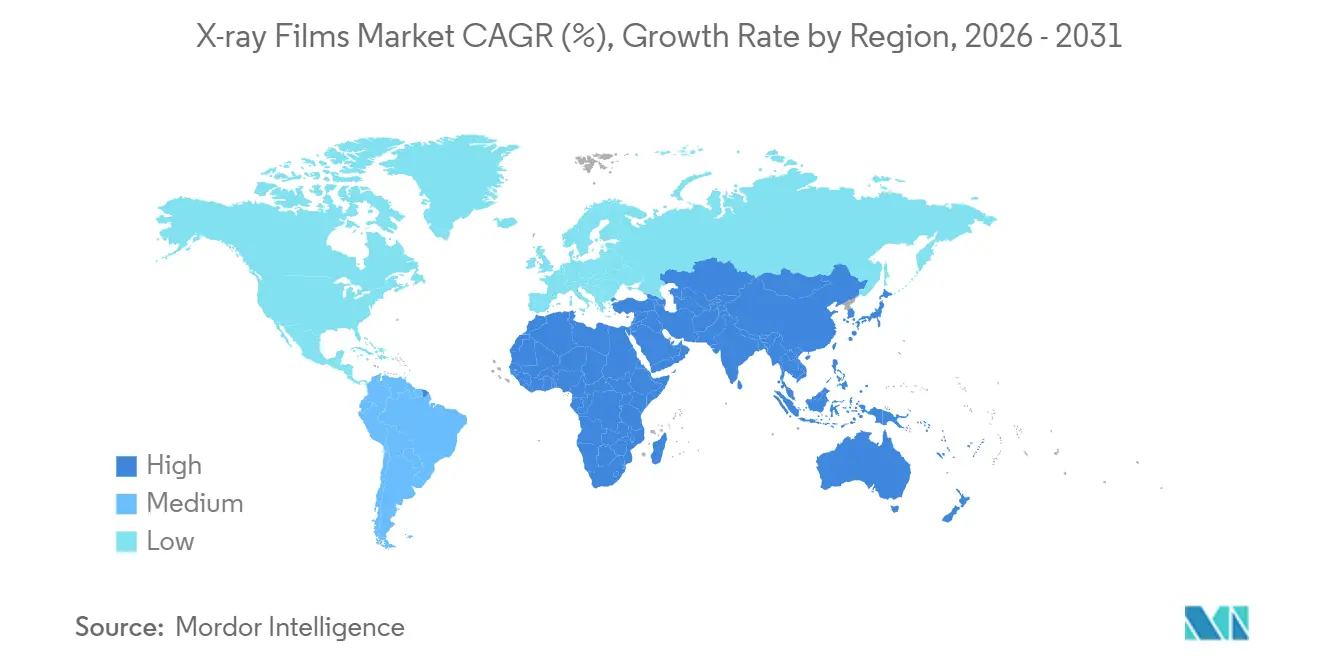
Asia-Pacific generated 52.39% of 2025 revenue, driven by China’s extensive stock of legacy X-ray units in rural hospitals and India’s ongoing reliance on film in states with unstable grids. Japan sustains demand through high imaging volumes, and local recyclers achieve silver recovery rates above 95%, which extends film economics.
Africa is the fastest-growing territory at a 6.61% CAGR. The African Development Bank highlights a USD 3-4 billion annual gap in imaging equipment, and WHO data show radiologist densities below 1 per million in one-third of nations, conditions that favor simple analog systems. Egypt recorded only 2.5 CT scanners per million in 2022, yet possessed 21 X-ray machines per million, underscoring the affordability advantage that supports the X-ray films market.
North America and Europe exhibit slower growth because digital penetration exceeds 70% of new sales, but industrial testing and veterinary practices still purchase film. South America, anchored by Brazil and Argentina, retains analog suites in public hospitals under budget constraints, and regulatory codes continue to recognize film as legal evidence. These regional contrasts ensure that no single adoption curve defines the global X-ray films market.

Regulatory Landscape
In the United States, X-ray imaging devices that anchor film-based workflows are regulated under FDA rules for radiology devices in 21 CFR Part 892. Common systems such as spot-film devices (21 CFR 892.1670) and stationary X-ray systems (21 CFR 892.1680, product code MQB) generally fall under Class II controls. The FDA Quality Management System Regulation (QMSR) takes effect on February 2, 2026, updating CGMP expectations and shaping how manufacturers and suppliers document design, production, and post-market processes for imaging-related products that interface with film printing and archiving workflows.
In Europe, medical imaging products sold into healthcare environments operate under the EU Medical Device Regulation (MDR) (EU) 2017/745. Medical Device Coordination Group (MDCG) guidance and European Commission transitional provisions shape conformity assessment timelines, including for certain products covered under Annex XVI common specifications. Environmental compliance remains a structural constraint for film processing, since requirements that limit silver discharge and govern hazardous waste handling (for example, EU REACH obligations cited within the report context) raise the compliance cost of wet processing and support the shift toward dry film and closed-loop silver recovery arrangements.
Value Chain Analysis
The value chain starts upstream with specialty inputs including silver halide, gelatin, and high-purity processing chemicals, followed by capital-intensive coating, converting, and packaging of medical and industrial radiographic films. Midstream, film is used with cassettes, screens, printers/processors (dry thermal or wet chemical), and quality-control consumables. These products then move through regional distributors and service networks that support installed analog suites in hospitals and outpatient centers, as well as industrial radiography contractors that require reliable field supply.
Downstream demand is shaped by compliance and inspection ecosystems as much as by healthcare procurement. Industrial non-destructive testing providers such as Bureau Veritas integrate radiographic testing into asset integrity programs, while standards such as ASTM E746-23 for evaluating radiographic imaging system response and public-sector procedures such as the North Carolina Department of Transportation radiographic testing inspection procedure revised and issued January 16, 2025 reinforce qualification, documentation, and traceability needs that can preserve film usage. End-of-life handling and silver recovery close the loop as exposed film is collected by recyclers to extract silver and manage regulated waste streams, linking operating economics to recovery contracts and local environmental compliance capacity.
Competitive Landscape
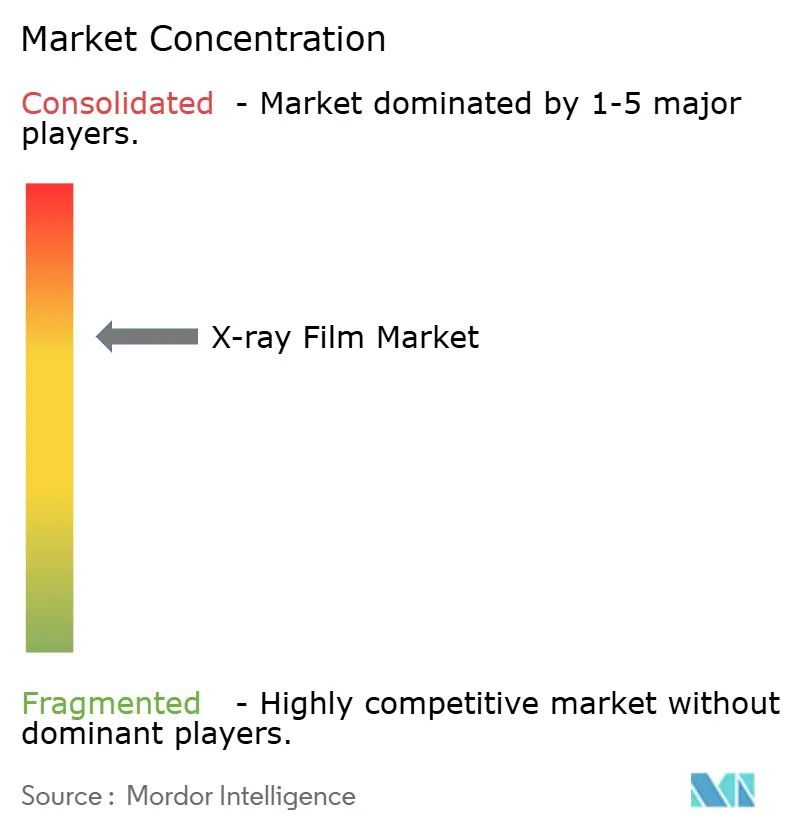
The X-ray films market is moderately concentrated: Fujifilm Holdings, Agfa-Gevaert, Carestream Health, and Konica Minolta account for roughly 60-70% of global revenue. Fujifilm integrated Hitachi’s imaging business in 2021 for EUR 1.47 billion (USD 1.73 billion) to blend digital modalities with film consumables and service contracts. GE HealthCare’s 2025 agreement to buy Intelerad for USD 2.3 billion further pivots its portfolio toward cloud enterprise imaging and away from physical media.
Konica Minolta ceased film production in 2015, yet remains active in AI-enabled radiography, partnering with Vietnam’s innovation center in 2025 to develop digital respiratory diagnostics. Smaller suppliers, including China Lucky Film and Foma Bohemia, compete on price in emerging markets but lack regulatory credentials for aerospace and nuclear sectors. Canon Medical’s new U.S. headquarters in Cleveland will expedite research on X-ray systems, while Siemens Healthineers is expanding into molecular imaging, signaling long-term migration away from consumables.
Silver recovery contracts, industrial specifications, and veterinary demand still justify limited film lines, but overall strategic emphasis among multinationals is shifting toward detectors, software, and AI analytics. This dual approach keeps the X-ray films market viable in select segments while underscoring an inevitable tilt toward digital dominance.
X-ray Films Industry Leaders
Fujifilm Holdings Corporation
Konica Minolta Inc.
Agfa-Gevaert NV
Carestream Health Inc.
Sony Corporation
- *Disclaimer: Major Players sorted in no particular order

Market Opportunities and Future Outlook
A clear whitespace centers on compliance-driven, long-retention imaging records and the operating realities of low-resource healthcare sites where analog rooms remain in service. The report context highlights regulated industrial applications that require long-lived archives and consistent image-quality validation, including ASTM practices used to assess radiographic system performance, alongside healthcare environments where power reliability and IT constraints keep film workflows in use. These conditions support continued demand for standardized film formats, dependable distribution, and on-the-ground service for processing equipment.
Supplier portfolios also create room for hybrid operating models rather than pure film expansion. Large vendors are investing in enterprise imaging, digital radiography, and workflow software, including GE HealthCare’s November 2025 agreement to acquire Intelerad (USD 2.3 billion) and Konica Minolta’s October 2025 MoU with Vietnam’s National Innovation Center and FPT to co-develop DR and AI algorithms. At the same time, the report context indicates that environmental constraints raise the cost of wet processing, increasing the practical value of dry film, silver recovery, and documented waste handling. For film participants, the nearer-term opportunity focuses on supplying compliant consumables and end-of-life recovery services that reduce the total cost of ownership for remaining analog users, and on serving industrial radiography programs where traceability requirements remain a primary purchasing criterion.
Recent Industry Developments
- June 2026: Konica Minolta Healthcare announced a strategic partnership with DataFirst to launch interoperability and DICOM routing solutions for enterprise imaging environments. The move strengthens connectivity between acquisition, archive, and distribution layers, supporting film-replacement workflows that reduce reliance on hard-copy outputs.
- November 2025: Konica Minolta Healthcare launched the KDR FMT and KDR FMT+ floor-mounted digital radiography systems at RSNA 2025. The launch expands the company’s DR installation base in hospitals and outpatient imaging sites, accelerating the transition away from film-centric capture and printing in developed markets.
- November 2024: Agfa introduced the Dura-line XF+ range of glass-free digital radiography detectors at RSNA 2024. By improving detector durability and handling, the product direction reinforces the shift toward detector-based radiography systems that structurally compress film volumes where capital budgets allow upgrades.


Research Methodology Framework and Report Scope
Market Definition and Coverage
For this study, the market is defined as the revenue generated from X-ray film products used to capture radiographic images for medical, dental, veterinary, research, and industrial inspection needs, covering the full supply chain from manufacturers through typical distribution to end users.
Scope exclusions: We exclude spending on digital radiography and computed radiography equipment, image processing software, and service and maintenance contracts that are not part of X-ray film product sales.
Segmentation Overview
- By End User
- Hospitals
- Diagnostic Centers
- Research and Academic Institutions
- Veterinary Clinics
- Industrial Facilities
- By Film Type
- Dry Film
- Wet Film
- By Film Sensitivity
- Green Film
- Half-Speed Blue Film
- Full-Speed Blue Film
- Clear Film
- By Film Size
- 14 × 17 inch
- 11 × 14 inch
- 10 × 12 inch
- 8 × 10 inch
- Other Film Sizes
- By Geography
- North America
- United States
- Canada
- Mexico
- Europe
- Germany
- United Kingdom
- France
- Russia
- Rest of Europe
- Asia-Pacific
- China
- Japan
- India
- South Korea
- Australia
- Rest of Asia-Pacific
- Middle East and Africa
- Middle East
- Saudi Arabia
- United Arab Emirates
- Rest of Middle East
- Africa
- South Africa
- Egypt
- Rest of Africa
- Middle East
- South America
- Brazil
- Argentina
- Rest of South America
- North America
Data Sources, Market Sizing, and Validation
Desk Research
Desk work started with public sources that help set the demand and supply context before we build the model. We referred to sources such as the World Health Organization for imaging access indicators, the US FDA for product and safety context, and the US Census Bureau and UN Comtrade for trade and shipment direction checks tied to film and related inputs.
To translate those signals into a practical sizing backbone, we also reviewed sources such as the International Atomic Energy Agency for radiology capacity context, national health statistics portals for procedure trends, and peer reviewed journals covering film usage, replacement cycles, and environmental handling (for example silver recovery). Company annual reports, investor presentations, and reputed press were used to validate product mix cues such as dry film adoption and end user preferences. Where needed, we also used paid database subscriptions for company financials and intelligence, patent lookups, and shipment-level import export checks. The sources mentioned above are illustrative only, and many other references were consulted to collect data, validate assumptions, and clarify open questions.
Primary Interviews and Surveys
Primary interviews and surveys were used to pressure test desk assumptions and fill gaps that are usually not visible in public data, such as real world ASP movement by film sensitivity and size, purchase cadence, and channel margins. We spoke with a mix of manufacturers, distributors, and end users such as hospitals, diagnostic centers, industrial inspection teams, and veterinary clinics across key global regions, which helped confirm demand drivers and reconcile differences between supply signals and demand-side usage.
Distribution of primary research fieldwork respondents
| Company type | Respondent position | Region |
|---|---|---|
| Top tier: 29% | CXOs: 19% | APAC: 42% |
| Mid tier: 52% | Functional/Unit leaders: 22% | EMEA: 34% |
| Smaller Players: 19% | Managers: 59% | Americas: 24% |
Market-Sizing & Forecasting
Sizing was built using a top-down and bottom-up logic, with the core total reconstructed from end user demand pools and then cross-checked using supplier and channel signals. The top-down path relied on indicators like imaging procedure volumes, the installed base of film-based systems in facilities that still use analog workflows, and the typical replacement frequency tied to film size and sensitivity.
In practice, a few inputs carry most of the weight, so we tracked them carefully and refreshed them during validation. These include the mix shift from wet to dry film, average selling prices by common sizes such as 14x17 and 11x14, usage intensity differences between hospitals and diagnostic centers, and the persistence of film needs in industrial inspection where traceable records are required. Results were corroborated through selective bottom-up approximations, such as sampled ASP times estimated unit demand by cohort, distributor channel checks on volume direction, and sanity checks against trade flows where relevant. When a country-level input was missing, assumptions were bridged using comparable markets with similar healthcare capacity and industrial activity, then the proxy was challenged again in interviews.
For forecasting, we used scenario analysis supported by expert feedback on how quickly facilities continue to migrate to digital, along with expected changes in healthcare access and industrial inspection activity. The final forecast path was adjusted only after the main variables moved in a consistent way across regions and end users, which kept the model easier to explain and repeat internally.
Data Validation & Update Cycle
Outputs were validated through triangulation across demand indicators, supplier-side signals, and expert checks, then reviewed for unusual jumps that do not match real world adoption patterns. If a region shows a sudden step change, the drivers are revisited, and respondents are re-contacted to confirm whether the shift is real or caused by an assumption such as ASP timing or mix.
Before sign-off, the model goes through multi-step analyst reviews, where calculations, unit logic, and currency conversions are rechecked and compared against independent signals like procedure trends and trade direction. Reports are refreshed annually, and interim updates are made when material events occur, such as regulatory changes, supply disruptions, or major shifts in film availability. Right before delivery, an analyst does a fresh pass so clients receive an updated view rather than an older snapshot.
Mordor Intelligence's X Ray Films Market Estimate Compared With Other Published Estimates
Published market sizes for X-ray films can differ quite a bit because each study draws the line differently on what is included and which year is treated as the starting point. In our experience, the biggest differences usually come from scope choices, base year selection, and how fast the model assumes film demand declines in places moving to digital imaging.
By tracking dry versus wet film mix, checking price movement by film size, and refreshing regional adoption assumptions, Mordor Intelligence keeps the total tied to film-only revenue across medical, veterinary, research, and industrial end uses, rather than blending in digital imaging equipment or using flat pricing across sizes.
Benchmark comparison
| Source | Market Size | Gaps in Research Methodology |
|---|---|---|
| Mordor Intelligence | USD 2.04 B (2026) | |
| Global Consultancy A | USD 1.38 B (2025) | Uses an earlier base year and a narrower scope emphasis, and the treatment of end uses and product boundaries is less explicit, which can undercount industrial and research demand that remains film dependent in some regions. |
| Trade Journal B | USD 3.20 B (2024) | Focuses on medical X-ray films only and appears to blend broad radiographic film spending with different base year pricing assumptions, which can inflate totals when film mix and price steps by size are not separated clearly. |
The spread in the table mainly traces back to what is counted and the year used for sizing, not to a single math error. When scope is kept consistent across end uses and the mix and price steps are handled transparently, the resulting market value becomes easier to validate and repeat year after year.


Key Questions Answered in the Report
How large is the global X-ray film market in 2026?
The X-ray film market size stands at USD 2.04 billion in 2026.
What is the forecast CAGR for X-ray film through 2031?
Revenue is projected to rise at a 5.69% CAGR from 2026 to 2031.
Which region generates the most X-ray film revenue?
Asia-Pacific leads with 52.39% of global sales in 2025.
Which end-user segment is expanding the quickest?
Diagnostic centers are growing at a 6.72% CAGR as imaging shifts to outpatient settings.
Why does industry still use film despite digital alternatives?
Capital limits, industrial regulations that require archival films, and profitable silver recovery keep film economically relevant.
What environmental rules affect X-ray film users?
EPA and EU REACH regulations cap silver discharge and compel closed-loop recovery systems, raising compliance costs for wet processing.
Page last updated on:






