
Work Order Management Market Size and Share
Market Overview
| Study Period | 2020 - 2031 |
|---|---|
| Market Size (2026) | USD 0.98 Billion |
| Market Size (2031) | USD 1.41 Billion |
| Growth Rate (2026 - 2031) | 7.52 % |
| Fastest Growing Market | Asia Pacific |
| Largest Market | North America |
| Market Concentration | Medium |
Major Players *Disclaimer: Major Players sorted in no particular order Image © Mordor Intelligence. Reuse requires attribution under CC BY 4.0. | |
Work Order Management Market Analysis by Mordor Intelligence
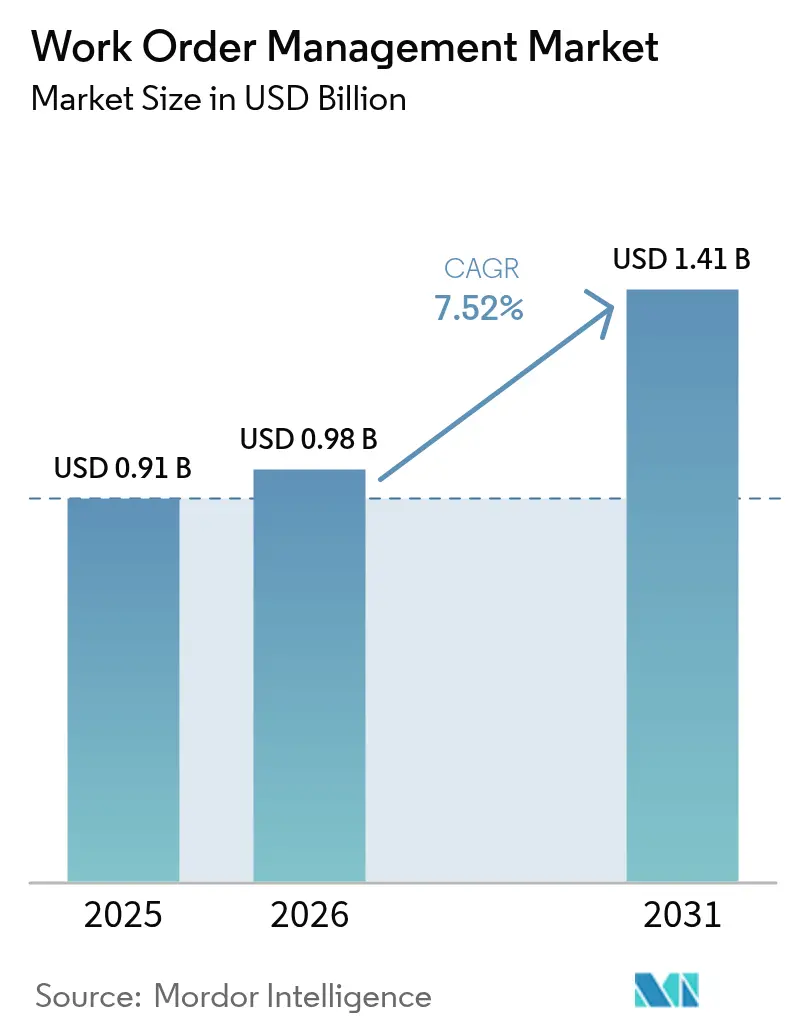
The work order management market size in 2026 is estimated at USD 0.98 billion, growing from 2025 value of USD 0.91 billion with 2031 projections showing USD 1.41 billion, growing at 7.52% CAGR over 2026-2031. Cloud deployment continues to replace on-premises systems as organizations prioritize real-time mobile access, subscription pricing, and rapid scalability. Predictive maintenance programs that tie sensor data to financial outcomes are widening the addressable base beyond traditional manufacturing into highly regulated sectors such as healthcare. A shortage of skilled technicians in mature economies is compelling vendors to embed artificial intelligence that automates scheduling, while low-Earth-orbit satellite services extend coverage to remote assets. Competitive intensity is rising as resource-planning incumbents embed work order modules and mobile-first challengers court small and medium enterprises with freemium tiers.
Key Report Takeaways
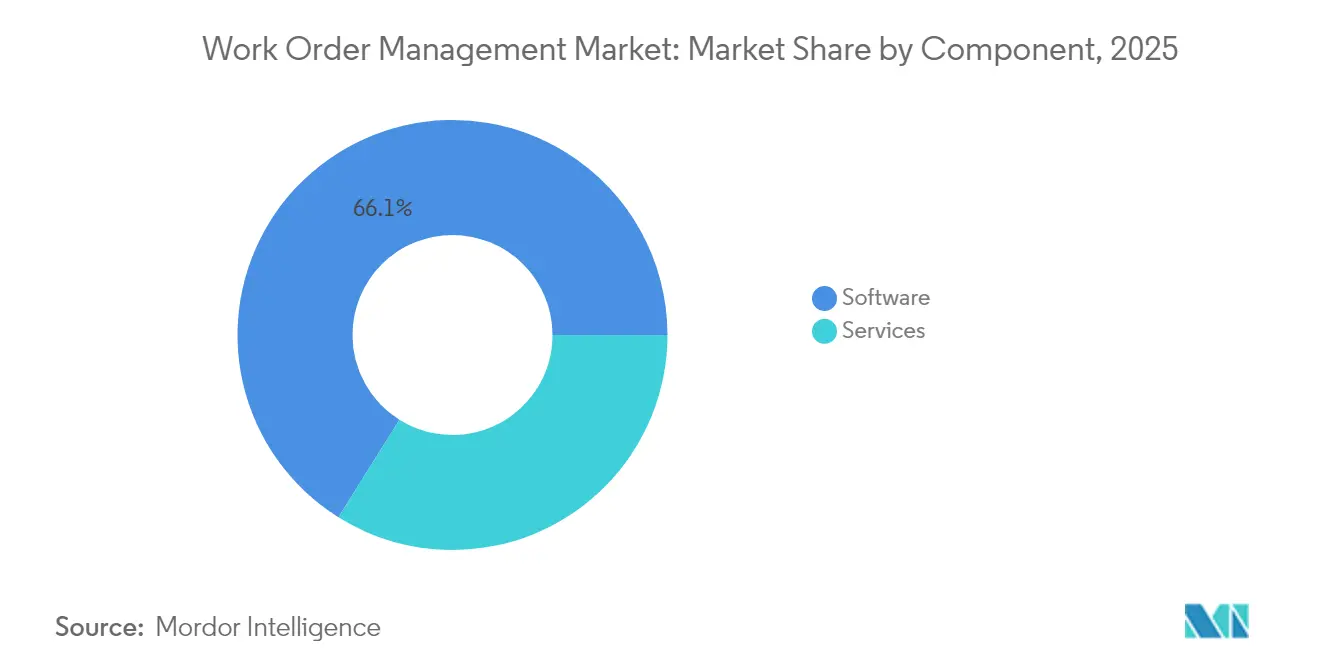
- By component, software led with a 66.10% of the work order management market size in 2025, while services are projected to advance at a 7.88% CAGR through 2031.
- By deployment type, cloud captured 63.05% of the work order management market size in 2025 and is projected to expand at an 8.05% CAGR through 2031.
- By organization size, large enterprises accounted for 65.20% of the work order management market size in 2025, whereas SMEs are expected to grow at an 7.95% CAGR through 2031.
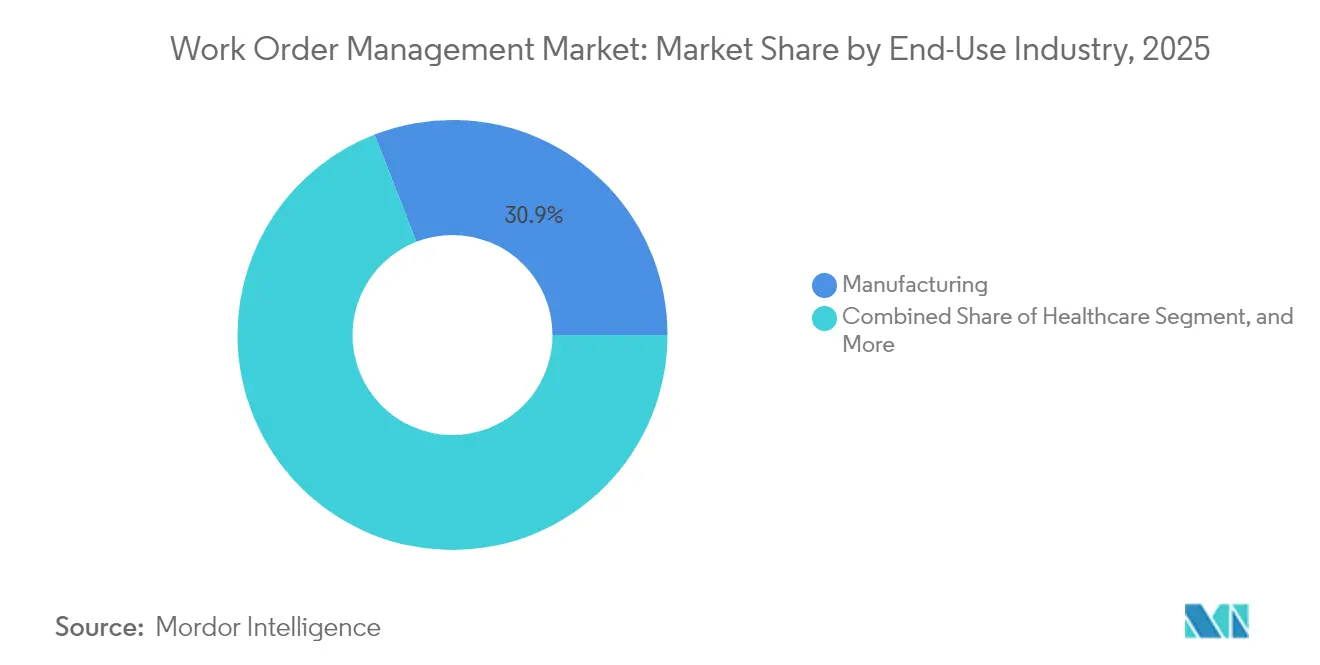
- By end-use industry, manufacturing held a 30.90% of the work order management market size in 2025, and the healthcare sector is forecast to surge at a 9.12% CAGR through 2031.
- By application module, work order management dominated with 34.70% share in 2025, while reporting and analytics is climbing at a 9.01% CAGR through 2031.
- By geography, North America commanded a 38.20% of the work order management market size in 2025, and the Asia Pacific is projected to expand at an 8.65% CAGR through 2031.
Note: Market size and forecast figures in this report are generated using Mordor Intelligence’s proprietary estimation framework, updated with the latest available data and insights as of 2026.
Global Work Order Management Market Trends and Insights
Drivers Impact Analysis*
| Driver | (~) % Impact on CAGR Forecast | Geographic Relevance | Impact Timeline |
|---|---|---|---|
| Rapid adoption of cloud-based field service platforms | +1.8% | Global, with concentration in North America and Europe | Short term (≤ 2 years) |
| Growing demand for predictive maintenance capabilities | +1.5% | Global, led by manufacturing hubs in Asia Pacific and North America | Medium term (2-4 years) |
| Increasing mobile workforce and BYOD policies | +1.2% | Global, with early adoption in North America and Western Europe | Short term (≤ 2 years) |
| Integration with IoT and asset sensors | +1.4% | Asia Pacific core, spillover to Middle East and Africa | Medium term (2-4 years) |
| Shift toward outcome-based service contracts in industrial verticals | +0.9% | North America and Europe, emerging in Asia Pacific | Long term (≥ 4 years) |
| ESG-mandated reporting of maintenance-related carbon footprint | +0.7% | Europe and North America, regulatory influence spreading to Asia Pacific | Long term (≥ 4 years) |
| Source: Mordor Intelligence | |||
Rapid Adoption of Cloud-Based Field Service Platforms
Enterprises are migrating to multitenant software that eliminates the need for servers, backups, and annual maintenance fees.[1] Subscription contracts scale technician seats on demand, enabling firms to flex capacity for seasonal workloads. Mobile synchronization became mandatory during the COVID-19 pandemic, cementing expectations for real-time visibility across geographically dispersed teams. Regulated utilities and defense agencies adopt hybrid deployment, keeping asset data on-premises while running scheduling logic in the cloud to strike a balance between security and mobility. Leading vendors report that more than three-quarters of new field service contracts specify cloud-only architecture.
Growing Demand for Predictive Maintenance Capabilities
Machine-learning models correlate sensor telemetry with historical work orders to forecast failures and schedule interventions before breakdowns.[2] Avoiding a single unplanned shutdown can offset the annual cost of an enterprise platform. Vendors acquire IoT specialists to deliver end-to-end asset performance, as illustrated by PTC’s integration of ServiceMax with ThingWorx. Regulatory agencies encourage utilities to deploy predictive maintenance to mitigate wildfire risk, thereby accelerating its adoption in the energy sector. The approach favors organizations with mature reliability teams, widening the gap between digital leaders and laggards.
Increasing Mobile Workforce and BYOD Policies
A growing number of employers are allowing technicians to install field service apps on their personal smartphones, thereby reducing hardware budgets and compressing deployment cycles.[3] Zero-trust security frameworks with biometric authentication safeguard sensitive schematics on consumer devices. BYOD accelerates the work order management market by reducing training friction and enabling gig-style staffing for surge events. Compliance with GDPR and HIPAA forces vendors to embed role-based access controls and immutable audit trails. The adoption of encrypted mobile device management is rising as it becomes a standard across both small and large enterprises.
Integration With IoT and Asset Sensors
Industrial assets now ship with embedded connectivity that automatically generates work orders when temperature, vibration, or pressure exceed specified thresholds. The model shortens detection-to-response time for offshore platforms and remote substations where manual inspection is costly. Data standardization challenges persist because sensors emit proprietary formats; however, IEC 62443 guidelines are creating a security baseline that buyers demand. Equipment makers integrate telematics and maintenance software at the factory, providing a services revenue stream throughout the asset's life cycle.
Restraints Impact Analysis*
| Restraint | (~) % Impact on CAGR Forecast | Geographic Relevance | Impact Timeline |
|---|---|---|---|
| Data security and privacy concerns in cloud deployments | -0.6% | Global, with heightened sensitivity in Europe and North America | Short term (≤ 2 years) |
| High integration complexity with legacy ERP systems | -0.8% | North America and Europe, where legacy systems are prevalent | Medium term (2-4 years) |
| Talent shortage in AI-enabled dispatch algorithm development | -0.5% | Global, most acute in North America and Western Europe | Medium term (2-4 years) |
| Rising satellite internet latency costs in remote asset locations | -0.4% | Global, concentrated in offshore energy, mining, and rural utilities across Middle East, Africa, and remote Asia Pacific | Long term (≥ 4 years) |
| Source: Mordor Intelligence | |||
Data Security and Privacy Concerns in Cloud Deployments
Ransomware incidents targeting field service providers rose sharply in 2024, highlighting vulnerabilities in third-party hosting environments. Healthcare organizations face fines exceeding USD 1 million per breach under HIPAA, prompting cautious migration paths. Vendors respond with SOC 2 Type II audits and end-to-end AES-256 encryption, yet buyer skepticism persists. New European NIS2 rules require essential service operators to report cyber events within 24 hours, adding compliance overhead. Consequently, some firms defer cloud adoption until internal security teams mature.
High Integration Complexity With Legacy ERP Systems
Decades-old resource-planning software relies on bespoke data models that clash with modern APIs, stretching implementation timelines beyond 18 months. Custom middleware and data reconciliation can consume up to 30% of the total project effort, thereby increasing budget risk. Organizations running multiple ERP instances across regions face compounded complexity, often requiring system integrators to build point-to-point connectors. Progress accelerates when vendors ship pre-built adaptors, but cross-vendor environments still demand extensive testing. Integration hurdles slow the pace at which large enterprises can unlock predictive analytics embedded in cloud platforms.
*Our forecasts treat driver/restraint impacts as directional, not additive. The impact forecasts reflect baseline growth, mix effects, and variable interactions.
Segment Analysis
By Component: Services Gain as Integration Demands Rise
Services contributed 33.90% of 2025 revenue, yet they are expanding at a 7.88% CAGR, faster than software. Implementation partners migrate legacy data, configure approval workflows, and link field applications to enterprise resource planning systems, activities that can span a full fiscal year for global manufacturers. Managed services appeal to firms that lack in-house IT staff, shifting the responsibility for upgrades and cybersecurity to vendors. Training budgets represent at least 15% of total project spend, which helps lift technician adoption and shorten payback periods. Consequently, services are a strategic lever for vendors to deepen account relationships.
Software remains the backbone of the work order management market, automating dispatch, mobile execution, and asset tracking through a unified interface. The segment benefits from steady subscription renewals and feature expansion, including artificial intelligence dispatch assistants. Vendors bundle adjacent modules, including inventory and customer management, to boost average contract value. Although software growth trails services, it remains the primary entry point for new customers and underpins the broader ecosystem.

By Deployment Type: Cloud Dominance Reshapes Vendor Strategies
Cloud platforms captured a 63.05% share in 2025 and are projected to grow at an 8.05% CAGR through 2031. Operating expenditure pricing eliminates capital budgets for servers, and automatic updates keep installations secure without manual patches. Vendors embed advanced analytics and natural-language interfaces that would be cost-prohibitive on premises. Hybrid models satisfy regulated sectors by keeping asset telemetry onsite while running scheduling algorithms in the cloud.
On-premises installations persist in defense and critical infrastructure, where data sovereignty and air-gapped networks remain non-negotiable. Nevertheless, their relative share will continue to decline as CIOs plan cloud-first roadmaps. The shift drives vendors to prioritize multitenant architectures and to sunset perpetual licenses, moving revenue recognition toward recurring subscription streams.
By Organization Size: SMEs Embrace Affordable Cloud Tiers
Large enterprises accounted for 65.20% of 2025 spending, leveraging existing contracts with SAP, Oracle, and Microsoft to extend resource-planning suites. Complex multi-site operations demand advanced scheduling algorithms and integration with industrial IoT platforms. These organizations negotiate global service-level agreements and often require localization across dozens of languages.
SMEs, however, represent the fastest-growing customer group, with adoption rising at an 7.95% CAGR. Subscription plans starting below USD 50 per user per month remove upfront barriers, while mobile-first apps lower training costs for small crews. Templates for plumbing, HVAC, and electrical trades accelerate go-live within weeks instead of quarters. High churn remains a challenge, pressing vendors to offer freemium tiers and in-product coaching to retain users.
By End-Use Industry: Healthcare Surges on Compliance Mandates
Manufacturing led 2025 revenue with a 30.90% share as predictive maintenance programs shield continuous-flow production from costly downtime. Energy and utilities follow, driven by dispersed assets such as substations and pipelines that require remote scheduling. Healthcare, though smaller today, is expanding at a 9.12% CAGR as hospitals digitize maintenance logs to comply with FDA 21 CFR Part 11 recordkeeping rules.
Adopters in healthcare have reduced medical equipment downtime by one-third, improving patient throughput and asset utilization. Telecommunications, retail, and government agencies also accelerate deployment to manage distributed networks, stores, and civic infrastructure. Each vertical pursues tailored functionality: utilities demand geospatial tracking, while retailers focus on store-appearance work orders.
By Application Module: Analytics Ascends as Buyers Seek Insight
Work order management remained the foundational module with a 34.70% share in 2025, automating task creation, assignment, and closure. Asset and inventory management modules support accurate tracking of spare parts and effective warranty management. Preventive maintenance schedules recurring inspections, while dispatch engines optimize routing to cut travel time.
Reporting and analytics is the fastest-growing module, rising at a 9.01% CAGR as supervisors demand dashboards that surface technician utilization, mean time to repair, and cost per work order. Embedded business intelligence marks the maturation of the work order management market, once core workflows are digitized, data becomes a strategic asset for continuous improvement. Real-time insights enable managers to redeploy resources and quantify the return on investment in predictive maintenance initiatives.
Geography Analysis
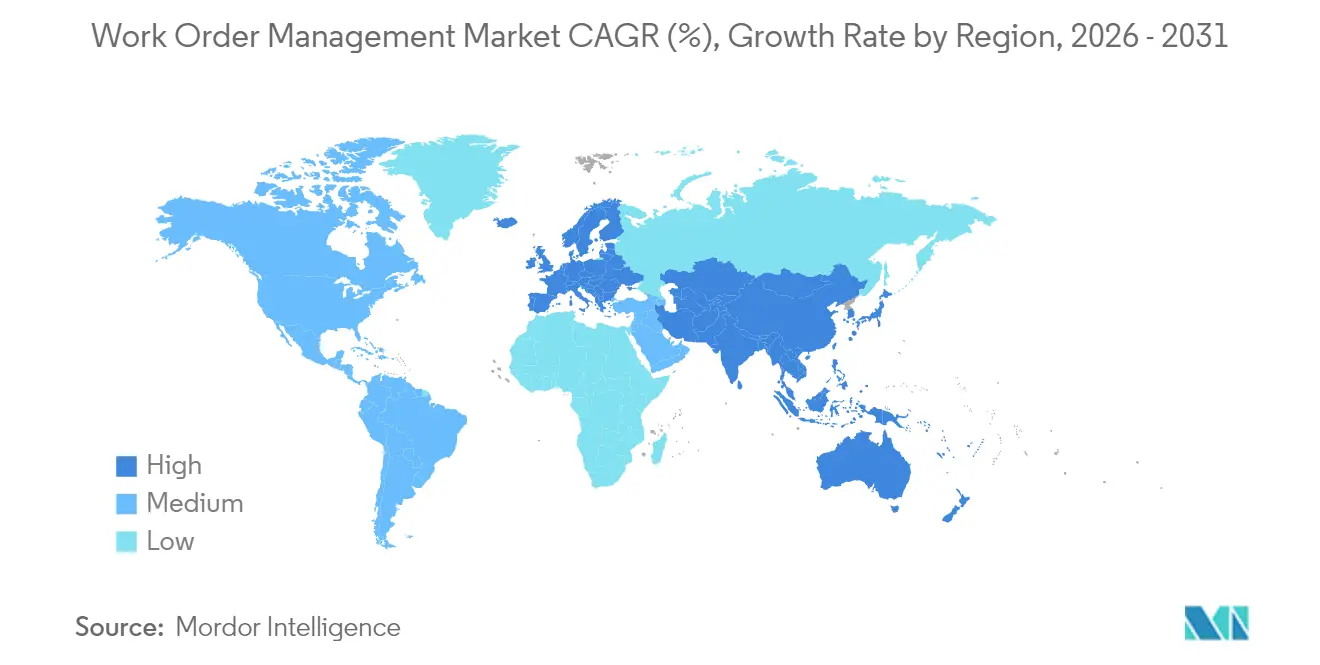
North America accounted for 38.20% of 2025 revenue, driven by the early adoption of cloud platforms, an extensive integrator ecosystem, and compliance requirements from OSHA that mandate the use of documented maintenance procedures. The United States drives the region, leveraging large installed resource-planning bases to cross-sell field service modules. Canada follows suit, especially in the energy sector, where operators coordinate maintenance across wide geographic areas. Mexico is emerging as a hub for nearshore manufacturing, requiring modern maintenance infrastructure.
The Asia Pacific is forecast to grow at an 8.65% CAGR through 2031, benefiting from government mandates that encourage industrial IoT deployment in China and smart city initiatives in India. Japan’s aging workforce is accelerating the automation of field service dispatch, while investments in sensors across utilities and transportation are amplifying demand. Vendors localize solutions for language and regulatory compliance, positioning Asia Pacific as the primary growth engine.
Europe’s stringent GDPR and data-sovereignty rules slow cloud migration but raise interest in hybrid deployments. Germany’s automotive and machinery sectors generate strong demand for predictive maintenance, and the United Kingdom’s utilities invest to meet Ofgem reliability targets. France and Russia adopt at a modest pace due to on-premises preferences. The Middle East is seeing momentum from mega-projects in Saudi Arabia and the United Arab Emirates, while South Africa leads African adoption in the mining sector. South America is a mixed region: Brazil invests in manufacturing and energy, whereas currency volatility restrains spending in Argentina and its neighboring markets.
Regulatory Landscape
Work order management deployments sit under expanding cybersecurity, privacy, and critical-infrastructure compliance requirements that affect cloud selection, data handling, and auditability. In the European Union, the Cyber Resilience Act (Regulation (EU) 2024/2847) introduces product security and vulnerability-management obligations for software. Chapter IV provisions on notifying conformity assessment bodies become applicable from June 11, 2026, which raises the compliance bar for vendors distributing in the EU.
In the United States, buyers in regulated and public-sector environments commonly map work order management and adjacent field service workflows to NIST controls and security requirements, including FIPS-aligned cryptography. Agency-specific directives such as the US Department of Veterans Affairs (VA) Handbook 6500 are used in technology acceptance processes. Separately, the FCC adopted a Report and Order in April 2026 (FCC 26-19) on technology-transition discontinuance rules to support network modernization, indirectly reinforcing expectations for telecom and utility operators to maintain documented operational processes and controlled change management within service and maintenance workflows.
Value Chain Analysis
The value chain begins with software product development (workflow engines, mobile apps, analytics/AI, and security), then extends to cloud infrastructure and platform dependencies. Vendors package these capabilities into work order, scheduling/dispatch, inventory, and reporting modules.
Implementation and configuration are typically delivered by vendors and systems integrators that build connectors to ERP and line-of-business systems, including SAP, Oracle, and Microsoft estates, and extend integrations to IoT/telematics and telecom OSS/BSS layers where alarms and service orders can trigger work creation. Downstream, channel partners and integration ecosystems help accelerate deployments and reduce handoffs across procurement and fulfillment. Itential released an integration app in May 2026 for ServiceNow Order Management for Telecom to automate service fulfillment using TMF641 service orders. Cyient and Zinier partnered in July 2025 to combine systems integration with a no-code field service platform for telecom and utility infrastructure operations. For trade and contractor workflows, integrations connecting FSM to financial/ERP and distributor ordering, such as Prokeep and FieldPulse (July 2025), show how parts procurement, inventory visibility, and supplier communications get embedded in work order execution.
Competitive Landscape
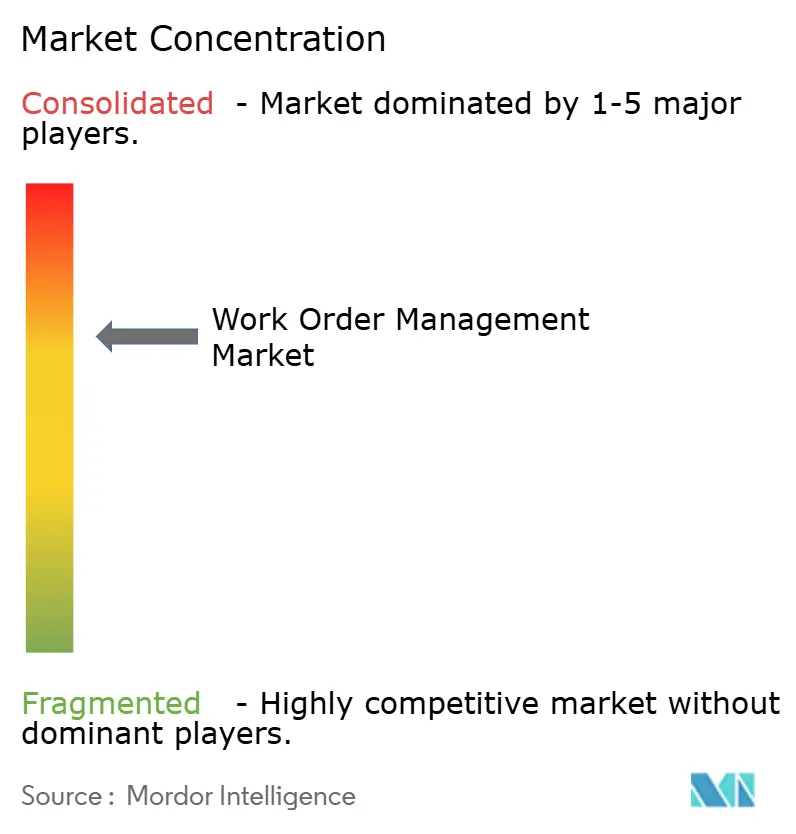
The top five vendors controlled most of the 2024 revenue, indicating moderate market fragmentation. SAP, Oracle, and Microsoft leverage installed resource-planning footprints to embed field service modules, creating switching costs that favor incremental expansion. ServiceNow, IFS, and PTC differentiate themselves with deep functionality, including AI-driven dispatch and augmented-reality support. Mobile-first challengers, including UpKeep, MaintainX, and Limble, target SMEs with freemium pricing and intuitive interfaces, thereby accelerating user growth by reducing adoption friction.
Technology competition centers on predictive analytics, low-connectivity mobile performance, and end-to-end IoT integration. ServiceNow incorporated Element AI to automate incident prioritization, while PTC’s ThingWorx enables manufacturers to embed sensors at the factory. Telecommunications carriers such as Verizon bundle telematics data with maintenance workflows, blurring industry boundaries.
Outcome-based pricing is an emerging model where vendors charge for uptime rather than the number of seats, aligning incentives but requiring robust analytics to verify performance. Generative AI is entering the mainstream, with Microsoft’s Copilot allowing technicians to dictate work orders in natural language. The competitive field remains open for specialists focused on renewable energy assets or compliance-intensive sectors, such as the pharmaceutical industry.
Work Order Management Industry Leaders
-
ServiceNow Inc.
-
PTC Inc.
-
IFS AB
-
Oracle Corporation
-
SAP SE
- *Disclaimer: Major Players sorted in no particular order
Market Opportunities and Future Outlook
Opportunities are concentrated where buyers need work execution tied to stronger governance, cyber controls, and multi-party delivery, especially in regulated industries and telecom infrastructure operations. As the EU Cyber Resilience Act moves from regulation into operational compliance, including provisions applicable from June 11, 2026, vendors can differentiate through secure-by-design practices, vulnerability disclosure processes, and auditable change trails that map directly into work order and field workflows.
A second opportunity is deeper integration across service fulfillment, inventory, and enterprise systems, which reduces manual rekeying and supports better first-time fix rates for distributed operations. Service providers in telecom and utilities are shifting from siloed systems toward integrated platforms, backed by moves such as Itential's May 2026 integration app for ServiceNow Order Management for Telecom (OMT) using TMF641 service orders. Product roadmaps are also leaning into AI-assisted and portal-based execution, including IFS Cloud 26R1 (June 2026) adding a browser-based Service Execution Portal and enhanced commercial governance features aimed at long-duration service projects, consistent with outcome-based and contract-governed maintenance models referenced in the market scope.
Recent Industry Developments
- May 2026: ServiceNow completed its acquisition of Armis for about USD 7.75 billion, adding cyber asset intelligence to its platform. The combination links asset visibility and cyber risk with operational workflows, which can strengthen governance for work order and field service execution in regulated and critical-infrastructure settings.
- May 2026: ServiceNow announced at Knowledge 2026 new governed autonomous work capabilities, including expansion of its AI Control Tower and the introduction of ServiceNow Otto. These releases reinforce the shift toward orchestrating and controlling AI-driven actions across enterprise workflows that include dispatch, approvals, and service execution.
- January 2025: ServiceNow introduced an integration with Oracle to connect Oracle Autonomous Database and Oracle Database 23ai with the ServiceNow platform. The integration supports enterprise deployments that require tighter data interoperability across operational systems, a common constraint for large work order management programs.
Research Methodology Framework and Report Scope
Market Definition and Coverage
For this methodology, the work order management market covers software and related services that help plan, create, assign, track, and close work orders for assets, facilities, or field teams across industries.
Scope exclusions: Excludes general ERP suites, pure project management tools, and broader facility management outsourcing unless the revenue is directly tied to work order management modules and services.
Segmentation Overview
- By Component
- Software
- Services
- By Deployment Type
- Cloud-Based
- On-Premises
- Hybrid
- By Organization Size
- Small and Medium Enterprises (SMEs)
- Large Enterprises
- By End-Use Industry
- Manufacturing
- Energy and Utilities
- Healthcare
- IT and Telecom
- Transportation and Logistics
- Government
- Retail
- Other End-Use Industry
- By Application Module
- Work Order Management
- Asset Management
- Inventory Management
- Preventive Maintenance
- Scheduling and Dispatch
- Reporting and Analytics
- Customer Management
- By Geography
- North America
- United States
- Canada
- Mexico
- Europe
- Germany
- United Kingdom
- France
- Italy
- Rest of Europe
- Asia-Pacific
- China
- Japan
- India
- South Korea
- Australia
- Rest of Asia-Pacific
- Middle East and Africa
- Middle East
- Saudi Arabia
- United Arab Emirates
- Rest of Middle East
- Africa
- South Africa
- Egypt
- Rest of Africa
- Middle East
- South America
- Brazil
- Argentina
- Rest of South America
- North America
Data Sources, Market Sizing, and Validation
Desk Research
We started by mapping the demand base using public, non-paywalled references that show where work orders are created and tracked at scale. Sources used include government and standards bodies and publications such as the US Bureau of Labor Statistics (maintenance and repair employment), NIST guidance on smart manufacturing and asset practices, and the ISO/IEC standards library for maintenance and asset management terms. We also checked filings and earnings materials of listed software and industrial service providers, along with trusted press coverage to understand pricing shifts and cloud migration patterns.
On the supply side, we reviewed product documentation and public price points for work order modules, plus implementation partner materials to understand typical deployment scope (mobile usage, integrations, and add-on modules). Where available, paid subscriptions that cover company financials and intelligence, news and financials, and patent databases were used to confirm vendor exposure and product roadmaps, and then these were carried into the interview guide. The desk sources mentioned here are illustrative, and many other public references were reviewed to collect data, validate assumptions, and clarify open points.
Primary Interviews and Surveys
Our primary work focused on interviews and short surveys with software providers, system integrators, and end users who own maintenance, operations, and field service processes. For a global view, we spoke across major regions so adoption differences (such as cloud readiness and mobile technician coverage) could be tested, and then the assumptions were adjusted before totals were finalized.
Distribution of primary research fieldwork respondents
| Company type | Respondent position | Region |
|---|---|---|
| Top tier: 25% | CXOs: 14% | APAC: 48% |
| Mid tier: 61% | Functional/Unit leaders: 42% | EMEA: 32% |
| Smaller Players: 14% | Managers: 44% | Americas: 20% |
Market-Sizing & Forecasting
Sizing was built using a top-down demand pool reconstruction, where enterprise software spend linked to maintenance, field service, and asset-heavy operations is filtered down using adoption and module-attachment signals specific to work order management. To keep the estimate grounded, the totals were then checked with selective bottom-up approximations such as sampled vendor revenue exposure to work order modules, partner channel checks, and typical ASP per user or per site multiplied by deployed volumes.
Key inputs used in the model included cloud versus on-premises mix, share of deployments that bundle scheduling and dispatch with core work orders, average contract duration and renewal behavior, integration intensity with EAM or inventory workflows, and the pace of mobile technician enablement. Forecasts were run using scenario analysis, where variables like subscription pricing progression, cloud migration speed, and implementation cycle time were stress-tested with expert feedback. When bottom-up signals were missing for smaller vendors or niche industries, gaps were handled by using validated ASP bands and adoption ranges and then rechecking the implied spend against end-user budgets.
Data Validation & Update Cycle
We validated outputs by triangulating the model against multiple independent checks, including implied per-asset or per-technician spend, module attach rates discussed in interviews, and observed cloud subscription price changes. Large variances were flagged, and then assumptions were revisited, with follow-up outreach triggered when a key input moved outside the expected range.
Before sign-off, the dataset and calculations go through multi-step analyst review so that definitions, unit conversions, and growth drivers are consistently applied. Reports are refreshed annually, and interim updates are made when material events occur, such as major pricing changes, a step change in cloud adoption, or a meaningful shift in maintenance investment cycles. Right before delivery, a final pass is done so clients receive the latest updated view.
Mordor Intelligence's Work Order Management Market Size Compared Against Other Published Estimates
Published market numbers for work order management can vary a lot because each study draws the line differently on what counts as a work order product, and because pricing and module bundling are treated in different ways. Differences also show up when one estimate assumes faster cloud migration, or when older base years are carried forward without being rechecked against recent contract behavior.
Asset management and inventory management add-ons are the biggest drivers of spread because some sources count these modules in full even when they are bought as part of a broader EAM suite, which pushes totals upward in a way end users do not always recognize in budgets. Asset management and inventory management sit inside scope only when they are sold and priced as part of a work order management deployment, a rule applied by Mordor Intelligence so the total stays tied to work-order-led buying and renewal patterns.
Benchmark comparison
| Source | Market Size | Gaps in Research Methodology |
|---|---|---|
| Mordor Intelligence | USD 0.98 B (2026) | |
| Trade Journal A | USD 0.79 B (2023) | Uses an earlier base year and is closer to core work order workflow revenue, with limited treatment of services and fewer checks on cloud subscription uplift. |
| Regional Consultancy B | USD 7.82 B (2025) | Appears to fold broader EAM and maintenance management suites into the definition, which expands the addressable spend beyond work order specific modules and raises the total materially. |
The comparison shows that the largest differences come from what is counted around the core work order workflow, plus the year and pricing uplift assumptions used. By keeping inputs tied to observable adoption, module attachment, and subscription pricing ranges, we deliver a number that can be traced back to clear variables and repeated in future updates.
Key Questions Answered in the Report
How fast is the work order management market projected to grow through 2031?
It is expected to expand at a 7.52% CAGR, rising from USD 0.98 billion in 2026 to USD 1.41 billion in 2031.
Which deployment model is gaining the most traction among new buyers?
Cloud deployment leads with 63.05% share in 2025 and continues to grow fastest as firms avoid on-premises infrastructure.
Why is healthcare adoption accelerating?
Hospitals need electronic maintenance logs to meet FDA Part 11 compliance, propelling a 9.12% CAGR for the sector.
What is driving demand for analytics modules?
Supervisors increasingly seek real-time dashboards that highlight technician utilization and mean time to repair, making analytics the fastest-growing module at 9.01% CAGR.
Which region offers the strongest growth outlook?
Asia Pacific shows the highest regional CAGR at 8.65%, supported by manufacturing expansion and government smart-infrastructure programs.