
Wool Market Size and Share
Wool Market Analysis by Mordor Intelligence
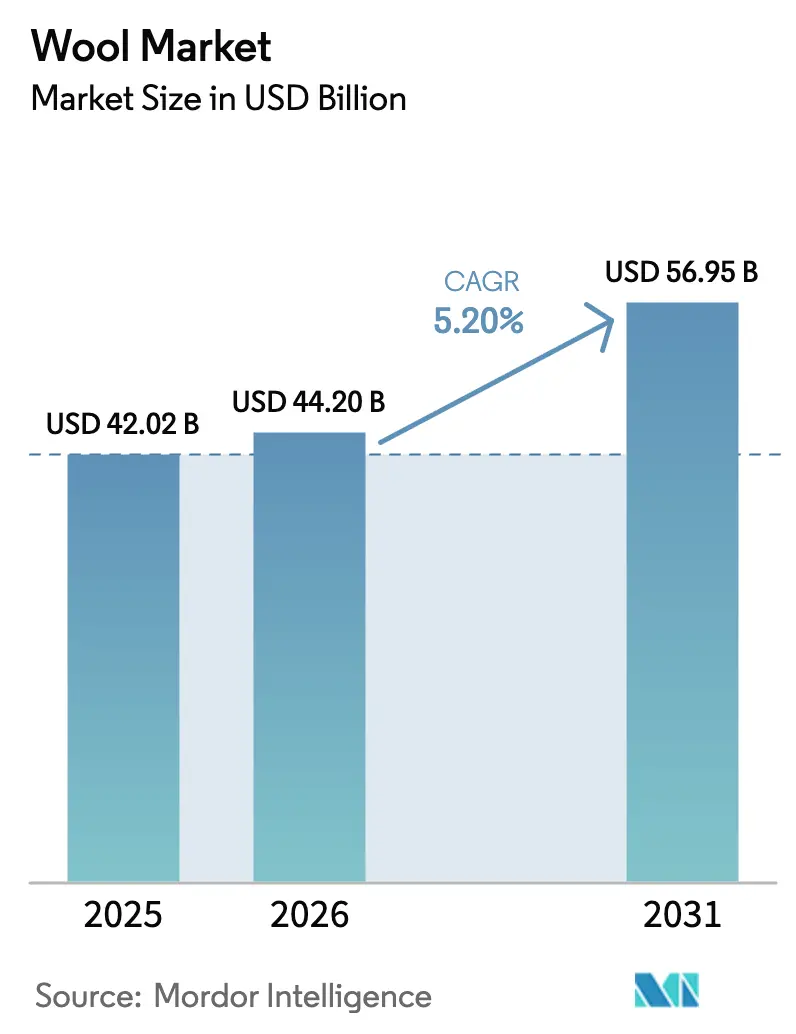
The wool market is projected to expand from USD 42.02 billion in 2025 and USD 44.20 billion in 2026 to USD 56.95 billion by 2031, registering a CAGR of 5.20% between 2026 to 2031. Mounting regulatory support for biodegradable fibers, digital traceability mandates, and a pivot by luxury and outdoor brands toward certified Merino are the primary engines of growth. Demand signals also come from building-insulation specifiers who favor sheep-wool batts, offering a negative carbon footprint, and from defense agencies that require wool-blend flame-resistant fabrics, both of which cushion the industry from apparel-cycle volatility. Supply, however, tightens as Australia, New Zealand, and parts of Europe report contracting sheep numbers and labor shortages, prompting auction premiums for non-mulesed and fully traceable lots. Competitive intensity remains moderate because the top 15 processors control only 35% of greasy-wool throughput, leaving scope for cooperatives and specialty mills to win price premiums through Responsible Wool Standard and ZQ Merino certifications.
Key Report Takeaways
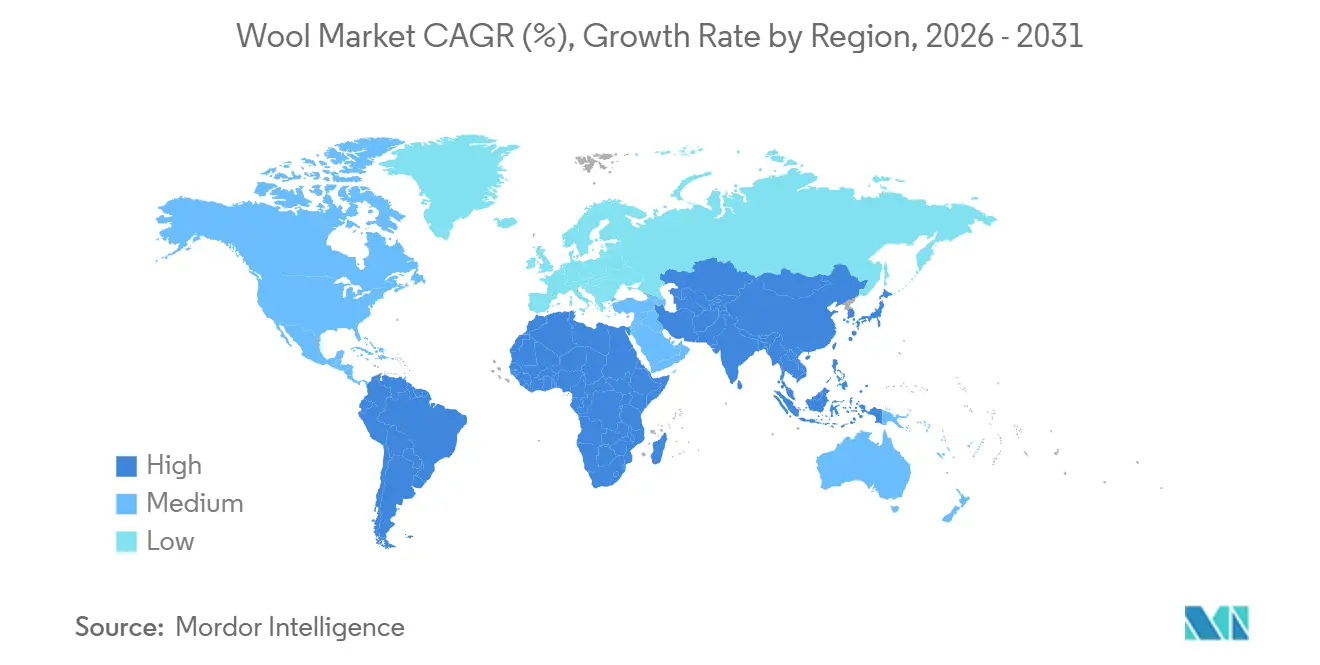
- By geography, Asia-Pacific commanded 46.8% of the wool market share in 2025, while the Middle East is forecast to expand at a 5.2% CAGR through 2031.
Note: Market size and forecast figures in this report are generated using Mordor Intelligence’s proprietary estimation framework, updated with the latest available data and insights as of January 2026.
Market Trends and Insights
Drivers Impact Analysis of Wool Market*
| Driver | (~) % Impact on CAGR Forecast | Geographic Relevance | Impact Timeline |
|---|---|---|---|
| Greening of global fashion supply chains | +0.8% | Europe, North America, and East Asia | Medium term (2-4 years) |
| Rising demand for traceable and certified wool | +0.7% | Europe, North America, Australia, and New Zealand | Short term (≤2 years) |
| Regulatory pressure shifting synthetics toward biodegradable wool | +0.6% | European Union core, United Kingdom, and Asia-Pacific export hubs | Long term (≥4 years) |
| Expansion of thermal-insulation uses in building materials | +0.4% | Northern Europe and North America | Long term (≥4 years) |
| Blockchain-enabled provenance platforms unlocking farm-level price premiums | +0.5% | Australia, New Zealand, Argentina, and Uruguay | Medium term (2-4 years) |
| Military adoption of wool-blend flame-resistant fabrics | +0.3% | United States and North Atlantic Treaty Organization allies | Short term (≤2 years) |
| Source: Mordor Intelligence | |||
Greening of Global Fashion Supply Chains
Luxury groups now require Environmental Product Declarations from mills and science-based grazing practices from ranches, elevating certified wool’s attractiveness relative to polyester and nylon. Kering insists that suppliers document regenerative grazing outcomes by 2026, steering more than 1.2 million hectares in Patagonia under Chargeurs’ Nativa program [1]Source: Kering, “Raw Material Standards for Wool Suppliers 2024,” kering.com. Twelve European processors gained Environmental Product Declarations in 2024, which they leverage during sourcing tenders with athletic-wear brands. The European Union’s sustainable-textiles strategy gives wool a regulatory edge because it biodegrades within five years under industrial composting, unlike polyester [2]Source: European Commission, “Ecodesign Regulation 2024/1781,” ec.europa.eu. Yet, mass-market Asian retailers still privilege synthetics because of lower unit costs and quick-dye cycles, moderating the driver’s impact in value segments.
Rising Demand for Traceable and Certified Wool
Risk managers want end-to-end lineage, so Australian Wool Innovation trialed a blockchain ledger for 50,000 bales in 2024, letting buyers verify micron counts and non-mulesed status before bidding. TextileGenesis joined forces with New Zealand Merino in 2025 to embed QR tags on bale labels that retailers such as Marks and Spencer require on orders over 10 metric tons. The Woolmark Company’s SustainaWOOL program attracted 87 mills within a year, and certified lots now achieve 8-15% auction premiums. Certification costs range from USD 5,000 to USD 25,000 per facility, but mills typically recover their investments within 18 months through higher price points.
Regulatory Pressure Shifting Synthetics Toward Biodegradable Wool
The European Union’s Ecodesign Regulation 2024/1781 requires apparel brands to include fiber content in digital passports by 2027 and imposes a penalty of 4% of regional revenue for non-compliance. Wool passes the bloc’s biodegradability test under EN 13432, whereas polyester fails. France’s amended Anti-Waste Law now adds a EUR 0.50 (USD 0.54) fee per synthetic-dominant garment, effectively shrinking the wool-polyester price gap. California’s microfiber filtration law intensifies the trend in North America by steering consumers toward natural fibers to sidestep appliance upgrades.
Expansion of Thermal-Insulation Uses in Building Materials
Thermafleece sheep-wool batts hold Environmental Product Declaration (EPD) credentials, documenting a negative global warming potential of -0.006 metric tons carbon dioxide equivalent per metric ton, a data point that helps projects earn credits. United Kingdom retrofit demand jumped 40% in 2024, with Part L building codes setting strict U-values that wool blankets meet at thinner profiles than mineral wool. Germany allocated EUR 500 million (USD 540 million) in 2025 subsidies for bio-based retrofits, covering 25% of the installed costs when insulation is sourced from European farms. Fire-class Euroclass E limits high-rise use, confining growth to low-rise and residential projects.
Restraints Impact Analysis of Wool Market*
| Restraint | (~) % Impact on CAGR Forecast | Geographic Relevance | Impact Timeline |
|---|---|---|---|
| Decline in sheep numbers in traditional producing countries | -0.5% | Australia, New Zealand, Europe, and North America | Medium term (2-4 years) |
| Environmental scrutiny on animal-welfare practices reducing brand uptake | -0.4% | Europe and North America brand headquarters | Short term (≤2 years) |
| Volatility of lanolin by-product prices squeezing scouring margins | -0.3% | Australia, New Zealand, China, and Europe | Short term (≤2 years) |
| Competition from emerging plant-based biofibers in technical composites | -0.3% | Europe, North America, and Asia-Pacific automotive hubs | Long term (≥4 years) |
| Source: Mordor Intelligence | |||
Decline in Sheep Numbers in Traditional Producing Countries
Structural contraction in sheep inventories across Australia, New Zealand, and Europe is tightening raw-material supply and elevating price floors that deter volume-oriented textile mills from substituting wool for synthetics. Australia’s flock fell to 63.7 million head in 2024, a 12% decline from 2020, shrinking the 2024-2025 clip to 280 thousand metric tons of greasy wool. New Zealand’s herd dropped to 25.8 million, curbing exports to 108 thousand metric tons of greasy [3]Source: Australian Bureau of Agricultural and Resource Economics and Sciences, “Sheep Inventory 2024,” agriculture.gov.au. Labor shortages exacerbate the pinch as shearing contractors now command AUD 4.50-5.00 (USD 2.90-3.20) per animal, up 25% from 2020. European Union breeding ewe numbers also fell by 9% over five years, mainly in Spain, France, and the United Kingdom, further tightening the supply.
Environmental Scrutiny on Animal-Welfare Practices Reducing Brand Uptake
Activist campaigns targeting mulesing and live-export practices have compelled fashion brands to impose sourcing restrictions, which fragment supply chains and increase compliance costs for wool producers. Australian Wool Exchange data show that non-mulesed bales increased 5% year-on-year in 2024, yet the category still accounts for fewer than 15% of total auction volumes, reflecting the slow pace of on-farm practice change and the reluctance of older graziers to adopt alternative flystrike-prevention methods such as genetic selection for plain-bodied sheep or chemical treatments that require additional labor and veterinary oversight.
*Our forecasts treat driver/restraint impacts as directional, not additive. The impact forecasts reflect baseline growth, mix effects, and variable interactions.
Geography Analysis
APAC Wool Market
Asia-Pacific commanded 46.8% of the wool market share in 2025, anchored by China’s scouring, spinning, and weaving complexes that handle three-fifths of greasy-wool imports. India’s handloom exports in 2024-2025 show continued momentum as European and North American retailers emphasize lower-carbon, artisan-made textiles. Yet, downside risks include Shandong Ruyi’s 2024 bankruptcy and a shrinking fine-wool supply from Australia’s 280,000 metric tons of greasy clip, both of which strain Chinese mills that rely on Merino for gauge-fine knitwear. Japan’s imports fell 8% in 2024 as consumers shifted to synthetic performance wear, while South Korea redirected investment toward recycled polyester to satisfy Extended Producer Responsibility laws enacted in 2025.
Middle East Wool Market
The Middle East is projected to deliver the fastest growth at a 5.2% CAGR through 2031. Turkey’s worsted mills ship high-quality suiting within 48 hours to European fashion houses, leveraging proximity to mitigate supply-chain risk. Oman attracted USD 120 million in foreign direct investment for cut-make-trim facilities in Sohar Free Zone, capitalizing on zero-duty entry across Gulf Cooperation Council markets and preferential tariffs under the Gulf Cooperation Council-Singapore Free Trade Agreement. Limited regional scouring infrastructure remains a bottleneck, maintaining dependence on imported semi-processed wool.
Europe Wool Market
Europe absorbed global consumption in 2025, spearheaded by Italy’s Biella district, where Loro Piana, Vitale Barberis Canonico, and Ermenegildo Zegna together spin 35,000 metric tons of fine Merino annually. Germany’s Südwolle has added a 2,000 metric ton dyehouse in Vietnam, but maintains its domestic plants for premium counts that require tighter tolerances. United Kingdom mills pivoted to sheep-wool insulation after Brexit tariffs dented suiting exports, and Thermafleece secured a 15% share of the United Kingdom's bio-based insulation market. The ports of Rotterdam and Antwerp remain redistribution hubs, forwarding tops and yarns to Eastern European sewing centers that benefit from labor costs 40% lower than those in Western Europe. Compliance with the European Union Ecodesign Regulation and Digital Product Passports is pushing mills lacking digital traceability systems to modernize rapidly or risk losing access to the bloc’s 450 million-consumer market.


Regulatory Landscape
Regulation affecting wool trade and downstream use is increasingly tied to traceability, labeling, and biosecurity compliance. In the European Union, Ecodesign Regulation 2024/1781 links market access to product information requirements, with Digital Product Passports requiring fiber-content disclosure by 2027 and enforcement provisions that include penalties of up to 4% of regional revenue for non-compliance, as cited in the report context. In the United States, wool and wool-blend products remain subject to the Wool Products Labeling Act of 1939, administered via Federal Trade Commission rules on labeling and recordkeeping, which emphasizes accurate fiber-content claims and manufacturer documentation.
Animal health and welfare rules also affect cross-border flows of greasy and semi-processed wool. In June 2026, China lifted a temporary wool import ban affecting Lesotho, conditional on adherence to WOAH technical requirements for foot-and-mouth disease virus inactivation, illustrating how biosecurity protocols can tighten or reopen supply channels quickly. In parallel, the United Kingdom implemented the Sheep Carcase (Classification and Price Reporting) Regulations in 2025 (effective in 2026), requiring large slaughterhouses (2,000+ sheep per week) to undertake carcase classification and price reporting. That requirement improves price discovery and data availability that feeds into sheep and wool economics.
Value Chain Analysis
The global wool value chain begins with farm production and on-farm classing, then moves to broker aggregation, auction or direct contracting, core testing and certification, scouring, and combing into tops, before spinning, fabric formation, and conversion into apparel, interior textiles, and technical products. Australia remains a key upstream node, with auction infrastructure (including AWEX platforms and testing) supporting high-volume trade, although supply tightness shows up in Australia’s confirmed 2024-25 production decline to 280.1 million kilograms (greasy). Cost pressures are also visible, including higher shearing rates and drought impacts in regions such as Victoria and South Australia. China continues to anchor midstream processing by absorbing a dominant share of Australian wool imports in 2024-25, reinforcing the industry’s reliance on a concentrated set of scouring and spinning complexes for throughput.
Value capture increasingly depends on verified sustainability and digital chain-of-custody, which adds service layers around certification, data capture, and claims assurance. Programs and standards such as the Responsible Wool Standard, ZQ, and mill-focused schemes (including Woolmark programs and the Australian Wool Sustainability Scheme) shape procurement eligibility and auction premiums, driving more coordination between growers, exporters, and mills. Industry-led initiatives, including Woolmark+ (launched in 2024) and the Australian Wool Industry Insetting Program supported by an Australian Government grant, are extending chain management beyond physical handling into measurement and insetting mechanisms that connect brands to on-farm environmental outcomes.
Competitive Landscape
The wool market competition is split into two strategic approaches, with cost-focused Chinese and Indian scourers targeting high volumes and premium European and Australasian mills establishing exclusive farm partnerships for ultra-fine Merino wool. Italian houses, such as Loro Piana, Vitale Barberis Canonico, and Ermenegildo Zegna, collectively transform roughly 35,000 metric tons of fine wool in Biella, retailing fabrics at prices exceeding USD 1,500 per linear meter. This bifurcation enables regional cooperatives and specialty mills to win premiums through certifications like the Responsible Wool Standard and ZQ Merino, which resonate with luxury and outdoor brands.
Digital innovation now acts as a margin lever because blockchain provenance platforms tag bales at the farm level, unlocking 10-20% price uplifts for traceable lots. Australian Wool Innovation and Everledger piloted the use of cryptographic hashes in laboratory test certificates for 50,000 bales, enabling buyers to automate due diligence checks through application programming interfaces. Australian Wool Exchange’s web-based auction already processes 85% of the national clip and is trialing algorithmic bidding tied to real-time micron data and non-mulesed status, compressing price discovery from weeks to days. Mills lacking digital infrastructure risk exclusion from European Union supplier lists once Digital Product Passports become compulsory in 2027.
Corporate moves show both expansion and retreat. Chargeurs bought Swiss finisher Cilander for EUR 653.2 million (USD 706 million) in July 2024 to integrate low-water dyeing and digital printing that shorten fashion lead times. Loro Piana paid more than AUD 200,000 (USD 129,000) for a 10.2-micron Record Bale in 2024, cementing its grip on the ultra-fine segment. These shifts, combined with volatile lanolin co-product margins, keep competitive intensity balanced and allow agile players to capture sustainability premiums while volume-centric processors chase thinning cost advantages.
Market Opportunities and Future Outlook
Traceability tooling and data-linked certification are creating near-term opportunities for service providers and intermediaries that can connect growers, exporters, mills, and brands with auditable chain-of-custody data. In June 2026, NATIVA moved NATIVA Wool (and NATIVA Cotton) onto the TextileGenesis platform, replacing PDF-based certification with a digital chain of custody, and New Zealand Merino has advanced 100% digital traceability for ZQ and ZQRX wool. As the European Union moves toward Digital Product Passports by 2027, processors and exporters that can deliver bale-to-garment provenance, including non-mulesed status and test results, have a clearer path to premium procurement lists, while technology vendors benefit from retrofit demand at mill and broker levels.
Non-apparel outlets are also broadening the demand base where wool’s performance and sustainability attributes align with policy and procurement. Building insulation channels in Europe show pull-through from retrofit policy support, including Germany’s 2025 subsidies for bio-based retrofits and United Kingdom building-code-driven retrofit activity, supporting sheep-wool batts and blankets where specifications favor moisture buffering and lower embodied-carbon claims. In technical textiles, commercialization efforts around wool-based hygiene and nonwovens (such as Woolchemy material development) expand potential offtake for crossbred and strong wool that is less exposed to luxury fashion cycles. Direct, multi-year supply contracts and brand-to-farm investments, for example organic and regenerative sourcing programs, also provide a structure for stabilizing raw-material availability amid flock contraction in key producing countries.
Recent Industry Developments in Wool Market
- July 2026: Wools of New Zealand signed a partnership with Chinese manufacturer Anmao and renewed ties with Saibosi and Yangxin Ruixin. The agreement supports market access for strong wool into China and enables more structured offtake relationships beyond spot trading. It also reinforces the role of coordinated supply programs as processors and brands seek clearer provenance and consistency.
- June 2025: Chargeurs Luxury Fibers signed a long-term partnership with SMCP to supply certified NATIVA regenerative wool. The deal deepens downstream pull for verified regenerative and traceable lots, supporting premiumization strategies for growers and processors that meet NATIVA requirements. It also indicates ongoing brand-side commitment to audited sourcing programs as compliance and reporting expectations rise.
- July 2024: Chargeurs SA acquired Cilander, a Swiss textile finishing specialist, to add capabilities in finishing, including lower-water dyeing and digital printing for shorter production runs. The acquisition supports more integrated European processing routes for high-value wool fabrics and improves responsiveness to luxury and premium apparel sourcing cycles. It also raises the importance of finishing technology as mills compete on sustainability credentials and lead-time reduction.


Wool Market Report Scope and Research Methodology
Market Definition and Coverage
For this methodology, the wool market covers the annual value of animal-based wool that is sold as raw fiber or after first-stage processing (tops, yarn, or fabric) for apparel, interior textiles, and technical textile uses, across all major producing and consuming regions.
Scope exclusions: We exclude mineral wool insulation, synthetic fleece, and recycled fibers that are not derived from animals.
Segments Covered in This Report
- By Geography
- North America
- United States
- Production Analysis (Area Harvested, Yield, and Production Volume)
- Consumption Analysis (Consumption Value and Volume)
- Import Market Analysis (Import Value, Volume, and Key Supplying Markets)
- Export Market Analysis (Export Value, Volume, and Key Destination Markets)
- Wholesale Price Trend Analysis and Forecast
- Regulatory Framework
- List of Key Players
- Logistics and Infrastructure
- Seasonality Analysis
- Mexico
- Production Analysis (Area Harvested, Yield, and Production Volume)
- Consumption Analysis (Consumption Value and Volume)
- Import Market Analysis (Import Value, Volume, and Key Supplying Markets)
- Export Market Analysis (Export Value, Volume, and Key Destination Markets)
- Wholesale Price Trend Analysis and Forecast
- Regulatory Framework
- List of Key Players
- Logistics and Infrastructure
- Seasonality Analysis
- United States
- Europe
- Germany
- Production Analysis (Area Harvested, Yield, and Production Volume)
- Consumption Analysis (Consumption Value and Volume)
- Import Market Analysis (Import Value, Volume, and Key Supplying Markets)
- Export Market Analysis (Export Value, Volume, and Key Destination Markets)
- Wholesale Price Trend Analysis and Forecast
- Regulatory Framework
- List of Key Players
- Logistics and Infrastructure
- Seasonality Analysis
- Italy
- Production Analysis (Area Harvested, Yield, and Production Volume)
- Consumption Analysis (Consumption Value and Volume)
- Import Market Analysis (Import Value, Volume, and Key Supplying Markets)
- Export Market Analysis (Export Value, Volume, and Key Destination Markets)
- Wholesale Price Trend Analysis and Forecast
- Regulatory Framework
- List of Key Players
- Logistics and Infrastructure
- Seasonality Analysis
- United Kingdom
- Production Analysis (Area Harvested, Yield, and Production Volume)
- Consumption Analysis (Consumption Value and Volume)
- Import Market Analysis (Import Value, Volume, and Key Supplying Markets)
- Export Market Analysis (Export Value, Volume, and Key Destination Markets)
- Wholesale Price Trend Analysis and Forecast
- Regulatory Framework
- List of Key Players
- Logistics and Infrastructure
- Seasonality Analysis
- Netherlands
- Production Analysis (Area Harvested, Yield, and Production Volume)
- Consumption Analysis (Consumption Value and Volume)
- Import Market Analysis (Import Value, Volume, and Key Supplying Markets)
- Export Market Analysis (Export Value, Volume, and Key Destination Markets)
- Wholesale Price Trend Analysis and Forecast
- Regulatory Framework
- List of Key Players
- Logistics and Infrastructure
- Seasonality Analysis
- Belgium
- Production Analysis (Area Harvested, Yield, and Production Volume)
- Consumption Analysis (Consumption Value and Volume)
- Import Market Analysis (Import Value, Volume, and Key Supplying Markets)
- Export Market Analysis (Export Value, Volume, and Key Destination Markets)
- Wholesale Price Trend Analysis and Forecast
- Regulatory Framework
- List of Key Players
- Logistics and Infrastructure
- Seasonality Analysis
- Germany
- Asia-Pacific
- China
- Production Analysis (Area Harvested, Yield, and Production Volume)
- Consumption Analysis (Consumption Value and Volume)
- Import Market Analysis (Import Value, Volume, and Key Supplying Markets)
- Export Market Analysis (Export Value, Volume, and Key Destination Markets)
- Wholesale Price Trend Analysis and Forecast
- Regulatory Framework
- List of Key Players
- Logistics and Infrastructure
- Seasonality Analysis
- India
- Production Analysis (Area Harvested, Yield, and Production Volume)
- Consumption Analysis (Consumption Value and Volume)
- Import Market Analysis (Import Value, Volume, and Key Supplying Markets)
- Export Market Analysis (Export Value, Volume, and Key Destination Markets)
- Wholesale Price Trend Analysis and Forecast
- Regulatory Framework
- List of Key Players
- Logistics and Infrastructure
- Seasonality Analysis
- Japan
- Production Analysis (Area Harvested, Yield, and Production Volume)
- Consumption Analysis (Consumption Value and Volume)
- Import Market Analysis (Import Value, Volume, and Key Supplying Markets)
- Export Market Analysis (Export Value, Volume, and Key Destination Markets)
- Wholesale Price Trend Analysis and Forecast
- Regulatory Framework
- List of Key Players
- Logistics and Infrastructure
- Seasonality Analysis
- New Zealand
- Production Analysis (Area Harvested, Yield, and Production Volume)
- Consumption Analysis (Consumption Value and Volume)
- Import Market Analysis (Import Value, Volume, and Key Supplying Markets)
- Export Market Analysis (Export Value, Volume, and Key Destination Markets)
- Wholesale Price Trend Analysis and Forecast
- Regulatory Framework
- List of Key Players
- Logistics and Infrastructure
- Seasonality Analysis
- Australia
- Production Analysis (Area Harvested, Yield, and Production Volume)
- Consumption Analysis (Consumption Value and Volume)
- Import Market Analysis (Import Value, Volume, and Key Supplying Markets)
- Export Market Analysis (Export Value, Volume, and Key Destination Markets)
- Wholesale Price Trend Analysis and Forecast
- Regulatory Framework
- List of Key Players
- Logistics and Infrastructure
- Seasonality Analysis
- China
- South America
- Brazil
- Production Analysis (Area Harvested, Yield, and Production Volume)
- Consumption Analysis (Consumption Value and Volume)
- Import Market Analysis (Import Value, Volume, and Key Supplying Markets)
- Export Market Analysis (Export Value, Volume, and Key Destination Markets)
- Wholesale Price Trend Analysis and Forecast
- Regulatory Framework
- List of Key Players
- Logistics and Infrastructure
- Seasonality Analysis
- Argentina
- Production Analysis (Area Harvested, Yield, and Production Volume)
- Consumption Analysis (Consumption Value and Volume)
- Import Market Analysis (Import Value, Volume, and Key Supplying Markets)
- Export Market Analysis (Export Value, Volume, and Key Destination Markets)
- Wholesale Price Trend Analysis and Forecast
- Regulatory Framework
- List of Key Players
- Logistics and Infrastructure
- Seasonality Analysis
- Brazil
- Middle East
- United Arab Emirates
- Production Analysis (Area Harvested, Yield, and Production Volume)
- Consumption Analysis (Consumption Value and Volume)
- Import Market Analysis (Import Value, Volume, and Key Supplying Markets)
- Export Market Analysis (Export Value, Volume, and Key Destination Markets)
- Wholesale Price Trend Analysis and Forecast
- Regulatory Framework
- List of Key Players
- Logistics and Infrastructure
- Seasonality Analysis
- Saudi Arabia
- Production Analysis (Area Harvested, Yield, and Production Volume)
- Consumption Analysis (Consumption Value and Volume)
- Import Market Analysis (Import Value, Volume, and Key Supplying Markets)
- Export Market Analysis (Export Value, Volume, and Key Destination Markets)
- Wholesale Price Trend Analysis and Forecast
- Regulatory Framework
- List of Key Players
- Logistics and Infrastructure
- Seasonality Analysis
- Turkey
- Production Analysis (Area Harvested, Yield, and Production Volume)
- Consumption Analysis (Consumption Value and Volume)
- Import Market Analysis (Import Value, Volume, and Key Supplying Markets)
- Export Market Analysis (Export Value, Volume, and Key Destination Markets)
- Wholesale Price Trend Analysis and Forecast
- Regulatory Framework
- List of Key Players
- Logistics and Infrastructure
- Seasonality Analysis
- Oman
- Production Analysis (Area Harvested, Yield, and Production Volume)
- Consumption Analysis (Consumption Value and Volume)
- Import Market Analysis (Import Value, Volume, and Key Supplying Markets)
- Export Market Analysis (Export Value, Volume, and Key Destination Markets)
- Wholesale Price Trend Analysis and Forecast
- Regulatory Framework
- List of Key Players
- Logistics and Infrastructure
- Seasonality Analysis
- United Arab Emirates
- Africa
- South Africa
- Production Analysis (Area Harvested, Yield, and Production Volume)
- Consumption Analysis (Consumption Value and Volume)
- Import Market Analysis (Import Value, Volume, and Key Supplying Markets)
- Export Market Analysis (Export Value, Volume, and Key Destination Markets)
- Wholesale Price Trend Analysis and Forecast
- Regulatory Framework
- List of Key Players
- Logistics and Infrastructure
- Seasonality Analysis
- Morocco
- Production Analysis (Area Harvested, Yield, and Production Volume)
- Consumption Analysis (Consumption Value and Volume)
- Import Market Analysis (Import Value, Volume, and Key Supplying Markets)
- Export Market Analysis (Export Value, Volume, and Key Destination Markets)
- Wholesale Price Trend Analysis and Forecast
- Regulatory Framework
- List of Key Players
- Logistics and Infrastructure
- Seasonality Analysis
- South Africa
- North America
Data Sources, Market Sizing, and Validation
Desk Research
Desk research was used to set market boundaries and anchor the model to observable supply and trade signals before forecasting. We reviewed public datasets such as UN Comtrade trade statistics, FAOSTAT livestock and fiber outputs, and the International Trade Centre trade dashboards to understand cross-border movement and reported values.
We also referred to sources such as the International Wool Textile Organisation publications, customs tariff schedules for HS 51 mapping, and peer-reviewed textile science papers on clean-yield ranges and micron-based pricing behavior. Company annual reports, investor presentations, and reputable business press were used to cross-check processor footprints and demand exposure by end-use. Where available, we supplemented with paid subscriptions for company financials and news, and patent databases to track shifts in technical wool processing. The desk sources listed here are illustrative, and we relied on additional public references during data collection, validation, and clarification.
Primary Interviews and Surveys
Primary work focused on validating how wool is priced and sold across the chain, and how much value sits at farm-gate versus first-stage processing. We spoke with a mix of wool growers or brokers, processors, traders, and downstream textile buyers across APAC, EMEA, and the Americas, so assumptions could be checked against real contracting, yield, and grade-mix behavior.
Distribution of primary research fieldwork respondents
| Company type | Respondent position | Region |
|---|---|---|
| Top tier: 34% | CXOs: 12% | APAC: 45% |
| Mid tier: 52% | Functional/Unit leaders: 30% | EMEA: 35% |
| Smaller Players: 14% | Managers: 58% | Americas: 20% |
Market-Sizing & Forecasting
Our sizing starts from a top-down reconstruction that uses production and trade data to build a realistic demand and supply pool, which is then translated into value using grade-linked pricing. In practice, greasy wool volumes are adjusted with clean-yield ranges, mapped to traded forms (raw, scoured, tops, yarn, fabric), and then valued with average prices that move by micron profile and processing stage.
To keep the totals grounded, we corroborated the outputs with selective bottom-up approximations, such as sampled processor throughput multiplied by typical conversion margins, plus channel checks on exported value versus domestic offtake. Key model inputs included greasy wool production levels, clean yield factors, micron mix and price spreads, export and import values for HS 51 products, and the share of wool directed into apparel versus interiors and technical textiles. For the forecast, scenario analysis was used so price and volume paths could be adjusted for signals like sheep flock cycles, pasture conditions, and mill demand sentiment shared by interviewees. Where the bottom-up view had gaps, for example limited visibility on smaller local trading, the model relied on trade ratios and regional conversion norms, then was rechecked with experts before finalizing.
Data Validation & Update Cycle
Validation is done through multiple checks so the final numbers do not rely on a single dataset or one strong assumption. We compare the model outputs against independent signals such as trade-value totals, production trends, and known processing capacity, then investigate outliers that show unusual price jumps or volume drops.
A second analyst review is completed to verify mapping logic, unit conversions, and currency handling, followed by re-contacting selected respondents when a variance cannot be explained using public data. Reports are refreshed annually, and interim updates are made when material events occur, such as sharp commodity price moves or trade policy changes. Before delivery, a final pass is performed so clients receive the latest updated view that still matches the defined scope and calculation steps.
Mordor Intelligence's Wool Market Size Versus Other Published Estimates
Published wool market values often differ because the boundary of what counts as "wool" is not consistent, and the pricing stage used in the calculation changes the total significantly. Some estimates stay close to trade receipts, while others try to represent a fuller value pool that includes early processing and domestic conversion.
By tracking clean-yield adjusted production, traded forms, and grade-linked pricing, Mordor Intelligence keeps the total tied to farm output and first-stage processing value, instead of mixing in finished apparel or using exports alone as the demand proxy.
Benchmark comparison
| Source | Market Size | Gaps in Research Methodology |
|---|---|---|
| Mordor Intelligence | USD 44.20 B (2026) | |
| Industry Data Portal A | USD 9.60 B (2022) | Uses export value as the market proxy for all wool types, which can miss domestic consumption and double counts can be avoided only if processing stages are excluded. |
| Trade Journal B | USD 8.00 B (2022) | Limits scope to wool fabric only, which excludes raw fiber and intermediate products like tops and yarn, thereby producing a smaller value estimate. |
The spread across the table mainly comes from scope and value-stage choices, not from a single right or wrong number. When the market is defined around traded value only, or around fabric alone, the result will sit well below a supply plus first-stage conversion view. Our approach is designed so assumptions can be traced back to production, yield, trade mapping, and price spreads that can be rechecked and repeated each year.


Key Questions Answered in the Report
What is the projected value of the wool market by 2031?
It is forecast to reach USD 56.95 billion, advancing at a 5.20% compound annual growth rate from 2026 to 2031.
Which region dominated global wool processing in 2025?
Asia-Pacific led with 46.8% of revenue in 2025, driven by China's integrated scouring, spinning, and weaving capacity.
Why are brands demanding certified wool?
Digital traceability and animal-welfare assurances lower reputational risk and satisfy European Union Ecodesign rules that require fiber-origin disclosure.
How are building codes influencing wool insulation demand?
Subsidies in Germany and strict United Kingdom U-value thresholds favor sheep-wool batts that deliver negative embodied carbon and moisture regulation.
What restrains wool supply growth in Australia?
Sheep numbers declined to 63.7 million and shearing labor shortages push up costs, limiting the greasy-wool clip to 280 thousand metric tons of greasy wool.
Which end-use segment shows the fastest growth?
Technical and military textiles, including flame-resistant uniforms, are expanding faster than fashion apparel because of stable procurement contracts and performance mandates.
Page last updated on:


 Your data is secure and never sold or shared.


