
Market Overview
| Study Period | 2021 - 2031 |
|---|---|
| Market Volume (2026) | 3.54 Million tons |
| Market Volume (2031) | 4.23 Million tons |
| Growth Rate (2026 - 2031) | 3.61 % |
| Fastest Growing Market | Asia Pacific |
| Largest Market | Asia Pacific |
| Market Concentration | Medium |
Major Players *Disclaimer: Major Players sorted in no particular order Image © Mordor Intelligence. Reuse requires attribution under CC BY 4.0. | |
Wood Coatings Market Analysis by Mordor Intelligence
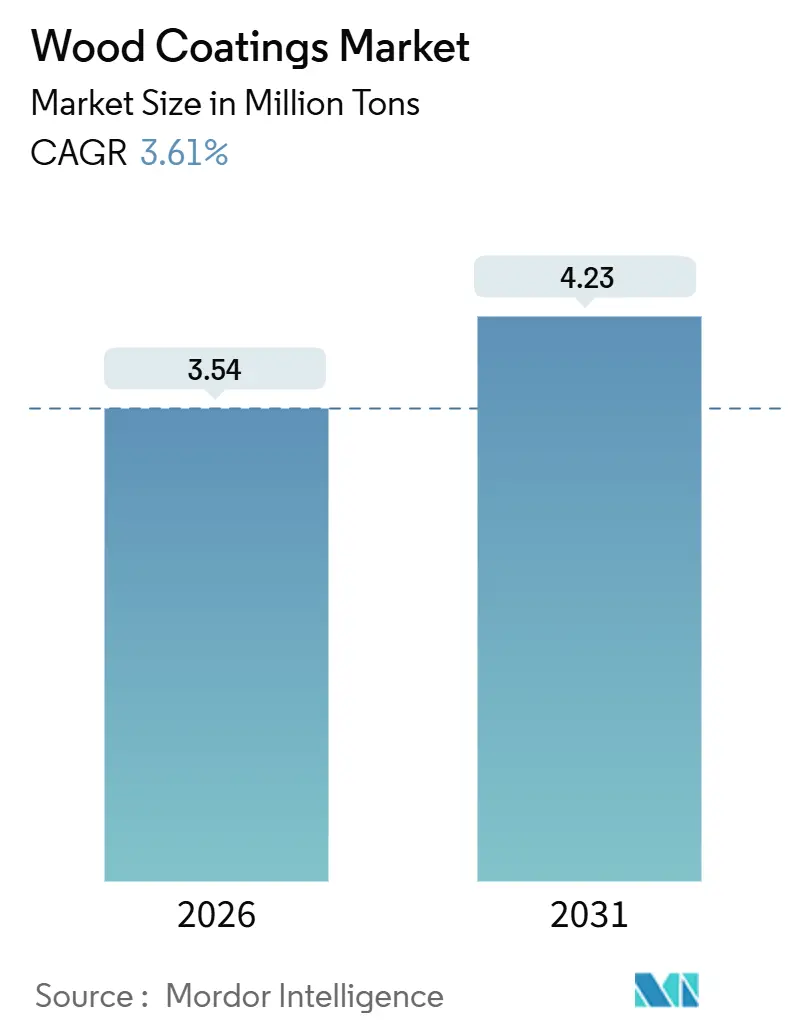
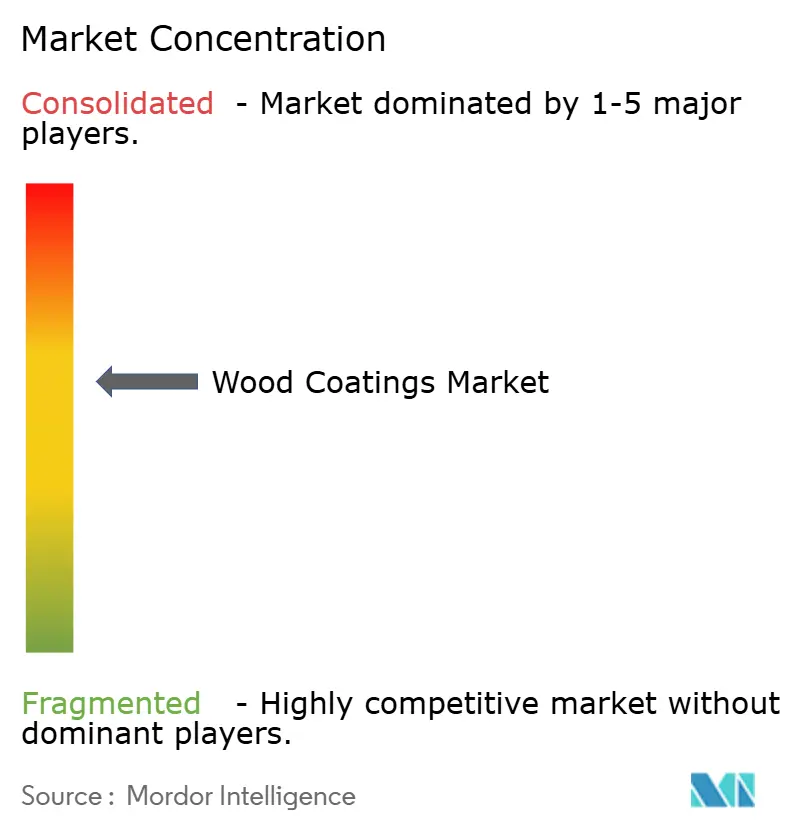
The Wood Coatings Market size is estimated at 3.54 million tons in 2026, and is expected to reach 4.23 million tons by 2031, at a CAGR of 3.61% during the forecast period (2026-2031). Solvent-borne lines still dominate finishing halls, yet regulatory pressure in Europe and California and the cost advantage of ready-to-assemble (RTA) furniture in the Asia-Pacific are steering investments toward waterborne and UV-cured chemistries. Asia-Pacific furniture exporters continue to absorb higher resin prices through plant automation and inline quality control, while North American remodelers sustain demand for premium low-sheen polyurethane clears. Abrasion-resistant polyurethane resins remain the backbone of mass-timber interiors, and the rollout of AI-enabled pigment dosing is trimming waste and offsetting the 15-20% price premium attached to waterborne dispersions. Competitive intensity stays moderate, with the top five suppliers controlling 38% of global tonnage and regional specialists exploiting niches that reward formulation tweaks for local wood species.
Key Report Takeaways
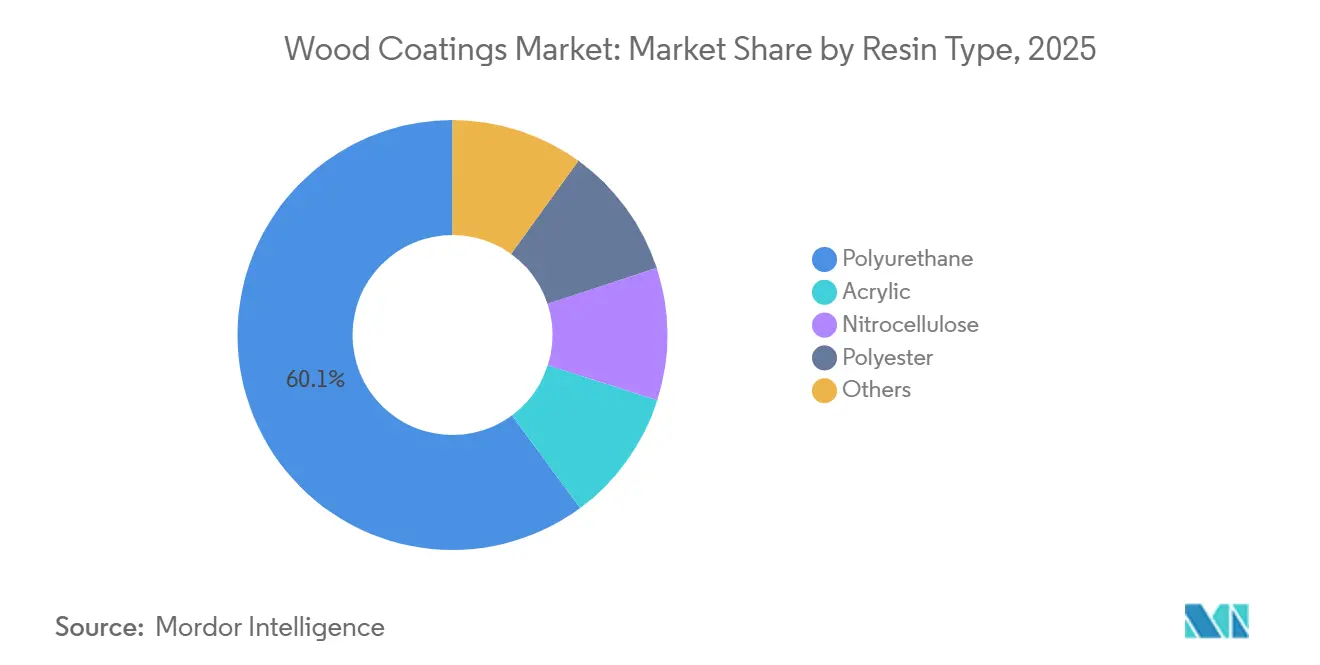
- By resin type, polyurethane held a 60.14% Wood Coatings market share in 2025, and it is projected to expand at a 3.82% CAGR through 2031.
- By technology, solvent-borne finishes commanded 78.12% of the Wood Coatings market size in 2025, while waterborne systems are on track for the fastest 4.35% CAGR to 2031.
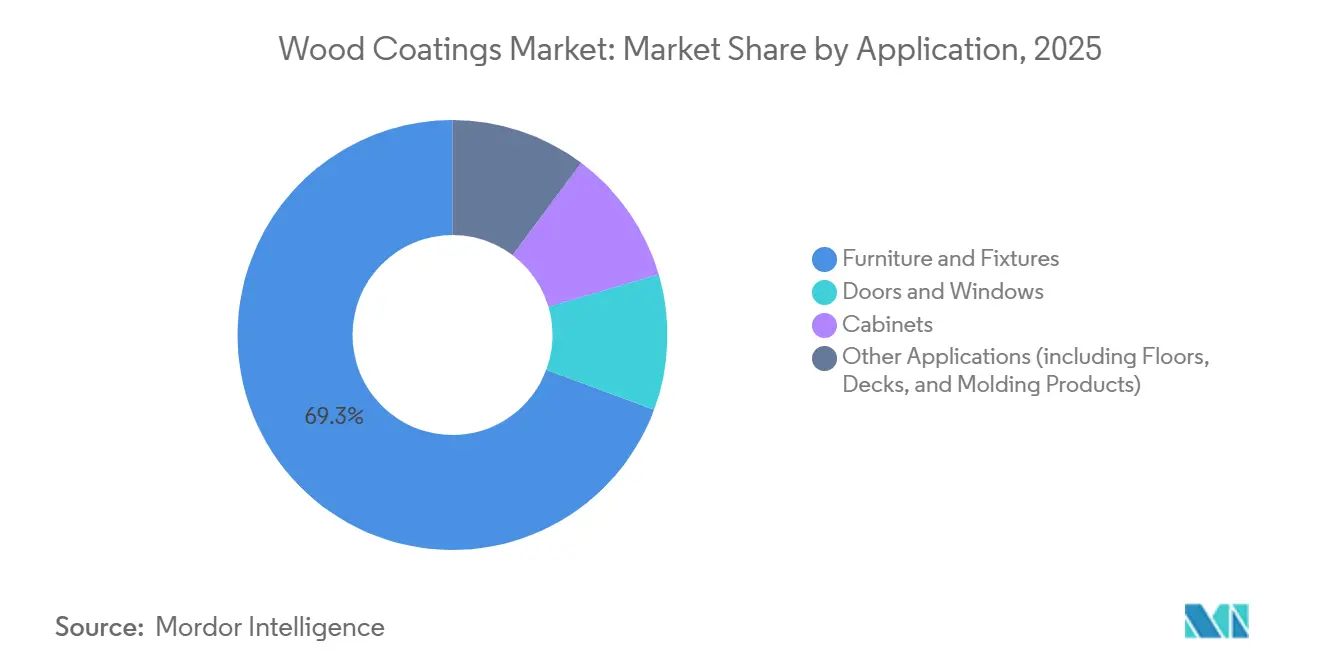
- By application, furniture and fixtures led with 69.34% of Wood Coatings market share in 2025; the segment is forecast to rise at 3.75% CAGR through 2031.
- By geography, Asia-Pacific accounted for 56.68% of the Wood Coatings market size in 2025 and is set to post the quickest 3.91% CAGR over the outlook period.
Note: Market size and forecast figures in this report are generated using Mordor Intelligence’s proprietary estimation framework, updated with the latest available data and insights as of January 2026.
Market Trends and Insights
Drivers Impact Analysis of Wood Coatings Market*
| Drivers | (~) % Impact on CAGR Forecast | Geographic Relevance | Impact Timeline |
|---|---|---|---|
| Modular and RTA furniture boom in Asia-Pacific | +0.8% | China, India, Vietnam, Indonesia, Thailand | Medium term (2-4 years) |
| EU-led shift to low-VOC waterborne formulations | +0.6% | Europe, California, Northeast U.S. | Long term (≥4 years) |
| Premium interior décor trend in North America | +0.4% | United States, Canada | Short term (≤2 years) |
| Mass-timber high-rise adoption elevating clear UV demand | +0.5% | North America, Nordic Europe, Germany, Austria | Medium term (2-4 years) |
| AI-enabled inline color matching | +0.3% | Early adoption in Europe and North America, global rollout post-2028 | Long term (≥4 years) |
| Source: Mordor Intelligence | |||
Modular and RTA Furniture Boom in Asia-Pacific
Ready-to-assemble formats now account for 60–70% of India’s organized furniture sales, pushing finishing lines for furniture wood coatings toward fast-curing waterborne topcoats that tolerate flat-pack boxing within 24 hours[1]. Vietnam’s wood and furniture exports jumped 21% in 2024 to USD 16.3 billion, and the local association targets USD 18 billion in 2025 as EU buyers seek EUDR-compliant suppliers. Thailand produced 6.63 million wooden furniture pieces in 2024, up 14.46%, while Indonesia shipped USD 2.02 billion of furniture, keeping wooden articles above 50% of export value. China’s coastal clusters generated CNY 535.52 billion (USD 73.9 billion) in furniture revenue during the first ten months of 2024, with exports climbing 7.2% to USD 54.932 billion. These production hubs favor two-component polyurethane clears that hit ≥2H pencil hardness at ambient cure, positioning the driver to add 0.8 percentage points to the regional CAGR.
EU-Led Shift to Low-VOC Waterborne Formulations
Directive 2004/42/EC caps VOC content at 400 g/L for interior and 300 g/L for exterior wood finishes, forcing a reevaluation of solvent-heavy alkyds and nitrocellulose lacquers[2]. Regulation (EU) 2023/1464 also limits formaldehyde release to 0.062 mg/m³, tightening material specs for panel producers. The EU Ecolabel now requires interior coatings below 30 g/L VOC, a threshold only waterborne dispersions reliably meet. Akzo Nobel disclosed that 60% of its 2024 sales stemmed from sustainable products, and PPG opened a waterborne plant in Rayong, Thailand, to serve EU-bound furniture exporters. California Air Resources Board mirrors the restriction with a 550 g/L limit for clear finishes, reinforcing the 0.6 point uplift in long-term CAGR.
Premium Interior Décor Trend in North America
U.S. homeowners spent USD 485 billion on remodeling in 2024, with kitchen and bath upgrades claiming 42%. Low-sheen polyurethane and acrylic-polyurethane hybrids dominate cabinetry specs because they resist yellowing under LED lighting. Sherwin-Williams posted USD 6.16 billion in third-quarter 2024 net sales, citing mid-single-digit growth in wood stains and clears. Benjamin Moore launched a zero-VOC interior finish in 2025 that meets Greenguard Gold and helps projects score LEED v4.1 credits. Canadian housing starts averaged 240,000 units in 2024–25, feeding demand for factory-finished doors and window frames. This décor upswing lifts short-term CAGR by 0.4 points.
Mass-Timber High-Rise Adoption Accelerating Clear UV Finish Demand
North America added 1.2 million m² of cross-laminated timber floor area in 2024, including the University of Toronto’s 14-story Academic Wood Tower. Nordic countries approved 87 mass-timber buildings in 2024, together consuming about 42,000 tons of UV-curable acrylate coatings. Germany eased code barriers to expose CLT up to 22 m heights, provided fire-retardant finishes are applied. Austria’s Lifecycle Tower ONE used 2,800 m³ of CLT coated with waterborne UV acrylics emitting under 10 g/L VOC. Rapid-cure UV clears that reach ≥3H hardness within 10 seconds explain the 0.5 point CAGR boost expected between 2027 and 2029.
Restraints Impact Analysis of Wood Coatings Market*
| Restraints | (~) % Impact on CAGR Forecast | Geographic Relevance | Impact Timeline |
|---|---|---|---|
| Resin and solvent price volatility | -0.5% | Acute in Europe and North America, global spillover | Short term (≤2 years) |
| Stricter formaldehyde / VOC caps | -0.4% | Europe, North America, China | Medium term (2-4 years) |
| PFAS phase-out threatening performance additives | -0.3% | Regulatory leadership in EU and United States | Long term (≥4 years) |
| Source: Mordor Intelligence | |||
Resin and Solvent Price Volatility
Toluene diisocyanate averaged CNY 14,700/ton (USD 2,041/ton) and polymeric MDI hit CNY 15,200/ton (USD 2,110/ton) in Q3 2025, with force-majeure events limiting European volumes to 70% of contracts. The U.S. Producer Price Index for petrochemicals leaped 13.1% between December 2024 and March 2025 as ethylene exceeded 30 ¢/lb. Asian naphtha averaged USD 547/ton in April 2025, still 18% above the 2020–22 mean. Such swings drive formulators to shorten contract length and delay inventory builds, clipping 0.5 points from near-term CAGR.
Stricter Formaldehyde / VOC Caps
The EU ceiling of 0.062 mg/m³ formaldehyde forces panel producers to swap urea-formaldehyde for melamine or phenolic systems that cost 15–20% more. The U.S. Toxic Substances Control Act aligns with a 0.09 ppm limit on hardwood plywood. China’s draft GB 18580-2017 revision would pull the domestic threshold down to 0.080 mg/m³. Upgraded presses and abatement gear erode margins and remove 0.4 points from mid-term CAGR.
*Our forecasts treat driver/restraint impacts as directional, not additive. The impact forecasts reflect baseline growth, mix effects, and variable interactions.
Wood Coatings Market Segment Analysis
By Resin Type:
Polyurethane Dominance Anchored by Abrasion ResistancePolyurethane commanded 60.14% of the Wood Coatings market in 2025 and will progress at a 3.82% CAGR through 2031, owing to ≥2H pencil hardness and optical clarity essential for mass-timber interiors. Acrylics are witnessing rising demand and are on the back of better UV stability and easy waterborne blending. Nitrocellulose and polyester coatings face a margin squeeze from higher phthalic anhydride prices. Emerging blocked-isocyanate one-packs based on vanillin show 12-month pot life and deblock at 120 °C, mapping neatly onto infrared ovens now common in Vietnamese factories. Acrylic-urethane hybrids captured 9% of the waterborne subsegment in 2025 and could reach 14% by 2031 as they help formulators meet the EU Ecolabel VOC <30 g/L target.
Regulatory stick is speeding the shift. The EU BAT reference for wood treatment mandates closed-loop solvent recovery for nitrocellulose, an upgrade that costs EUR 200,000–500,000 per booth. Polyurethane players reply with systems stable at room temperature yet curing fully during a 15-minute bake, matching throughput at Indonesian and Indian RTA plants. Demand for biobased polyols, able to replace up to 50% of petrochemical content, is rising among buyers pursuing LEED v4 credits, placing smaller Brazilian and Indian formulators on the radar of global OEMs.

By Technology:
Solvent-Borne Incumbency Challenged by Waterborne MomentumSolvent-borne lines delivered 78.12% of the Wood Coatings market volume in 2025, owing to fast dry and legacy equipment. Waterborne finishes, however, are forecast to enjoy a 4.35% CAGR through 2031, the highest among technologies, because they satisfy Directive 2004/42/EC and CARB limits on VOC. UV-cured products will climb as mass-timber builders demand cures under 10 seconds, while powder coatings account for a marginal share because MDF struggles at 180 °C cure.
Switching to waterborne requires stainless piping, bigger compressors, and longer flash zones that stretch oven time to 35–45 minutes. Asian Paints invested INR 5 billion in a Telangana plant in 2024, with 40% dedicated to waterborne production. Nippon Paint scaled Indonesian and Vietnamese capacity with inline viscosity control to hit IKEA’s <250 g/L VOC rule. UV-cured acrylates cost 25–35% more than solvent-borne polyurethanes yet eliminate oven energy and shrink floor space by 30%, an advantage not lost on German door makers chasing energy efficiency labels.
By Application:
Furniture Segment Anchored by APAC Export SurgeFurniture and fixtures absorbed 69.34% of the Wood Coatings market volume in 2025 and are set to expand at a 3.75% CAGR to 2031, underpinned by Vietnam’s USD 16.3 billion export base and planned jump to USD 18 billion in 2025. Doors and windows are witnessing increased wood coatings consumption owing to steady North American housing starts and Europe’s Renovation Wave goal to retrofit 35 million dwellings by 2030. The cabinet application is anticipated to report significant gains in the near future as U.S. kitchen remodels hit USD 203 billion in 2024.
Composite decking, trims, and moldings are witnessing rising demand as UV-resistant topcoats protect color stability. Thailand’s 14.46% output jump and Indonesia’s 52.62% wooden share keep Southeast Asian plants humming. India’s RTA tide further tilts specifications toward fast-cure waterborne polyurethanes, reinforcing the application mix’s sensitivity to residential construction cycles.
Geography Analysis
APAC Wood Coatings Market
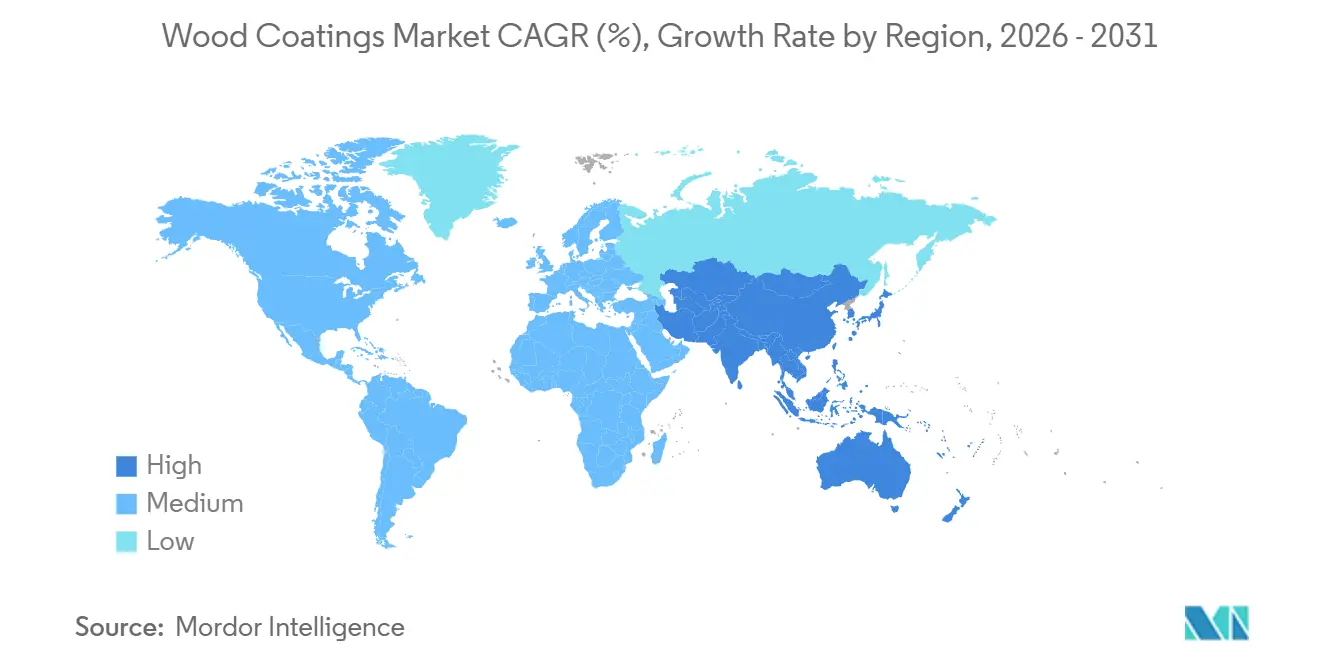
Asia-Pacific accounted for 56.68% of the Wood Coatings market size in 2025 and is projected to rise at a 3.91% CAGR through 2031. China’s CNY 535.52 billion (USD 73.9 billion) furniture revenue and USD 54.932 billion export haul show coastal plants absorbing resin inflation via automation. Vietnam, India, and Indonesia benefit from 40–50% lower labor costs than Guangdong, and India’s Production Linked Incentive scheme rebates 4–6% of incremental domestic furniture sales, enticing coatings makers to co-locate near Ahmedabad and Pune.
North America Wood Coatings Market
Wood coatings demand in North America is witnessing considerable gains as U.S. remodeling stays elevated and Canada maintains 240,000 annual housing starts. Mexican furniture exports to the United States reached USD 4.8 billion in 2024, up 9% year-over-year, underscoring nearshoring momentum.
EMEA and South America Wood Coatings Market
Europe accounted for a considerable market size and is anticipated to register considerable gains in the near future. Germany, France, Italy, and the United Kingdom account for 62% of regional demand, and the Renovation Wave program anchors spending through 2030. Brazil’s housing recovery drives South America's wood coatings market growth, while the Middle East and Africa’s demand is rising as Saudi Arabia’s Vision 2030 real-estate surge fuels demand for fire-retardant wood coatings.
Value Chain Analysis
Upstream inputs for wood coatings center on petrochemical-derived binders (notably polyurethane and acrylic resins), solvents and co-solvents, pigments such as TiO2, and specialty additives that tune flow, scratch resistance, and stain blocking. Volatility and availability in these inputs can narrow formulation choices and influence contract structures, especially for solvent-borne and 2K polyurethane systems used in high-throughput furniture finishing. Midstream, coatings manufacturers blend, tint, and package products in regional plants to manage lead times for OEM programs, while larger suppliers also provide technical support for line set-up, curing windows, and defect troubleshooting to sustain first-pass yield on automated spray and curtain lines.
Downstream, demand is supplied through direct-to-OEM routes for furniture, cabinets, doors, and mass-timber components, while architectural wood finishes also move via paint distributors and specialty dealers. Compliance and traceability expectations in export-oriented furniture hubs have pushed documentation, supplier qualification, and multi-region sourcing deeper into the value chain, alongside a stronger emphasis on waterborne and UV-cured systems to reduce VOC load and shorten cycle times. Logistics and inventory planning remain sensitive to raw material disruptions and regional capacity constraints, which can increase reformulation frequency and raise reliance on approved alternate raw materials.
Competitive Landscape
The wood coating market is moderately consolidated, with key players such as AkzoNobel, PPG Industries, Sherwin-Williams, and Asian Paints leveraging extensive product portfolios and global distribution networks to dominate furniture OEM and architectural channels. In contrast, smaller regional players focus on sustainability-driven niches, addressing market gaps often overlooked by larger competitors. The adoption of digitalization, including cloud-based formulation management and augmented-reality spray training, is transforming the industry by reducing time-to-market for new color programs. Buyers prioritize suppliers that ensure regulatory compliance, maintain supply chain reliability, and deliver robust design support, driving continuous investments in service capabilities across the wood coatings sector.
Wood Coatings Industry Leaders
-
The Sherwin-Williams Company
-
PPG Industries Inc.
-
Akzo Nobel N.V.
-
Nippon Paint Holdings Co., Ltd.
-
Asian Paints
- *Disclaimer: Major Players sorted in no particular order
Wood Coatings Market Companies Covered in this Report
- Akzo Nobel N.V.
- Asian Paints
- Axalta Coating Systems
- Benjamin Moore & Co.
- Ceramic Industrial Coatings
- Hempel A/S
- Jotun
- Kansai Nerolac Paints Limited
- KAPCI Coating
- MAS Paints
- National Paints Factories Co. Ltd.
- Nippon Paint Holdings Co., Ltd.
- PPG Industries Inc.
- Ritver
- RPM International Inc.
- Teknos Group
- The Sherwin-Williams Company
Market Opportunities and Future Outlook
White-space is emerging for low-VOC and low-emission wood coating systems that can maintain throughput for furniture exporters while meeting tighter environmental and health requirements in key import markets. The 6 August 2026 effective date tied to the EU formaldehyde emission limit for wood-based products (0.062 mg/m3) raises the bar for compliant interior specifications and pushes coating suppliers to offer complete finishing stacks (sealers, topcoats, and compatible primers) that support low-emission claims and documentation. At the same time, the European Commission updated EU Ecolabel criteria for Paints and Varnishes effective February 2026, tightening VOC/SVOC limits and durability thresholds through 31 December 2032. This shift creates room for waterborne polyurethane and UV-curable offerings that are positioned around verified performance rather than legacy solvent-borne chemistries.
Technology-led opportunity is also building around fast-cure UV and advanced waterborne formulations that lower energy use and rework, particularly for Asia-Pacific RTA furniture lines operating under tight packing and shipping windows. AkzoNobel introduced a waterborne wood coating with bio-based content (RUBBOL WF 3350, produced in Malmo, Sweden), and new India-based manufacturing and R&D investments have been announced to localize wood coatings supply. As wood processors add more automation and inline quality control, suppliers that can combine coatings with application support and data-enabled color and process control have a clearer path to displacing incumbent solvent-borne finishes in OEM lines without trading off hardness, clarity, and chemical resistance.
Recent Industry Developments in Wood Coatings Market
- June 2026: Kamdhenu Paints commenced indigenous manufacturing of Kamolac wood coatings by starting a new production line at RIICO Industrial Area, Bhiwadi, Rajasthan, following a reported INR 20 crore investment. The added local capacity targets faster supply and customization for wood finish demand in India, where OEM and contractor channels increasingly ask for modern waterborne and compliant systems.
- December 2025: PPG achieved REDCert2 certification at its architectural coatings sites in Amsterdam, the Netherlands, and Soborg, Denmark, covering sustainable raw material sourcing using a mass balance methodology. The certification supports traceable, lower-footprint inputs for coatings portfolios and aligns with buyer and specifier requirements that are increasingly applied to wood finish programs used in interior environments.
- March 2024: PPG inaugurated a 25,000 t/y waterborne coatings plant in Rayong, Thailand, aimed at serving Southeast Asian furniture exporters. The commissioning strengthens regional supply for waterborne wood finishing systems and helps export-oriented manufacturers align with tighter VOC expectations in destination markets.
Wood Coatings Market Report Scope and Research Methodology
Market Definition and Coverage
This market covers coatings used to protect or decorate wood surfaces, measured at the point of consumption across industrial and professional applications where wood is coated and finished.
Scope exclusions: Excludes finishes meant only for wood-plastic composites and paper overlay surfaces on engineered boards.
Segments Covered in This Report
- By Resin Type
- Polyurethane
- Acrylic
- Nitrocellulose
- Polyester
- Others
- By Technology
- Water-borne
- Solvent-borne
- UV-Cured
- Powder Coatings
- By Application
- Furniture and Fixtures
- Doors and Windows
- Cabinets
- Other Applications (including Floors, Decks, and Molding Products)
- By Geography
- Asia-Pacific
- China
- India
- Japan
- South Korea
- Malaysia
- Thailand
- Indonesia
- Vietnam
- Rest of Asia-Pacific
- North America
- United States
- Canada
- Mexico
- Europe
- Germany
- United Kingdom
- France
- Italy
- Spain
- Nordics
- Russia
- Rest of Europe
- South America
- Brazil
- Argentina
- Colombia
- Rest of South America
- Middle East and Africa
- Saudi Arabia
- United Arab Emirates
- Qatar
- South Africa
- Nigeria
- Egypt
- Rest of Middle East and Africa
- Asia-Pacific
Data Sources, Market Sizing, and Validation
Desk Research
Desk research was used to build the base structure of the market and to anchor the model to real world signals before assumptions were finalized. We relied on public and official sources such as customs and trade statistics, national statistical offices, environmental and chemical regulators, and trade bodies connected to coatings and wood products, which helped us map demand drivers by region.
On top of that, we reviewed company annual reports and investor presentations, technical papers from peer reviewed journals, and credible press to understand shifts in coating technologies and end use activity. A paid company financials and intelligence subscription was used selectively to standardize revenue splits and to sanity check reported exposure to wood coatings related lines. The desk sources listed here are illustrative, and many other public sources were also consulted for data collection, validation, and clarification.
Primary Interviews and Surveys
Primary work was used to test the desk assumptions and to close practical gaps around consumption splits, pricing direction, and the technology mix by end use. We spoke with participants across the value chain, including coating formulators, distributors, and industrial wood coaters, and then compared the responses across APAC, EMEA, and the Americas so the model did not lean on one region or one buyer type too heavily.
Distribution of primary research fieldwork respondents
| Company type | Respondent position | Region |
|---|---|---|
| Top tier: 25% | CXOs: 13% | APAC: 45% |
| Mid tier: 60% | Functional/Unit leaders: 41% | EMEA: 32% |
| Smaller Players: 15% | Managers: 46% | Americas: 23% |
Market-Sizing & Forecasting
Sizing starts with a top-down reconstruction of the coated-wood demand pool, where wood coatings consumption is tied to end markets such as furniture and flooring production, renovation activity, and trade flows for finished wood products, and then converted into coating demand through typical coating usage intensity. After that, results are checked with selective bottom-up approximations, such as sampled supplier revenue splits, channel checks with distributors, and simple volume times average selling price builds for common coating systems, which helps adjust totals when a region looks off.
Key inputs used in the model include wood products output trends, housing and remodeling momentum, shifts between solvent-borne and water-borne systems due to regulation, uptake of UV-cured lines in higher throughput plants, and average pricing movement by technology. When some inputs were not available at the same frequency, gaps were handled with proxy indicators, for example using furniture export trends as a short term signal for coating demand. Forecasts were built using scenario analysis supported by expert views on wood product cycles and technology adoption, and then the year-to-year pattern was reviewed to make sure it matches capacity and trade realities.
Data Validation & Update Cycle
Outputs are validated through triangulation across independent signals, where modeled totals are compared against shipment patterns, end market production direction, and interview feedback before final sign-off. If the model shows a sharp jump, the drivers are rechecked, the underlying conversion factors are revisited, and follow-up calls are triggered to confirm whether it reflects a real shift or a data artifact.
A multi-step analyst review is followed so calculations, units, and currency handling stay consistent across regions and years. The report is refreshed annually, and interim updates are made when material events occur, such as major regulation changes or abrupt demand slowdowns. Before delivery, a final pass is completed so clients receive the most current view available at that time.
Mordor Intelligence's Wood Coatings Market Size Versus Other Published Estimates
Published market sizes for wood coatings can look far apart because each study draws the line around products and end uses slightly differently, then applies its own pricing and conversion assumptions. Differences also come from how volume is converted to value, how fast the technology mix is assumed to change, and whether the base year is updated after fresh demand signals arrive.
Paper overlay finishes on engineered boards sit outside Mordor Intelligence's scope, and that exclusion alone can move totals when other estimates blend overlay finishing demand into general wood coatings. Beyond scope, some publications rely more on a single revenue view with limited checks on coating usage intensity, while others apply broad price growth without testing it against technology mix shifts, which can lift or compress the current-year value.
Benchmark comparison
| Source | Market Size | Gaps in Research Methodology |
|---|---|---|
| Mordor Intelligence | USD 12.35 B (2025) | |
| Industry Journal A | USD 11.80 B (2024) | Uses a prior-year base and does not clearly separate industrial wood finishing from adjacent surface coatings, which can understate when newer plant demand and technology upgrades are not captured in the update cycle. |
| Global Consultancy B | USD 13.21 B (2025) | Appears to apply a broader inclusion set and a more aggregated pricing build, where adjacent wood-surface finishing items may be blended and average prices can drift upward without being tied back to technology mix and usage intensity. |
The comparison shows that most of the spread is explained by what gets counted as wood coatings, which year is used as the anchor, and how price progression is applied. By keeping the scope anchored to wood coating consumption signals and then cross-checking with practical conversion factors and interviews, the final number stays traceable to clear inputs and repeatable steps.
Key Questions Answered in the Report
How large is the Wood Coatings market in volume terms?
The Wood Coatings market size is estimated at 3.54 million tons in 2026 and is projected to reach 4.23 million tons by 2031.
Which resin type leads volumes?
Polyurethane holds the top spot with 60.14% share in 2025, driven by abrasion resistance and clarity.
Which technology is growing fastest?
Waterborne systems are the swiftest, slated for a 4.35% CAGR through 2031 as regulators tighten VOC limits.
Why is Asia-Pacific dominant?
Asia-Pacific houses the bulk of global furniture manufacturing, giving it 56.68% of volumes in 2025 and the fastest regional growth.
What is the main regulatory headwind?
Stricter caps on formaldehyde, VOC, and pending PFAS restrictions raise compliance costs and slow product rollouts.