
Wired Interface Market Size and Share
Market Overview
| Study Period | 2020 - 2031 |
|---|---|
| Market Size (2026) | USD 29.69 Billion |
| Market Size (2031) | USD 39.41 Billion |
| Growth Rate (2026 - 2031) | 5.88 % |
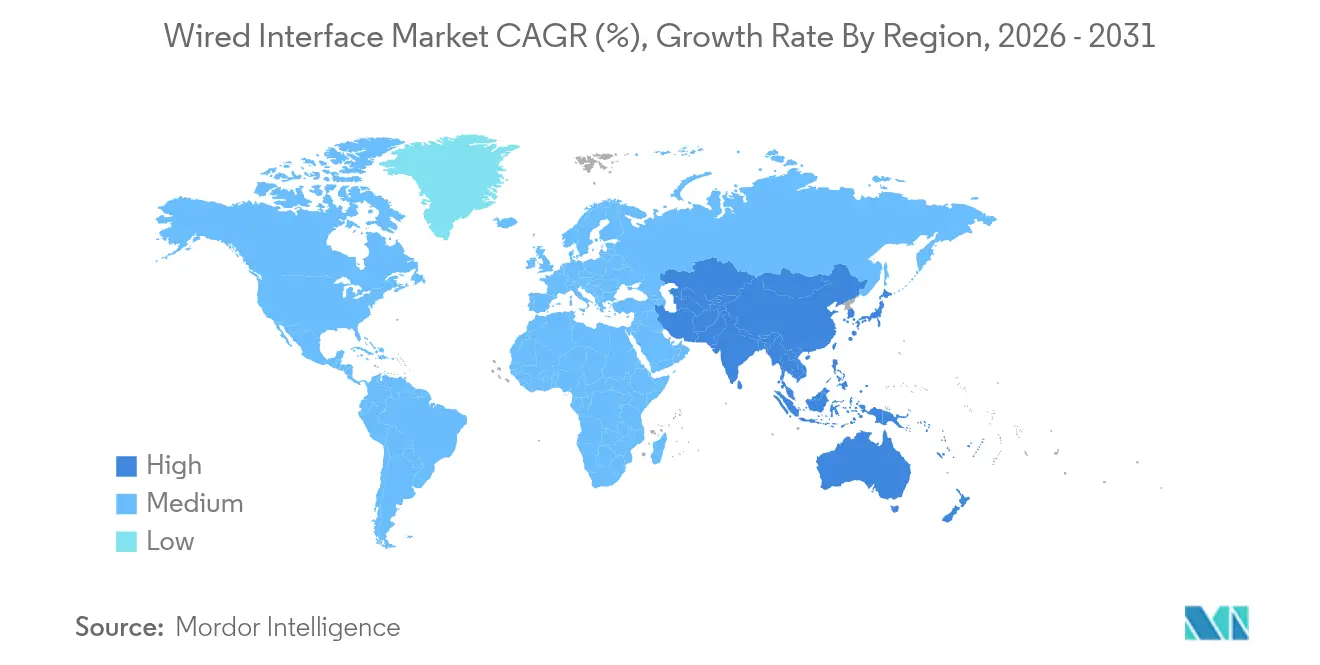
| Fastest Growing Market | Asia Pacific |
| Largest Market | North America |
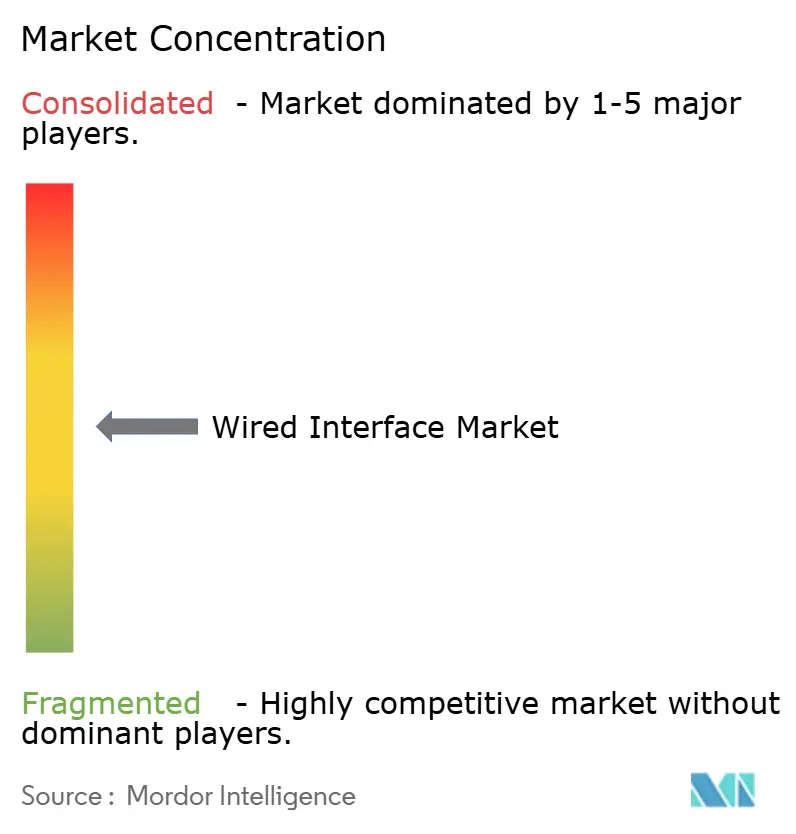
| Market Concentration | Medium |
Major Players *Disclaimer: Major Players sorted in no particular order Image © Mordor Intelligence. Reuse requires attribution under CC BY 4.0. | |
Wired Interface Market Analysis by Mordor Intelligence
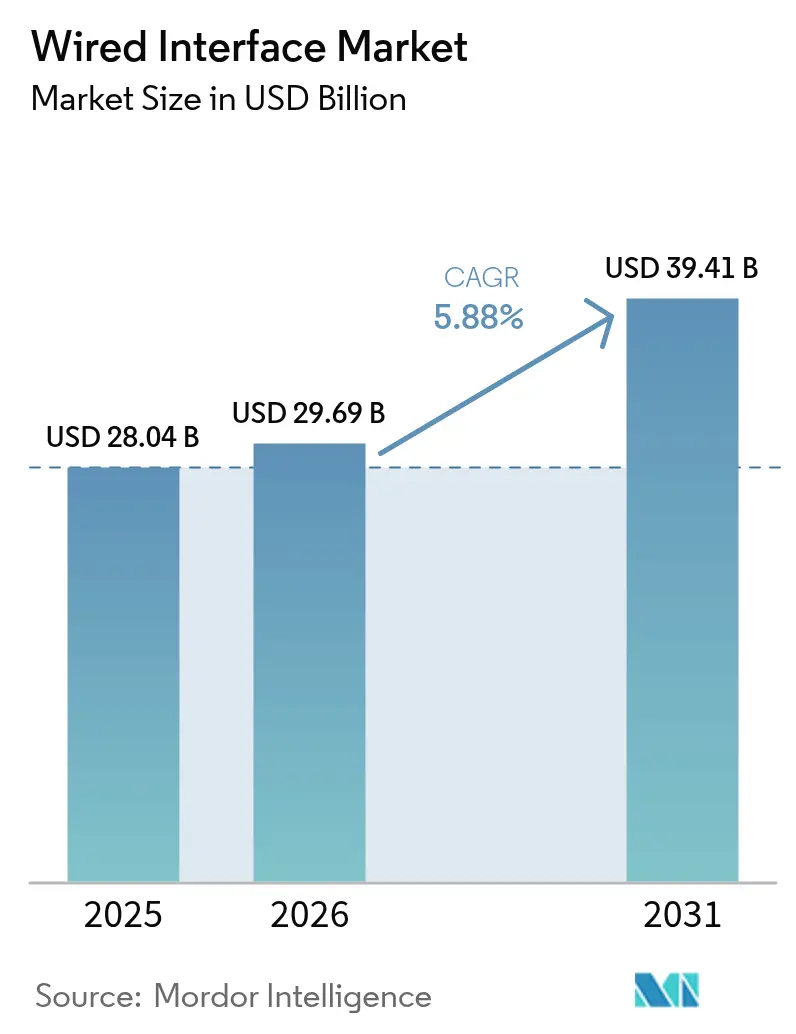
The wired interface market size was valued at USD 28.04 billion in 2025 and estimated to grow from USD 29.69 billion in 2026 to reach USD 39.41 billion by 2031, at a CAGR of 5.88% during the forecast period (2026-2031). Demand resilience stems from bandwidth-intensive workloads, tighter regulatory harmonization, and incremental innovation in power-delivery profiles. AI-enabled computing, 8K/16K gaming graphics, and centralized automotive electronics continue to shift purchase criteria from connector count to aggregate throughput and thermal efficiency. Component vendors are responding with longer-reach active-cable designs, higher copper-alloy conductivity, and rapid migration to USB-C for mainstream devices. Acquisition-led consolidation among tier-one connector suppliers is unlocking scale economies, while fabless controller specialists leverage USB4 and DisplayPort 2.x transitions to win sockets in premium PCs and next-generation gaming consoles.
Key Report Takeaways
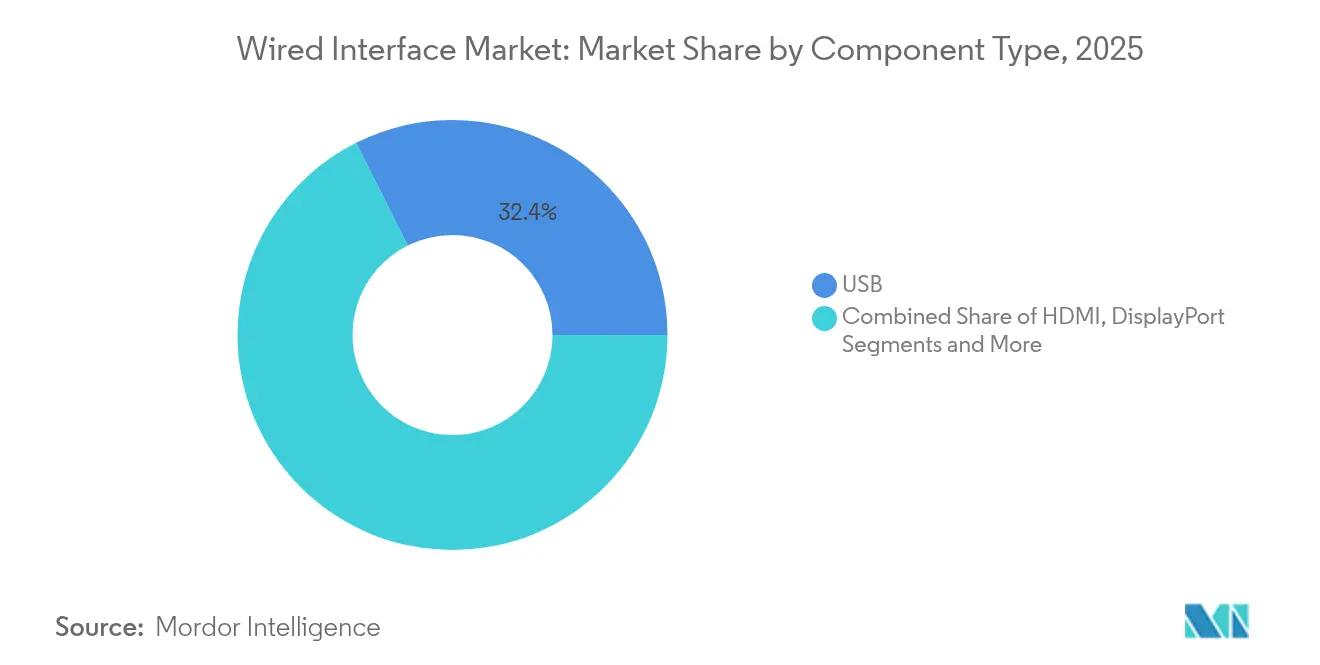
- By component type, USB led with 32.40% of the wired interface market share in 2025, whereas Thunderbolt is projected to expand at a 7.05% CAGR through 2031.
- By data-rate class, the 5-20 Gbps tier captured 39.05% share of the wired interface market size in 2025, while interfaces above 40 Gbps are advancing at an 7.62% CAGR through 2031.
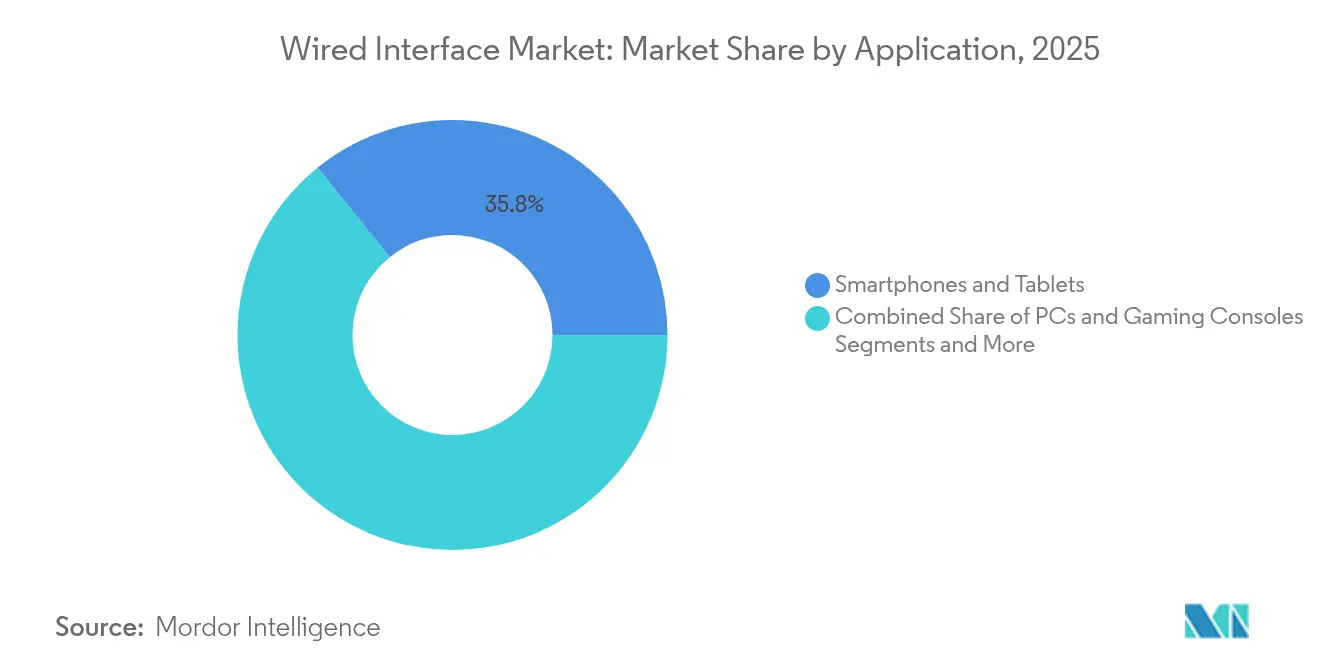
- By application, smartphones and tablets commanded 35.80% of 2025 revenue; PCs and gaming consoles hold the fastest trajectory at a 7.08% CAGR to 2031.
- By end-user industry, consumer electronics accounted for 29.30% share of the wired interface market size in 2025, while IT and telecom is forecast to climb at a 6.55% CAGR to 2031.
- By geography, North America remained dominant with 35.15% 2025 revenue; Asia-Pacific is the quickest-growing region at a 6.78% CAGR during 2026-2031.
Note: Market size and forecast figures in this report are generated using Mordor Intelligence’s proprietary estimation framework, updated with the latest available data and insights as of 2026.
Global Wired Interface Market Trends and Insights
Drivers Impact Analysis*
| Driver | (~) % Impact on CAGR Forecast | Geographic Relevance | Impact Timeline |
|---|---|---|---|
| Growing adoption of USB-C / USB4 across devices | +1.2% | Global, with EU leading regulatory push | Short term (≤ 2 years) |
| Surge in 8K/16K gaming and video bandwidth needs | +0.9% | North America and APAC core markets | Medium term (2-4 years) |
| Automotive centralized infotainment and ADAS data links | +0.8% | Global, with early adoption in EU and North America | Medium term (2-4 years) |
| EU charger mandate accelerates USB-C deployments | +0.7% | EU primary, spillover to global markets | Short term (≤ 2 years) |
| China's GPMI standard drives regional refresh | +0.5% | China domestic, limited global impact | Long term (≥ 4 years) |
| Active long-reach cable tech opens medical and industrial use | +0.4% | Global, concentrated in developed markets | Long term (≥ 4 years) |
| Source: Mordor Intelligence | |||
Growing adoption of USB-C / USB4 across devices
USB-C’s evolution from premium connector to default port is compressing bill-of-materials costs and streamlining inventory for OEMs. The European Union’s common-charger directive, effective December 2024, forces handset, laptop, and even battery-charger redesigns, catalyzing a global compliance ripple as manufacturers avoid regional SKU complexity[1]. Mandatory logo labeling further promotes consumer confidence, accelerating attach rates for USB-C hubs and power-delivery cables. Controller suppliers already note order upticks; ASMedia highlighted a USB 4.0 revenue surge linked to AMD desktop platforms. With India and California drafting aligned regulations, the regulatory domino effect supports USB-C ubiquity across consumer and industrial endpoints.
Surge in 8K / 16K gaming and video bandwidth needs
High-refresh 8K gaming demands aggregate throughputs far exceeding HDMI 2.1’s 48 Gbps ceiling, pushing display makers toward emergent >80 Gbps physical layers. DisplayPort 2.x, standardized by VESA, responds with adaptive-sync enhancements for VR headsets and content-creation monitors. The gaming sector’s aggressive AI-based supersampling multiplies data bursts between GPUs and panels, validating premium cable assemblies that guarantee signal integrity above 40 Gbps. China’s locally backed GPMI specification introduces 192 Gbps capability, illustrating how regional sovereignty agendas can spawn parallel interface ecosystems.
Automotive centralized infotainment and ADAS data links
Vehicle E/E architectures migrate to domain-centralized topologies, collapsing multiple legacy buses into a handful of high-bandwidth links. The MIPI A-PHY 16 Gbps standard targets camera, radar, and LiDAR modules with near-zero packet errors in noisy environments, while Analog Devices’ A2B audio bus slashes harness weight—critical for range-sensitive EVs. Semiconductor vendors are bolstering portfolios; Microchip’s 2025 acquisition of VSI expands into ADAS connectivity modules. More than 145 automakers and suppliers have joined the Automotive SerDes Alliance, signalling an industry-wide pivot from proprietary links to harmonized PHY options.
EU charger mandate accelerates USB-C deployments
Beyond enforcing port commonality, the EU framework introduces energy-efficiency thresholds that push silicon providers toward standby-power optimization. OEMs now have commercial incentive to implement programmable USB-C power-delivery controllers for dynamic voltage scaling. The directive also bans bundled chargers, spawning a stand-alone accessory market where premium certification and higher power ratings can command price premiums. Early adopter regions, including Canada and select US states, indicate accelerating convergence of global charger policies.
Restraints Impact Analysis*
| Restraint | (~) % Impact on CAGR Forecast | Geographic Relevance | Impact Timeline |
|---|---|---|---|
| Shrinking PC and tablet shipments cut legacy-port volumes | -0.8% | Global, particularly APAC markets | Short term (≤ 2 years) |
| Preference for wireless display / charging | -0.6% | Global, with stronger impact in consumer segments | Medium term (2-4 years) |
| Slow ecosystem readiness for DP 2.1 and HDMI 2.2 | -0.4% | Global, concentrated in premium display markets | Medium term (2-4 years) |
| Interoperability risks from proliferating specs | -0.3% | Global, with higher impact in fragmented markets | Long term (≥ 4 years) |
| Source: Mordor Intelligence | |||
Shrinking PC and tablet shipments cut legacy-port volumes
Mainstream PC volume softness, especially in cost-sensitive Asia-Pacific channels, is eroding demand for VGA and USB 2.0 connectors. IDC recorded a 1.3% unit rebound in 2024, but the mix now tilts to AI-centric laptops with fewer physical ports per chassis. Enterprises engage in selective refresh cycles aligned with Windows 11 migration and AI inference workloads, prolonging legacy port relevance only for specific use cases.
Preference for wireless display / charging
Qi-certified pads already exceed 200 million annual shipments, and patent activity since 2018 signals accelerating R&D investment in resonant coils and magnetic alignment algorithms. However, heat dissipation limits and latency constraints restrict wireless options in high-power or low-latency environments such as gaming monitors or surgical imaging. Consequently, a natural segmentation emerges where wired solutions retain performance-critical niches even as wireless proliferates in convenience-driven consumer accessories.
*Our forecasts treat driver/restraint impacts as directional, not additive. The impact forecasts reflect baseline growth, mix effects, and variable interactions.
Segment Analysis
By Component Type: USB Dominance Faces Thunderbolt Challenge
USB maintained 32.40% of 2025 revenue, underlining its role as the de facto general-purpose link across consumer and enterprise gear. The wired interface market size for USB connectors and controllers is slated to rise alongside USB4 V2 rollouts in flagship laptops. Thunderbolt, though representing a smaller base, is forecast at a 7.05% CAGR through 2031 as content creators and workstation gamers adopt its 80 Gbps throughput and daisy-chain flexibility. HDMI’s strong installed base in television panels preserves mid-single-digit growth, yet high-bandwidth enthusiasts may pivot to DisplayPort 2.x for adaptive-sync performance.
Convergence trends are evident. Intel’s Maple Ridge re-timers integrate both USB4 and Thunderbolt tunnelling, while Apple’s latest MacBook Pro combines USB4 with “Thunderbolt 4” branding, blurring category boundaries. In parallel, niche standards such as MIPI A-PHY address automotive safety requirements that mainstream PC interfaces cannot meet. For suppliers, portfolio breadth across copper, optical, and active-cable products becomes crucial as customers demand a single source for multi-protocol connectivity.

By Data-Rate Class: Premium Bandwidth Commands Growth
Mainstream notebooks, docks, and embedded motherboards continue to favour 5–20 Gbps lanes, explaining the 39.05% share held by this class in 2025. Nevertheless, AI servers, edge accelerators, and 8K broadcast cameras are migrating above 40 Gbps, the fastest-growing slice at an 7.62% CAGR. Rising adoption of PCIe Gen5 switches and Ethernet 800G pluggables amplifies demand for low-loss cable assemblies rated beyond 42 GHz.
Materials science innovations drive the shift. Coreless organic interposers demonstrated by TOPPAN minimize stubs and via parasitics, enabling shorter trace lengths and cleaner signals for SerDes at 112 Gbps PAM4. Optical-electrical co-packaged modules from Ayar Labs showcase 16 Tbps bidirectional bandwidth, foreshadowing a future class that could eclipse today’s copper ceilings. Until optical matures, active copper and twin-ax solutions will bridge the gap for hyperscale operators balancing cost and power targets.
By Application: Gaming Consoles Drive PC Segment Growth
Mobile devices still represented 35.80% of 2025 shipments, but smartphones now enter slower upgrade cycles, shifting revenue emphasis toward performance-focused segments. The wired interface market size linked to PCs and gaming consoles is lifting at 7.08% CAGR, sustained by AI-accelerated graphics pipelines and e-sports influence on monitor refresh rates. Sony and Microsoft refresh schedules lock in USB-C ports for controllers and headset peripherals, broadening accessory ecosystems.
Conversely, TVs and digital signage embrace incremental panel upgrades yet rely on existing HDMI feature sets. VR/AR headsets and wearables require slim reversible connectors with sub-5W thermal budgets, incentivizing alternate pin assignments and flex-cable terminations. In industrial automation and medical imaging, deterministic latency trumps convenience, securing continuous use of robust latching connectors and medical-grade power-delivery interfaces.
By End-User Industry: IT and Telecom Acceleration
Consumer electronics retained 29.30% revenue share in 2025 owing to unit volume, yet datacenter operators and telecom carriers are the momentum catalysts. Interface-rich AI servers proliferate across North American and Chinese cloud regions, underpinned by PCIe Gen5 NVMe fabrics and SmartNIC deployments. The segment’s 6.55% CAGR underscores expansion in high-density connector cages, twin-ax jumpers, and high-current power-delivery terminals.
Automotive infotainment harnesses, constrained by weight and climate resilience, adopt MIPI and SerDes links over shielded twisted pairs. Healthcare facilities replace VGA-based imaging carts with fiber-optic DisplayPort extenders, seeking isolation and cleanliness compliance. Industrial OEMs prioritize connector families offering 15+-year supply longevity, enabling predictive-maintenance programs in discrete-manufacturing lines.
Geography Analysis
North America held a 35.15% slice of 2025 revenue, buoyed by hyperscale datacenter refreshes and record GPU attach rates in consumer desktops. United States enterprises accelerated Windows 11 migrations ahead of potential tariff shifts, pushing Q1 2025 PC volumes to 16 million units. Semiconductor vendors mirrored demand; Texas Instruments posted USD 4.07 billion Q1 2025 revenue with analog interface ICs up 13%. Canada’s fiber-to-the-premise rollouts and Mexico’s OEM assembly clusters stabilize regional connector demand. Gaming peripheral brands headquartered in California, Washington, and Texas champion premium USB-C‐to-DisplayPort cables suited for 8K and VR usage, reinforcing value per port metrics.
Europe’s wired interface story pivots on policy. The continent’s USB-C mandate energizes a compliance-driven refresh cycle spanning smartphones, laptops, and standalone chargers. Germany continues to anchor ruggedized interface demand for Industrie 4.0 retrofits, while France and the Netherlands invest in EV charging corridors that rely on shielded high-current couplers. The automotive belt’s shift to domain controllers drives adoption of MIPI A-PHY and Ethernet 800Mbps links, creating volume for EMC-optimized connector variants. Sustain¬ability frameworks catalyze interest in circular-economy rated connectors featuring modular shells and recyclable alloys.
Asia-Pacific, projected at a 6.78% CAGR, benefits from the vertical integration of PCB, cable, and chipset production. China’s domestic GPMI initiative, backed by display majors, introduces a 192 Gbps interface that could bifurcate global standards. Simultaneously, Japanese OEMs embrace Chromebook deployment in education and field-service sectors, recording 15.6% shipment growth in Q1 2025. India’s production-linked incentive scheme draws connector stamping and cable assembly lines inland, compressing logistics lead times for global notebook brands. South Korea’s memory fabs and foundries foster home-grown controller designs, intensifying local supply competition, while Australia’s mining automation projects demand harsh-environment copper-fiber hybrids.
Regulatory Landscape
Regulation and standards activity for wired interfaces is increasingly shaped by safety, interoperability, and modernization of legacy wireline rules. In the European Union, Directive (EU) 2022/2380 (common charger) became effective in December 2024, accelerating USB-C adoption across consumer devices and influencing global OEM port standardization strategies. In the United States, the Federal Communications Commission (FCC) advanced wireline modernization in 2026, including FCC 26-19 (adopted March 2026) and an April 2026 direct final rule to delete obsolete and duplicative wireline rules (effective June 15, 2026), reinforcing the shift from legacy networks toward IP-based infrastructure.
On the technical compliance side, international standards bodies continued to update the baseline for wired interoperability and safety. The International Electrotechnical Commission (IEC) published IEC 63316:2026 (Safety for Power Transfer Over Communication Cables) in March 2026 and IEC/IEEE 60802:2026 (Time-Sensitive Networking for Industrial) in June 2026, both relevant to higher-power delivery profiles and deterministic industrial Ethernet deployments. ISO/IEC/IEEE alignment around Ethernet (8802-3) also progressed through final stages in 2026, supporting cross-vendor compatibility for high-speed networking hardware across IT, telecom, and industrial end uses.
Value Chain Analysis
The wired interface value chain runs from raw materials and semiconductor manufacturing through to connector and cable assembly, controller and retimer integration, system OEM qualification, and aftermarket distribution. Upstream inputs include copper alloys and specialty polymers for connectors and overmolds, along with silicon IP and wafer capacity for interface controllers, retimers, PHYs, ESD protection, and power-delivery components. Production is split between semiconductor designers and foundries for high-speed ICs, and a broad ecosystem of connector, cable, and module manufacturers that deliver passive assemblies (connectors and copper or fiber cables) and active solutions (active copper, retimed cables, optical or electrical conversion modules) into consumer electronics, automotive, industrial, and IT and telecom platforms.
Constraints and differentiation increasingly center on high-speed component availability and the qualification cycles for >40 Gbps links and data center interconnects. 2025-2026 supply-chain reporting pointed to extended lead times for high-speed Ethernet PHY and related components used in 400G/800G-class optics, with lead times cited at over 40 weeks under AI data center networking demand, pushing OEMs and operators toward multi-sourcing and just-in-case procurement. Downstream, large OEMs and hyperscalers drive vendor consolidation and bundle purchasing (connectors, retimers, protection, and assemblies under fewer contracts), while industrial and automotive buyers place more weight on long lifecycle support, EMC performance, and standardized deterministic networking, including TSN, to reduce integration risk.
Competitive Landscape
Competition remains moderate as top suppliers pursue portfolio breadth across copper, optical, and active components. TE Connectivity’s USD 2.3 billion Richards Manufacturing buyout enlarges its footprint in aerospace-grade circular connectors and high-current busbars[3]. Shortly thereafter, the firm acquired grounding-specialist Harger to expand energy-grid applications. Molex, a subsidiary of Koch Industries, projects double-digit growth in 224 Gbps PAM4 interconnects, bolstered by investments in thermal-management fins integrated into next-gen cages. Amphenol’s purchase of Carlisle’s CIT division reinforces its presence in defense avionics harnessing, allowing cross-selling of ruggedized Ethernet and USB-C assemblies.
Fabless controller houses exploit architectural transitions. ASMedia underscores rising USB4 order books attributable to AMD desktop chipset share gains. Synaptics expands its DisplayPort retimer line for OLED gaming monitors, while Parade Technologies enters automotive SerDes with 12-Gbps FPD-Link-compatible PHYs. Standards-body participation constitutes strategic positioning: over 145 companies now engage in the Automotive SerDes Alliance to influence future 24 Gbps roadmaps. White-space opportunities surface in co-packaged optics targeting AI cluster switch racks and in galvanically isolated USB-C for medical scanners, inviting specialized entrants that can absorb qualification costs.
OEM buying patterns favor suppliers that bundle connectors, retimers, ESD protection, and cable assemblies under one contract, simplifying qualification cycles. As consolidation advances, price leverage shifts toward tier-one suppliers, yet niche innovation remains viable where electromagnetic interference, extreme temperatures, or miniature footprints drive bespoke designs.
Wired Interface Industry Leaders
-
Molex Incorporated
-
STMicroelectronics N.V.
-
ON Semiconductor Corporation
-
Analog Devices, Inc.
-
Amphenol
- *Disclaimer: Major Players sorted in no particular order
Market Opportunities and Future Outlook
A core opportunity is in interface upgrades that consolidate data, display, and power while meeting higher throughput and tighter thermal limits, as USB-C and USB4 adoption rises under the EU common-charger directive (effective December 2024). This policy-driven port standardization expands the attach market for certified cables, hubs, and programmable power-delivery controllers, and it also supports premium, compliance-oriented accessories as bundled-charger restrictions shift purchases toward standalone chargers and cable upgrades. In parallel, automotive centralized or zonal electronics and higher-bandwidth in-vehicle links create room for ruggedized, high-speed connector systems and cable assemblies aligned with standardized PHY ecosystems such as MIPI A-PHY and broader industry movement toward harmonized SerDes.
In IT and telecom, standards roadmaps are narrowing around next-generation Ethernet signaling, increasing demand for low-loss interconnects, retimers, and higher-density connector cages that can support rapid speed transitions. In 2026, IEEE 802.3 chartered and advanced a 400 Gb/s per lane signaling study group, approving technical objectives in June 2026, while the Optical Internetworking Forum highlighted next-generation electrical interconnection frameworks targeting 448 Gbps per lane. These standards-track activities give suppliers a clearer path to deliver interoperable high-speed copper and optical interface components, alongside diagnostics and link-management capabilities that reduce deployment and maintenance friction in AI-driven data center networking.
Recent Industry Developments
- June 2026: onsemi announced a definitive agreement to acquire Synaptics for approximately USD 7 billion, expanding its portfolio in Edge AI, human-machine interface, and connectivity. The combination strengthens onsemi's ability to offer more integrated silicon platforms that link compute, sensing, and interface functions in connected devices. It also raises competitive pressure on other controller and mixed-signal suppliers targeting premium PC, industrial, and automotive connectivity designs.
- May 2026: STMicroelectronics launched 700V PowerGaN transistors targeting AI servers, robotics, and industrial applications. Higher-efficiency power stages support denser computing and peripheral ecosystems where wired I/O hubs, retimers, and high-speed cages must operate under tighter thermal envelopes. The move underscores how power-delivery and signal integrity requirements are being engineered together in next-generation wired interface platforms.
- April 2025: China unveiled the General Purpose Media Interface (GPMI) standard, backed by more than 50 domestic firms, specifying up to 192 Gbps and integrating video, audio, data, and power. The initiative highlights regional standard-setting momentum that can influence connector and cable ecosystems inside China and complicate cross-border interoperability for OEMs shipping global SKUs. It also intensifies the competitive benchmark for high-bandwidth consumer and display interfaces beyond legacy HDMI ceilings.
Research Methodology Framework and Report Scope
Market Definition and Coverage
This market covers wired interfaces used to transmit data, audio, or video over physical connections in electronic devices and related equipment. The sizing captures revenue generated from wired interface components and solutions across major device and end-use demand.
Scope exclusions: We exclude purely wireless connectivity and stand-alone network services that do not involve a wired physical interface.
Segmentation Overview
- By Component Type
- USB
- HDMI
- DisplayPort
- Thunderbolt
- Others
- By Data-Rate Class
- Below 5 Gbps
- 5-20 Gbps
- 20-40 Gbps
- Above 40 Gbps
- By Application
- Smartphones and Tablets
- PCs and Gaming Consoles
- TVs and Digital Signage
- VR/AR and Wearables
- Other Applications
- By End-User Industry
- Consumer Electronics
- Automotive
- Industrial
- Healthcare
- IT and Telecom
- Other End-User Industries
- By Geography
- North America
- United States
- Canada
- Mexico
- Europe
- Germany
- United Kingdom
- France
- Italy
- Spain
- Rest of Europe
- Asia-Pacific
- China
- Japan
- India
- South Korea
- Australia
- Rest of Asia-Pacific
- South America
- Brazil
- Argentina
- Rest of South America
- Middle East and Africa
- Middle East
- Saudi Arabia
- United Arab Emirates
- Turkey
- Rest of Middle East
- Africa
- South Africa
- Egypt
- Nigeria
- Rest of Africa
- Middle East
- North America
Data Sources, Market Sizing, and Validation
Desk Research
Desk work starts with building a clean view of how wired interface demand is formed across device categories like smartphones, PCs, TVs, and related peripherals, and how that demand shifts by region. We referenced public sources such as U.S. International Trade Commission trade data, U.S. Census Bureau manufacturing statistics, Eurostat production and trade tables, ITU connectivity indicators, and IEEE standards publications to keep definitions consistent across interface types.
After that, we layer in company filings, product literature, investor presentations, and trusted press coverage to understand shipment trends, product transitions, and pricing direction, including higher data-rate adoption and connector content per device. Select paid subscriptions were used only for company financials and news screening, and a patent database was checked to validate the timing of interface upgrades. This desk source list is illustrative, and additional public references were used for data collection, validation, and clarification.
Primary Interviews and Surveys
Primary work was used to confirm what is actually counted as wired interface revenue, and to pressure-test assumptions on pricing, adoption timing, and the mix of interface types across device categories. We spoke with a mix of component suppliers, device OEM-aligned experts, channel participants, and engineering or product leaders across APAC, EMEA, and the Americas, then reconciled feedback back into the model to close gaps from desk sources.
Distribution of primary research fieldwork respondents
| Company type | Respondent position | Region |
|---|---|---|
| Top tier: 33% | CXOs: 13% | APAC: 43% |
| Mid tier: 50% | Functional/Unit leaders: 31% | EMEA: 37% |
| Smaller Players: 17% | Managers: 56% | Americas: 20% |
Market-Sizing & Forecasting
Our sizing starts with a top-down build where device shipments and installed base signals are converted into a wired interface demand pool, then translated into revenue using typical interface attach rates and average selling price ranges. To keep totals realistic, the outputs are checked with selective bottom-up approximations such as sampled supplier revenue splits, channel price checks, and volume by interface type where public data is available.
Key inputs used in the model include the mix of interface types in active devices, the shift toward higher data-rate connections, replacement and upgrade cycles for consumer electronics, regional manufacturing and export intensity, and pricing movement as specifications evolve. Where direct volume proxies were weak for a niche interface, we used conservative penetration bands validated through interviews, and narrowed the gap by cross-checking against adjacent device categories. Forecasts were built using scenario analysis, with the base case shaped by expert views on upgrade timing and by observed continuity in device shipments and interface content per device.
Data Validation & Update Cycle
Results are validated through multiple checks, including reconciling totals against independent demand indicators, testing year over year growth for outliers, and reviewing regional splits for consistency with production and trade direction. When a variance is large, analysts re-check assumptions, trace the driver back to the input series, and re-contact sources if the change looks like a real market shift.
Each report is refreshed annually, and interim updates are made when material events occur, such as major standards transitions or sharp device shipment swings. Before delivery, a final analyst pass is done so the output reflects the most recent public releases and the latest interview signals.
Mordor Intelligence's Wired Interface Market Size Measured Against Other Published Estimates
Published market values for wired interfaces can differ significantly even when the topic name is the same, because scope boundaries and the base year timing are handled differently across publishers. The spread also comes from how each publisher treats device coverage, interface families included, and how quickly pricing is assumed to move as data-rate requirements rise.
By tracking interface type mix by device category and refreshing pricing bands each cycle, Mordor Intelligence keeps the 2026 estimate tied to a defined wired-only revenue pool. Other estimates may expand the scope to broader connectivity stacks or apply aggressive price and adoption steps. Differences also show up when a study relies heavily on long-range CAGR assumptions without cross-checking against trade and production direction, or when currency conversion timing does not match the stated base year.
Benchmark comparison
| Source | Market Size | Gaps in Research Methodology |
|---|---|---|
| Mordor Intelligence | USD 29.69 B (2026) | |
| Global Research Publisher A | USD 32.05 B (2024) | Uses an earlier base year with a broad segmentation label, and the scope can be interpreted to include adjacent connectivity elements beyond wired interface components, which lifts the starting value. |
| Global Consultancy B | USD 19.49 B (2025) | Anchors the market on a narrower device list and a shorter definition of what counts as wired interface revenue, which can compress the total even if interface adoption is rising. |
Taken together, the comparison shows that year selection and what is counted as wired interface revenue drive most of the gap, more than math choices alone. Our approach stays repeatable because the model is built from visible demand signals, clear attach-rate and pricing logic, and validation steps that can be re-run when new shipment or standards data is released.
Key Questions Answered in the Report
What is the current value of the wired interface market?
The wired interface market is valued at USD 29.69 billion in 2026 and is projected to reach USD 39.41 billion by 2031.
Which connector type holds the largest wired interface market share?
USB leads with 32.40% revenue share in 2025.
What segment is growing fastest within the wired interface market?
Interfaces rated above 40 Gbps show the highest growth, advancing at an 7.62% CAGR through 2031.
How will the EU common-charger mandate impact market growth?
The regulation accelerates USB-C deployments, adding an estimated +0.7 percentage points to forecast CAGR in the short term.
Which region is expected to record the highest growth rate?
Asia-Pacific is set to expand at a 6.78% CAGR between 2026 and 2031 due to manufacturing scale and rising domestic demand.
Who are the leading companies in the wired interface industry?
TE Connectivity, Molex, Amphenol, and ASMedia Technology are among the foremost players, with the top five vendors controlling just over half of total market revenue.