
Window Coverings Market Size and Share
Market Overview
| Study Period | 2020 - 2031 |
|---|---|
| Market Size (2026) | USD 30.14 Billion |
| Market Size (2031) | USD 37.85 Billion |
| Growth Rate (2026 - 2031) | 4.66 % |
| Fastest Growing Market | Asia Pacific |
| Largest Market | North America |
| Market Concentration | Medium |
Major Players *Disclaimer: Major Players sorted in no particular order Image © Mordor Intelligence. Reuse requires attribution under CC BY 4.0. | |
Window Coverings Market Analysis by Mordor Intelligence
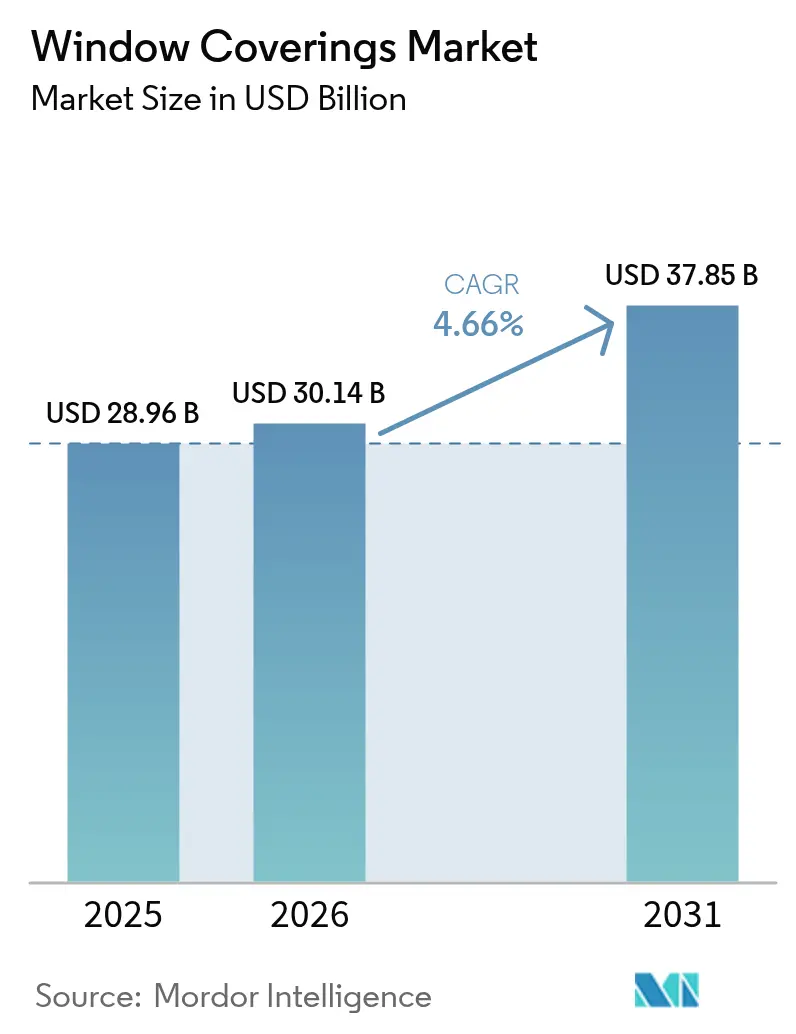
The window coverings market size is expected to grow from USD 28.96 billion in 2025 to USD 30.14 billion in 2026 and is forecast to reach USD 37.85 billion by 2031 at a 4.66% CAGR over 2026-2031. Renovation spending in North America, mandatory solar-shading provisions in European energy codes, and rapid urban household formation across the Asia-Pacific are sustaining mid-single-digit value growth. Corporate real-estate managers now specify daylight-management solutions to raise employee well-being metrics, while several U.S. insurers have begun testing premium rebates for glare and heat-gain control, validating hard-dollar returns on specification. At the same time, motorization migrates from luxury to mainstream as the Matter protocol removes interoperability friction, and composite, PVC-free fabrics gain share because architects must satisfy Cradle to Cradle certification targets. Competitive intensity is rising as traditional blind makers purchase automation specialists to defend against electrochromic smart-glass substitutes, yet high capital costs for smart glass preserve an addressable retrofit moat for automated shades.
Key Report Takeaways
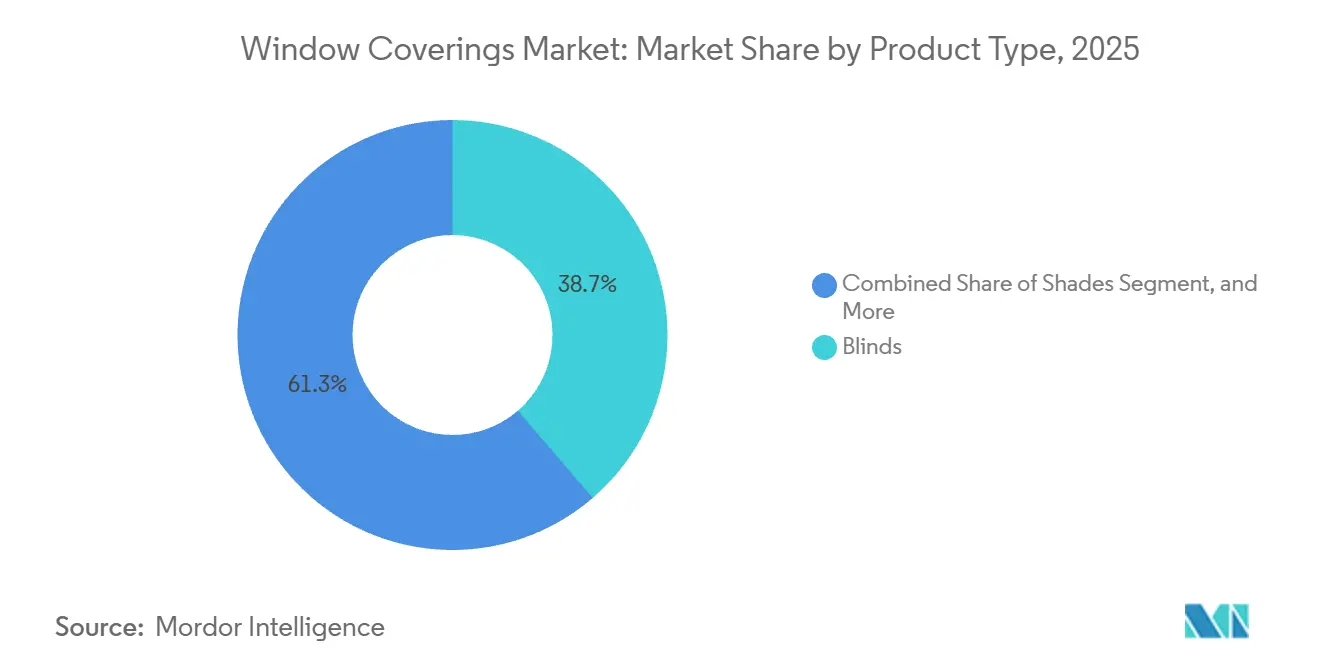
- By product type, blinds led with 38.68% share in 2025, while shades are projected to advance at a 5.12% CAGR through 2031.
- By material, fabric accounted for 39.77% of the window coverings market share in 2025, whereas composite formulations are slated to expand at a 5.68% CAGR to 2031.
- By technology, manual mechanisms held 74.13% of the window coverings market size in 2025, and smart, IoT-enabled systems are forecast to grow at a 5.96% CAGR between 2026-2031.
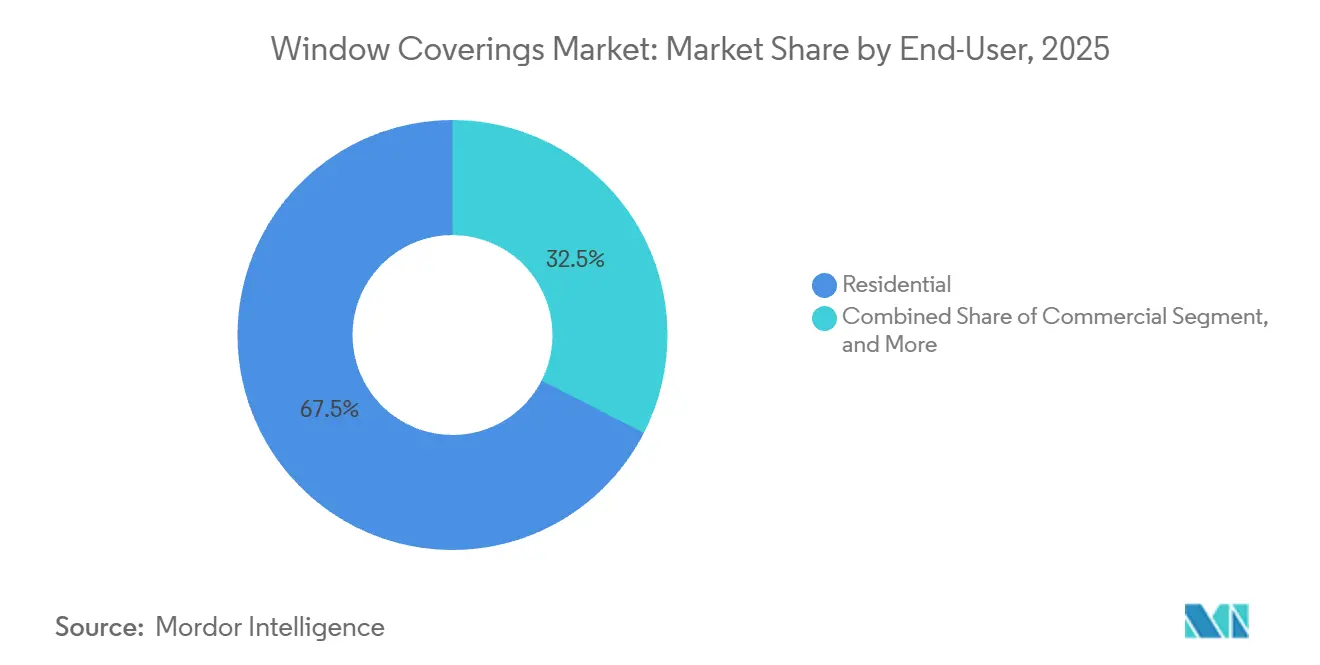
- By end user, residential applications captured a 67.47% share in 2025, while commercial installations are on track for a 6.27% CAGR over the same period.
- By distribution channel, offline retail commanded 72.86% of market share in 2025, while online platforms are positioned for a 5.75% CAGR through 2031.
- By geography, North America dominated with 40.34% share in 2025, whereas Asia-Pacific is expected to post the fastest 6.19% CAGR to 2031.
Note: Market size and forecast figures in this report are generated using Mordor Intelligence’s proprietary estimation framework, updated with the latest available data and insights as of 2026.
Global Window Coverings Market Trends and Insights
Drivers Impact Analysis*
| DRIVER | (~) % IMPACT ON CAGR FORECAST | GEOGRAPHIC RELEVANCE | IMPACT TIMELINE |
|---|---|---|---|
| Surging Residential Renovation Expenditure | +1.2% | North America and Europe core, spillover to urban Asia-Pacific | Medium term (2-4 years) |
| Rapid Adoption of Motorized, Smart Shades | +1.0% | Global, early gains in North America, Western Europe, urban China | Medium term (2-4 years) |
| Energy-Efficiency Mandates and Green-Building Codes | +0.9% | Europe and North America, expanding to Asia-Pacific | Long term (≥4 years) |
| Commercial Daylight-Management for Employee Well-Being | +0.7% | Global, concentrated in North America and Europe commercial real estate | Medium term (2-4 years) |
| Insurance Rebates for Glare and Heat-Gain Control | +0.4% | North America, selective adoption in Europe and Australia | Short term (≤2 years) |
| Growth of Antimicrobial Fabrics in Healthcare Blinds | +0.3% | Global, priority in North America and Europe healthcare systems | Medium term (2-4 years) |
| Source: Mordor Intelligence | |||
Surging Residential Renovation Expenditure
Homeowner spending on envelope upgrades has created a predictable replacement cycle that lifts attachment rates for interior shades above new-construction baselines. In the United States, residential improvement outlays climbed from USD 472 billion in Q3 2024 to a projected USD 477 billion in Q3 2025, with windows and doors generating USD 22.1 billion in 2023. Contractors increasingly bundle glazing replacements with automated shade packages, allowing customers to consolidate permits and compress disruption. Low-emissivity glass amplifies solar-control needs, making motorized roller shades a logical upsell that safeguards thermal comfort without forfeiting views. Custom fabricators, which shipped 36%-49% of total units between 2015-2025, ride this trend by offering project-specific dimensions and premium fabrics that command higher margins. Renovation momentum therefore sustains a top-tier price band even as baseline housing starts flatten.
Rapid Adoption of Motorized, Smart Shades
Automation is transforming coverings from passive décor into active building-system elements. Custom-electronics integrators reported that projects using automated shades doubled within one year, with a median 10 units per residence and average spend of USD 25,000.[1]CE Pro Editorial Team, “2024 State of the Industry Motorized Shading Deep Dive,” cepro.com Retrofit viability improved as the share of dealers skipping motorized shades in remodels fell from 15% to 2%. Matter 1.2 now certifies 20 window-covering devices, ensuring native compatibility across Apple, Google, and Amazon ecosystems.[2]Connectivity Standards Alliance, “Matter 1.2 Window Covering Cluster,” csa-iot.org Designers are responding; 56% specify motorized solutions for luxury homes, up from negligible levels a decade ago. Battery-powered motors bypass the need for electrical rough-in, cutting installation labor and widening the addressable market among existing dwellings.
Energy-Efficiency Mandates and Green-Building Codes
Shading products increasingly fall under envelope-performance compliance rather than discretionary aesthetics. California’s Title 24-2025 denies exceptional-method credits for motorized shades unless paired with dynamic glazing, pushing vendors to integrate daylight sensors and occupancy logic into standard offerings. The European Union’s 2024 Energy Performance of Buildings Directive requires member states to embed solar-shading measures into national codes, turning automated treatments into a regulated baseline. Colorado adopted window-efficiency rules that reward assemblies achieving lower solar-heat-gain coefficients. LEED certification awards daylight credits for automated glare control, compressing payback periods and repositioning motorized solutions as compliance tools, not lifestyle luxuries.
Commercial Daylight-Management for Employee Well-Being
Occupiers now link visual comfort to productivity, driving higher specification rates for automated shading in offices and learning environments. A 2025 Nature Communications study showed that dynamic fenestration such as electrochromic glass delivered 26.72 MJ m² annual HVAC savings while boosting thermal comfort. Roller shades fitted with solar-reflective fabrics replicate a portion of those gains at lower capital cost. Smart-building surveys found 90% of respondents had deployed connected controls in 2024, up from 74% a year earlier. WELL Building certification now rewards daylight autonomy metrics that automated shades help achieve. Evidence that dynamic daylighting can reduce hospital infections and shorten length of stay further elevates healthcare demand.
Restraints Impact Analysis*
| Restraint | (~) % Impact on CAGR Forecast | Geographic Relevance | Impact Timeline |
|---|---|---|---|
| Volatility of Raw-Material Prices (PVC, Aluminum) | -0.6% | Global, acute in Asia-Pacific manufacturing hubs | Short term (≤2 years) |
| Environmental Pushback on Single-Use Plastics and Corded Blinds | -0.5% | Europe and North America, expanding to Asia-Pacific | Long term (≥4 years) |
| Rising Competition from Electrochromic Smart-Glass | -0.3% | North America and Europe commercial construction | Medium term (2-4 years) |
| IoT-Related Cybersecurity and Privacy Concerns | -0.2% | Global, concentrated in high-net-worth residential segments | Medium term (2-4 years) |
| Source: Mordor Intelligence | |||
Volatility of Raw-Material Prices (PVC, Aluminum)
Prices for PVC resin and aluminum extrusions swung sharply through 2024-2025, complicating production planning. PVC in India fell to USD 600 per ton in December 2025, down from peaks above USD 1,200. U.S. aluminum spot rates hit USD 1.37 per pound after new import tariffs, lifting costs for headrails and bottom rails.[3]United States Geological Survey, “Mineral Commodity Summaries Aluminum 2024,” usgs.gov Integrated players with hedged contracts protected margins, but smaller fabricators reliant on spot markets struggled to honor fixed bids. Composite blends that reduce virgin PVC offer partial insulation yet require capital outlays for new extrusion dies, delaying rapid migration. Currency swings additionally pressure multinational suppliers that source components in Asia and sell finished goods in Europe or North America.
Environmental Pushback on Single-Use Plastics and Corded Blinds
Safety rules and sustainability mandates accelerate the sunset of corded blinds and vinyl-heavy formulations. Health Canada’s 2025 guidance urges cordless solutions to curb child-strangulation incidents, while the EU’s Regulation 2024/1781 forces digital product passports disclosing recycled content and recyclability. Manufacturers respond with PVC-free blackout fabrics achieving Cradle to Cradle certification, though 10%-15% cost premiums slow mass conversion. The Window Covering Manufacturers Association recorded 29 child-safety innovation submissions in 2024, signaling industry-wide investment in cordless and motorized alternatives.
*Our forecasts treat driver/restraint impacts as directional, not additive. The impact forecasts reflect baseline growth, mix effects, and variable interactions.
Segment Analysis
By Product Type: Shades Gain on Automation Tailwinds
Shades represented a smaller share than blinds in 2025, yet the category is forecast to rise at a 5.12% CAGR, eclipsing the broader window coverings market trajectory. Architects favor roller systems that accept solar-reflective and blackout fabrics in one cassette, allowing integration with building-management systems. Lutron’s USD 599 Triathlon Select lowered the entry barrier for automated roller shades, underscoring how pricing innovation can transfer volume from blinds to shades. Continuing launches of dual-fabric tubes and ultrawide rollers strengthen the proposition for commercial atriums and open-plan offices.
Blinds still own 38.68% of the market share in 2025 and will not vanish, but their growth lags because legacy corded designs face safety headwinds. Shutters, curtains, and niche systems such as panel tracks keep relevance in bespoke décor but contribute limited volume. For the forecast horizon, shades stand out as the prime beneficiary of interoperability protocols, positioning the window coverings market for a technology-driven mix shift.


By Material: Composite Formulations Lead Sustainability Push
Fabric kept a 39.77% of the market share in 2025, anchored by polyester and fiberglass weaves that deliver flame resistance and antimicrobial performance in one layer. Yet composite materials, blending recycled polymers with natural fibers, are set to log the quickest 5.68% CAGR, propelled by EU ecodesign rules requiring lifecycle disclosure. Architects in Germany and France already request digital passports at the bid stage, a hurdle that fabrics can clear faster than PVC slats.
Metal blinds remain cost-effective for entry multifamily projects but struggle to house wireless radios or sensors because headrail geometry limits PCB space. Wood and faux-wood solutions fill aesthetic niches but warp in humid climates, raising warranty accruals. PVC slats persist in price-sensitive geographies; however, phthalate bans are nudging suppliers toward bio-based plasticizers. Composites thus emerge as an elegant compromise between regulation and durability, keeping the window coverings market momentum intact without inflating embodied-carbon footprints.
By Technology: Smart, IoT-Enabled Systems Capture Premium Tier
Manual lifts commanded 74.13% of the market share in 2025, yet smart systems built on Thread or Zigbee radios are projected to grow at a 5.96% CAGR, outpacing the overall window coverings market. Matter 1.2 unifies lift and tilt commands, ending the proprietary-hub era that once fractured adoption. Battery durability has doubled thanks to lithium-iron-phosphate packs, reducing maintenance in tall towers.
Power-over-Ethernet motors deliver both 50 V DC and data over a single cable, simplifying retrofits in drop-ceiling offices. Motorized but non-connected products hold an intermediate niche, especially in hospitality, where managers prefer scheduled blackout without cloud exposure. Yet as firmware-update tools become standard, even budget buyers gravitate toward fully networked shades, ensuring the keyword window coverings market increasingly aligns with smart-home discourse.
By End-User: Commercial Segment Accelerates on Well-Being Mandates
Residential installations accounted for 67.47% in 2025, but commercial buyers are projected to expand by 6.27%, well ahead of household demand. WELL and LEED frameworks elevate tenant well-being and daylight autonomy, prompting landlords to specify automated shading. Hospitals now demand antimicrobial, wipeable fabrics after studies showed smart windows cut infection rates by 11%-13%.
Homeowners remain active renovators, especially in mature U.S. suburbs where tax incentives offset motorization premiums. Yet commercial lessors can amortize capex over triple-net leases and recover costs via higher occupancy or lower HVAC spend, giving them a structural adoption edge. As IoT-ready coverage migrates into schools, airports, and mixed-use developments, the window coverings market gains volume diversity that cushions it from single-family housing cycles.
By Distribution Channel: Online Gains on Cordless Stock Availability
Offline retail retained 72.86% share in 2025, yet online is rising at a 5.75% CAGR thanks to near-universal cordless assortments that satisfy child-safety rules. Augmented-reality fabric previews now reduce the tactile gap that once slowed click-through conversion. Specialty installers use configurator APIs to auto-price custom sizes online and schedule on-site measurement within 48 hours, closing the loop between virtual selection and physical fitting.
Stores stay relevant for high-touch drapery consultations and warranty fulfillment, but as hub-agnostic motors arrive pre-commissioned, more buyers accept parcel delivery followed by DIY setup. Consequently, the phrase window coverings market increasingly pertains to browser-based carousels as well as showroom vignettes, diversifying channel risk.
Geography Analysis
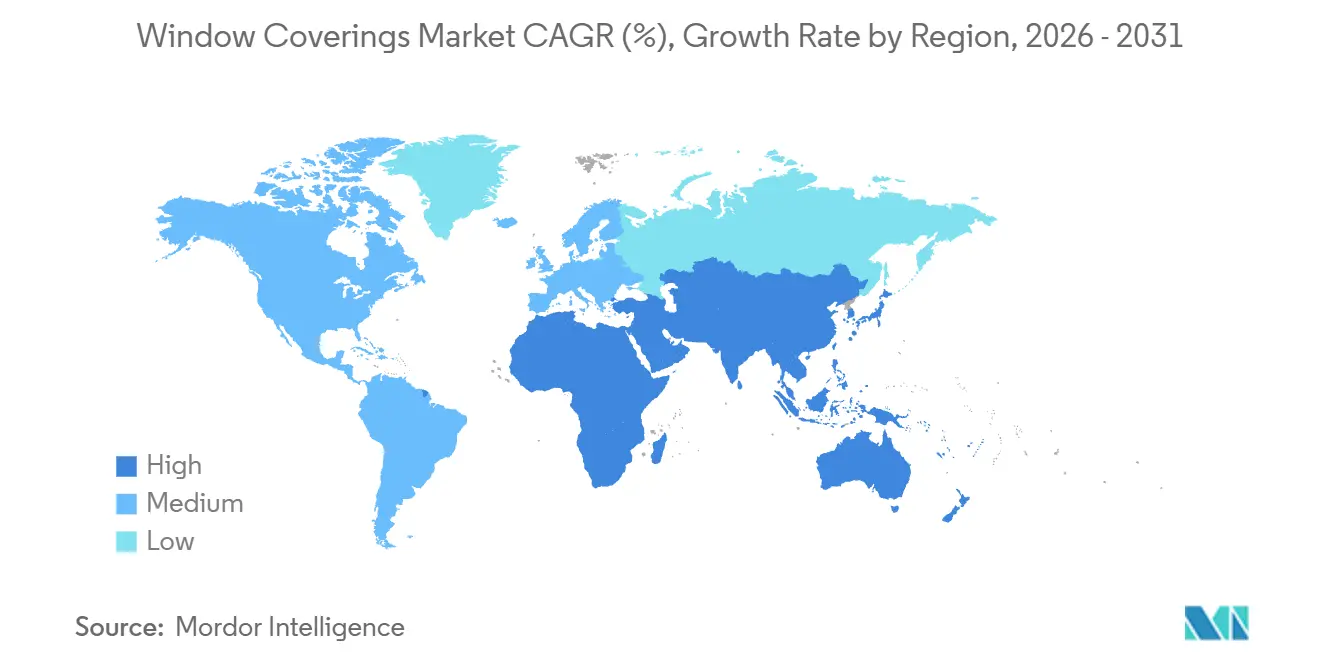
North America held 40.34% share in 2025, anchored by U.S. renovation outlays and California’s Title 24-2025 protocols that elevate automation complexity. Cordless mandates in Canada further skew volume toward tension-device or motorized designs. The window coverings market size for the region thus remains resilient even as single-family starts flatten because code triggers and insurance pilots sustain retrofit demand.
Europe benefits from the 2024 Energy Performance of Buildings Directive, which embeds solar-shading clauses into national regulations. Germany, France, and the United Kingdom lead uptake, bolstered by retrofit subsidies tied to 55% greenhouse-gas cuts by 2030. Southern European hospitality resorts also favor blackout tracks to mitigate summer cooling loads, widening demand diversity and cushioning office-construction cycles.
Asia-Pacific is projected for the fastest 6.19% CAGR to 2031, propelled by India’s urban-household growth, Japan’s aging demographics that value motorized lifts, and China’s condominium pipeline. Tier-1 Chinese cities now require green-building features, nudging developers toward IoT-ready shades. Australia and New Zealand add upside via utility rebates that shorten payback on solar-control treatments. Elsewhere, South America and the Middle East and Africa remain smaller but show spot growth in hospitality and healthcare, segments that demand antimicrobial fabrics and ligature-safe hardware.

Regulatory Landscape
Energy and safety codes are tightening the compliance envelope for window coverings, pushing cordless operation and higher-performance solar control into standard specifications. In North America, California’s Title 24-2025 affects how motorized shading can be credited in building performance pathways, and Health Canada issued 2025 guidance encouraging cordless solutions to reduce child-strangulation risk, accelerating the shift away from legacy corded designs.
Sustainability and product-information requirements are also increasing compliance workload across materials and packaging. The EU Packaging and Packaging Waste Regulation (Regulation (EU) 2025/40) becomes applicable from 12 August 2026 and sets harmonized packaging expectations, including recyclability by 2030, along with labeling-related implementing acts, which affects how window coverings are packed and labeled for EU distribution. On the manufacturing side, U.S. EPA air rules such as 40 CFR Part 63 Subpart KK for rotogravure and wide-web flexographic printing remain relevant for suppliers producing printed packaging and decorative substrates used alongside coverings, supporting demand for lower-VOC inks and controlled emissions processes.
Value Chain Analysis
The value chain runs from upstream polymers, metals, and textiles through conversion into fabrics, slats, rails, and hardware, followed by final assembly of operating mechanisms (manual, motorized, and smart controls). Upstream steps include yarn production and weaving or knitting for shade fabrics, aluminum extrusion for headrails and bottom rails, and injection molding or composite forming for components. Midstream players add coating and finishing for glare control, antimicrobial performance, or blackout, then fabricate and assemble made-to-measure products.
Vertical integration is common among larger brands that combine extrusion, weaving, motor assembly, and software or control layers, while smaller regional fabricators typically emphasize customization, fast lead times, and local design libraries. Downstream, distribution relies on offline specialty retailers and installers for measurement and fitting, and increasingly on online configurators that translate measurements and options into factory orders. Operations are sensitive to raw-material volatility (PVC, aluminum, and fabrics) and to availability of skilled labor for custom fabrication, with many suppliers using JIT replenishment and vendor-managed inventory to reduce damage risk and manage high-SKU assortments across fabrics and hardware. Supply is anchored by highly integrated manufacturing clusters in China, alongside diversification strategies that use alternative Asian sourcing and localized assembly to shorten lead times and reduce tariff and logistics exposure.
Competitive Landscape
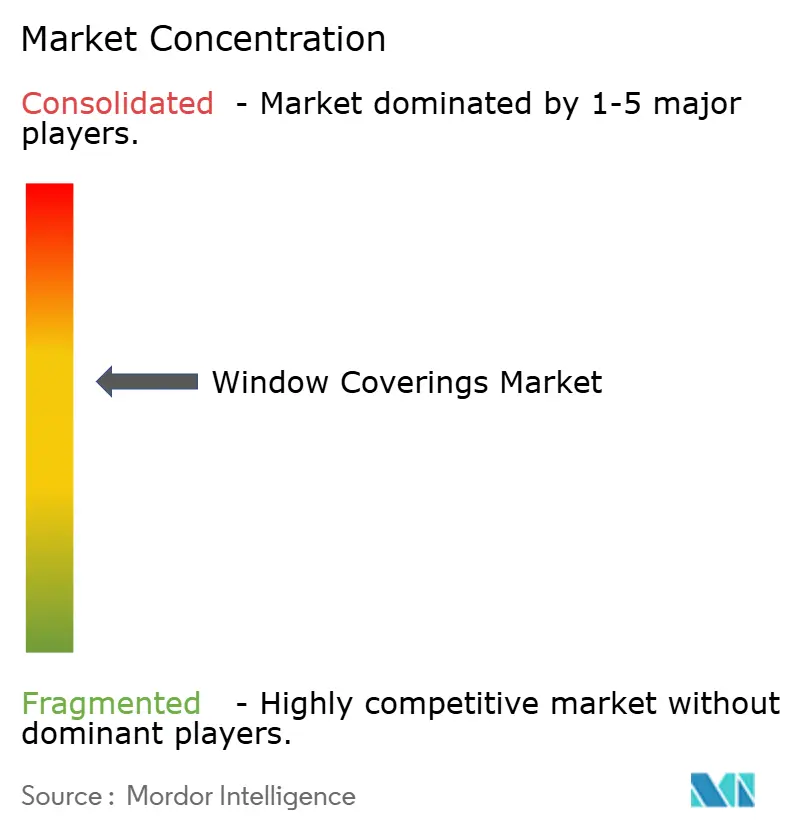
The window coverings industry is moderately consolidated. Hunter Douglas, Springs Window Fashions, Somfy, Lutron, and MechoShade operate vertically integrated plants that span extrusion, weaving, motor assembly, and control software. Springs’ 2025 purchase of PowerShades reflects a land-grab for motorization. Lutron lowered price points with its USD 599 Triathlon Select, signaling a pivot from luxury to mid-market conquest.
European challenger Coulisse leverages Matter-over-Thread radios to court DIY renovators, while Swiss brand Griesser appeals to architects with hurricane-rated aluminum shutters. Regional fabricators compete by offering 10-day lead times and local-pattern fabrics but face rising compliance costs from child-safety and ecodesign mandates. IoT cybersecurity guidelines from NIST give an edge to brands that can prove encrypted local control.
Smart glass looms as a substitution threat; yet its installed cost still runs two-to-three times that of motorized shades in typical office jobs. Consequently, incumbents double down on open-protocol integration with building-management systems to preserve relevance. With half of commercial RFPs still excluding automated shades, headroom remains for both incumbents and nimble newcomers that can document measurable daylight-autonomy gains.
Window Coverings Industry Leaders
Hunter Douglas N.V.
Springs Window Fashions LLC
Somfy S.A.
Norman Window Fashions Ltd.
Lutron Electronics Co., Inc.
- *Disclaimer: Major Players sorted in no particular order

Market Opportunities and Future Outlook
Interoperable smart shading is a practical whitespace where manual mechanisms still represented 74.13% of 2025 volume, leaving a large retrofit pool in which battery-powered motors and open standards can reduce installation friction. Matter 1.2 certification for window-covering device control, along with manufacturer moves to broaden compatibility (for example, PowerView ecosystem expansion across brand tiers), supports wider cross-platform deployments for integrators and multi-property owners that want consistent control stacks across Apple, Google, and Amazon environments.
Compliance-driven specification also creates opportunity in commercial and public buildings where daylight autonomy, glare control, and envelope performance are tied to frameworks such as LEED and WELL and to code pathways such as California Title 24-2025. On materials, EU product-information requirements and sustainability disclosure trends reinforce demand for composite and PVC-free formulations, especially for suppliers that can document recycled content and lifecycle attributes for bids. Supply-side investments further point to whitespace: Rollease Acmeda invested USD 10 million in a new manufacturing and distribution facility in Hope Mills, North Carolina (opened August 2025) to consolidate U.S. operations, supporting shorter lead times and lower import exposure for North American installers and OEM customers.
Recent Industry Developments
- July 2026: Hunter Douglas expanded its PowerView Automation ecosystem by adding compatibility with Alta Window Fashions motorized shades. The update broadens the addressable installed base for PowerView controls across additional price tiers and reduces integration work for dealers standardizing on one automation platform.
- January 2026: Lutron Electronics expanded its Palladiom shading system to support 16-ft-wide motorized units. This widens motorized shade applicability for larger openings such as commercial atriums and luxury residential great rooms, reducing the need for split systems and improving fit for architect-led projects.
- September 2025: Springs Window Fashions completed its acquisition of PowerShades, expanding its in-house automation portfolio. The transaction strengthens Springs’ ability to bundle motors, controls, and window covering assortments under one supply relationship for dealers and commercial specifiers.


Research Methodology Framework and Report Scope
Market Definition and Coverage
We size the window coverings market as revenues earned from products installed on windows for privacy, light control, insulation, and decoration across residential and non-residential buildings, covering manual, motorized, and smart options.
Scope exclusions: We exclude window glass and glazing systems, structural window frames, and building automation revenues that are not directly tied to the window covering product value.
Segmentation Overview
- By Product Type
- Blinds
- Shades
- Shutters
- Curtains and Drapes
- Other Product Types
- By Material
- Fabric
- Wood and Faux Wood
- Metal
- PVC/ Vinyl
- Composite
- Other Materials
- By Technology
- Manual
- Motorized (Battery, Hard-Wired)
- Smart, IoT-Enabled
- By End-User
- Residential
- Commercial
- Hospitality
- Healthcare and Institutional
- Other End-Users
- By Distribution Channel
- Offline
- Online
- By Geography
- North America
- United States
- Canada
- Mexico
- South America
- Brazil
- Argentina
- Rest of South America
- Europe
- Germany
- United Kingdom
- France
- Italy
- Spain
- Rest of Europe
- Asia-Pacific
- China
- Japan
- India
- South Korea
- Australia and New Zealand
- Rest of Asia-Pacific
- Middle East and Africa
- Middle East
- United Arab Emirates
- Turkey
- Saudi Arabia
- Africa
- South Africa
- Nigeria
- Rest of Africa
- Middle East
- North America
Data Sources, Market Sizing, and Validation
Desk Research
Desk work starts by mapping demand signals that connect clearly to window coverings, and then we align them to product pricing and shipment patterns. We relied on public sources such as U.S. Census housing and construction releases, Eurostat construction indicators, national statistics offices for household formation and renovation activity, and UN Comtrade trade flows for textiles, plastics, and related finished goods that proxy imports and exports.
To make the desk view more actionable, we also reviewed company annual reports, investor decks, product catalogs, and reputable press coverage to track mix shifts between manual, motorized, and smart products. Patent databases were used to identify where motorization and connectivity features are accelerating, which helps explain ASP changes over time. In a few places, we also used paid subscriptions for company financials and intelligence, plus an import and export shipment-level dataset for directional checks on cross-border movement. These examples are not exhaustive, and we used other sources to collect, validate, and clarify data points during the work.
Primary Interviews and Surveys
Primary work was used to confirm how volume moves between offline and online channels, and how installers and retailers treat motorized and smart upgrades in project quotes. We spoke with a mix of manufacturers, distributors, retailers, installers, and commercial buyers across APAC, EMEA, and the Americas, and then used those inputs to close gaps in pricing, replacement cycles, and regional mix assumptions.
Distribution of primary research fieldwork respondents
| Company type | Respondent position | Region |
|---|---|---|
| Top tier: 25% | CXOs: 20% | APAC: 50% |
| Mid tier: 55% | Functional/Unit leaders: 24% | EMEA: 29% |
| Smaller Players: 20% | Managers: 56% | Americas: 21% |
Market-Sizing & Forecasting
The core model uses a top-down approach where construction output, renovation intensity, and housing stock trends are translated into an addressable demand pool for window coverings, which is then expressed in value using region-specific mix and pricing. Results are then corroborated with selective bottom-up approximations, such as sampled channel checks on typical order values and supplier roll-ups in key countries, before the totals are adjusted.
A few inputs that matter most include new residential completions and permits, remodeling spend and replacement cadence, penetration of motorized and smart coverings, offline versus online share, and material mix shifts (fabric versus wood, faux wood, metal, and PVC or vinyl) that change the average selling price. Where direct volume is hard to observe, we use trade and production proxies and then reconcile them with what installers and retailers report as the most common project sizes and price bands.
For forecasting, scenario analysis is used so growth stays tied to practical drivers like housing starts, renovation cycles, and energy efficiency retrofits, while adoption curves for motorized and smart products are shaped by what primary respondents expect in their regions. Assumptions are kept readable, and when a data series is missing for a country, we bridge using regional analogs and then re-check with expert feedback before acceptance.
Data Validation & Update Cycle
We validate outputs by triangulating across independent signals, and then we run variance checks so the final market total does not drift away from building activity, trade direction, and observed channel pricing. If a region shows an unusual jump, the drivers are re-tested, followed by a second-pass review of conversion factors like unit-to-value, mix shares, and currency assumptions.
Before sign-off, the model goes through step-by-step analyst review so calculations can be traced back to each input series and interview note. Reports are refreshed annually, and interim updates are made when material events occur, such as sharp currency moves, large pricing resets, or major shifts in construction and renovation conditions. Right before delivery, we do a fresh review pass to make sure clients receive the most current view available.
Mordor Intelligence's Window Coverings Market Size Versus Other Published Estimates
Published market values for window coverings can vary because scope lines are drawn differently, and because the timing of prices and currencies is not always consistent. Some sources also mix adjacent items into the same bucket, which makes it harder to compare figures even when the market name looks similar.
In our work, the biggest gap drivers are usually whether window films and broader shading systems are counted, how motorized and smart upgrades are priced, and whether estimates use a single-year spot price or a blended view across the year. The refresh cycle also matters because renovation activity and promotional pricing can shift quickly, and the table differences often reflect when assumptions were last re-checked and how currency conversion was handled.
Benchmark comparison
| Source | Market Size | Gaps in Research Methodology |
|---|---|---|
| Mordor Intelligence | USD 28.96 B (2025) | |
| Regional Consultancy A | USD 28.05 B (2024) | Uses an earlier base year and appears to fold in window films as a product type, which can shift totals when film demand is strong in retrofit-heavy regions. |
| Trade Journal B | USD 16.50 B (2024) | Likely applies a narrower product boundary and a different price basis, which can understate value when motorized and smart features push ASPs upward in mainstream channels. |
The spread mostly comes down to what is counted as a window covering and when prices are captured, and not because demand moved abruptly in one year. By re-checking ASP logic and currency timing during each update cycle, then stress-testing totals against construction and renovation signals, Mordor Intelligence keeps the 2025 number tied to an auditable mix of volume, channel, and pricing assumptions.


Key Questions Answered in the Report
How large will global revenue for window coverings be by 2031?
The window coverings market is projected to reach USD 37.85 billion by 2031, reflecting a 4.66% CAGR from 2026-2031.
Which product category is growing fastest?
Shades are forecast to rise at a 5.12% CAGR as architects favor roller platforms that integrate with smart-building systems.
Why are composite materials gaining traction?
Composite, PVC-free blends satisfy cradle-to-cradle and digital-passport rules, supporting the swiftest 5.68% CAGR among material segments.
What drives commercial adoption of automated shading?
Tenant well-being metrics, LEED daylight credits, and energy-cost savings push commercial installations toward smart, IoT-enabled solutions.
How does Matter influence purchasing decisions?
Matter 1.2 unifies lift and tilt commands across brands, reducing vendor lock-in and accelerating mainstream acceptance of connected shades.
Is smart glass likely to replace automated shades?
Electrochromic glazing offers performance gains but still costs two-to-three times more than motorized shades, limiting substitution to high-budget new buildings.
Page last updated on:


 Your data is secure and never sold or shared.


