
Market Overview
| Study Period | 2021 - 2031 |
|---|---|
| Market Size (2026) | USD 55.49 Billion |
| Market Size (2031) | USD 87.86 Billion |
| Growth Rate (2026 - 2031) | 9.62 % |
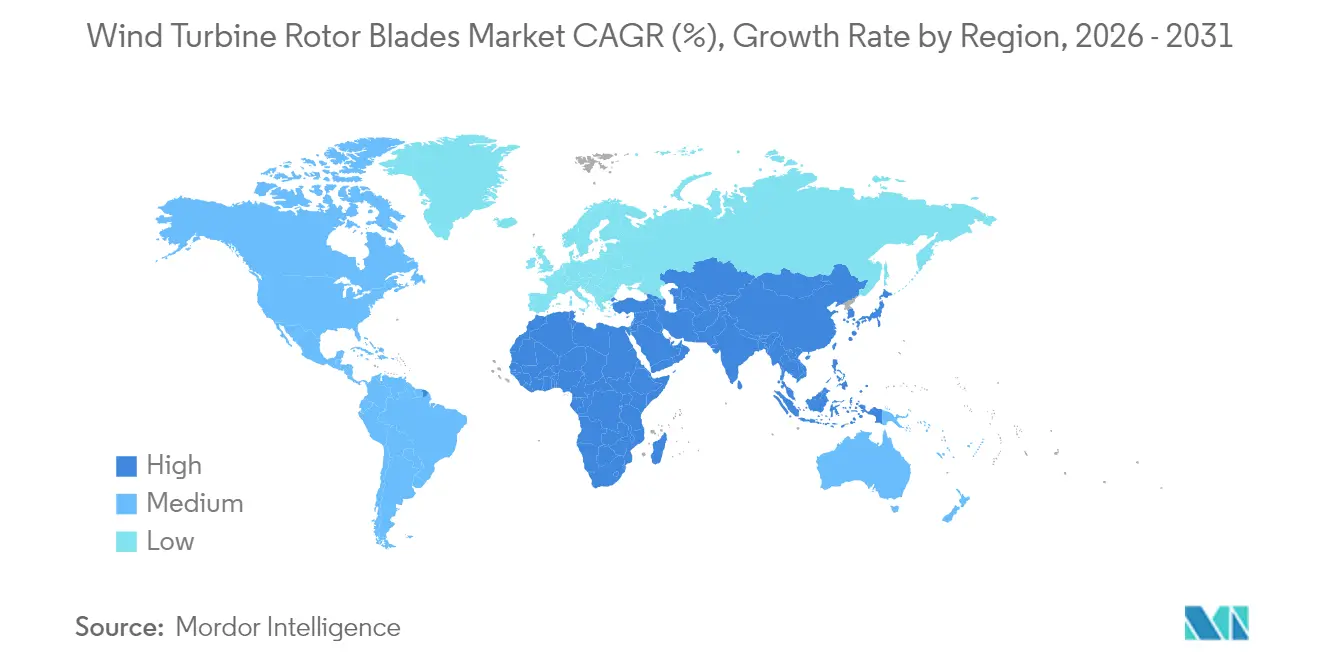
| Fastest Growing Market | Middle East and Africa |
| Largest Market | Asia Pacific |
| Market Concentration | Medium |
Major Players *Disclaimer: Major Players sorted in no particular order Image © Mordor Intelligence. Reuse requires attribution under CC BY 4.0. | |
Wind Turbine Rotor Blades Market Analysis by Mordor Intelligence
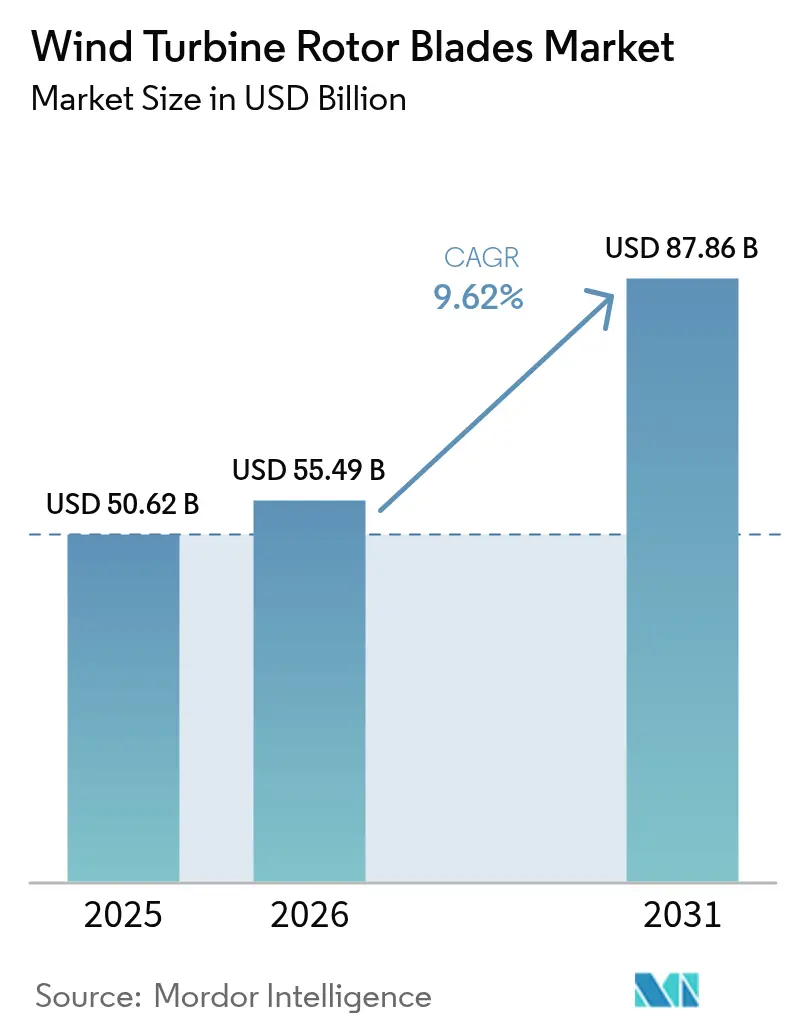
Wind Turbine Rotor Blades Market size in 2026 is estimated at USD 55.49 billion, growing from 2025 value of USD 50.62 billion with 2031 projections showing USD 87.86 billion, growing at 9.62% CAGR over 2026-2031.
Capacity additions in offshore wind, the pivot toward 15 MW-plus turbines, and rapid advances in hybrid composites are shaping demand. Blade manufacturers are embracing segmented, 70 m+ formats to overcome road-haul limits, while policy incentives in the United States and Europe are stimulating localized production. Asia-Pacific retains a manufacturing cost edge, yet regional supply chains face pressure from chronic carbon-fiber shortages that inflate input costs. Opportunities are emerging for firms combining vertical integration with recyclable materials, advanced lightning protection, and remote monitoring solutions that reduce lifetime maintenance expenditure.
Key Report Takeaways
- By location of deployment, onshore retained 82.35% wind turbine rotor blade market share in 2025, whereas offshore blades are projected to expand at a 29.9% CAGR through 2031.
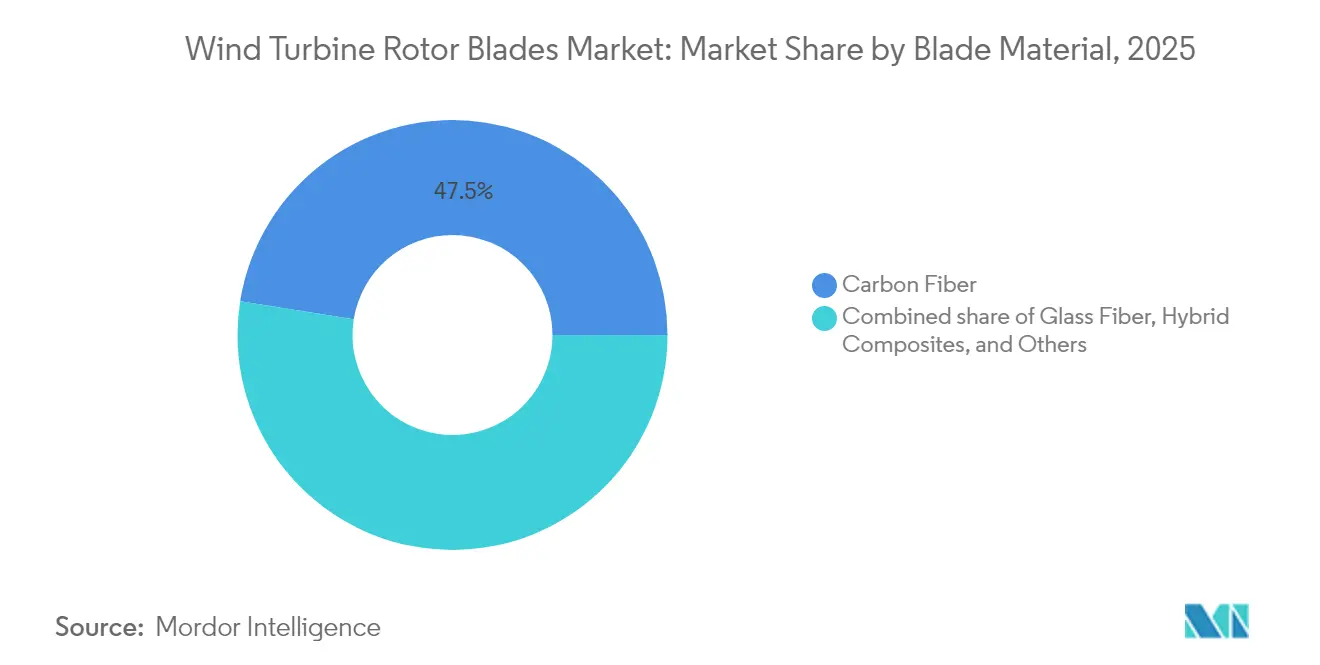
- By blade material, carbon fiber dominated with 47.50% share in 2025; hybrid composites are forecast to post 10.39% growth, the fastest among material types.
- By blade length, the 61-75 m category led with 44.30% share of the wind turbine rotor blade market size in 2025, while blades above 75 m are advancing at 12.85% CAGR to 2031.
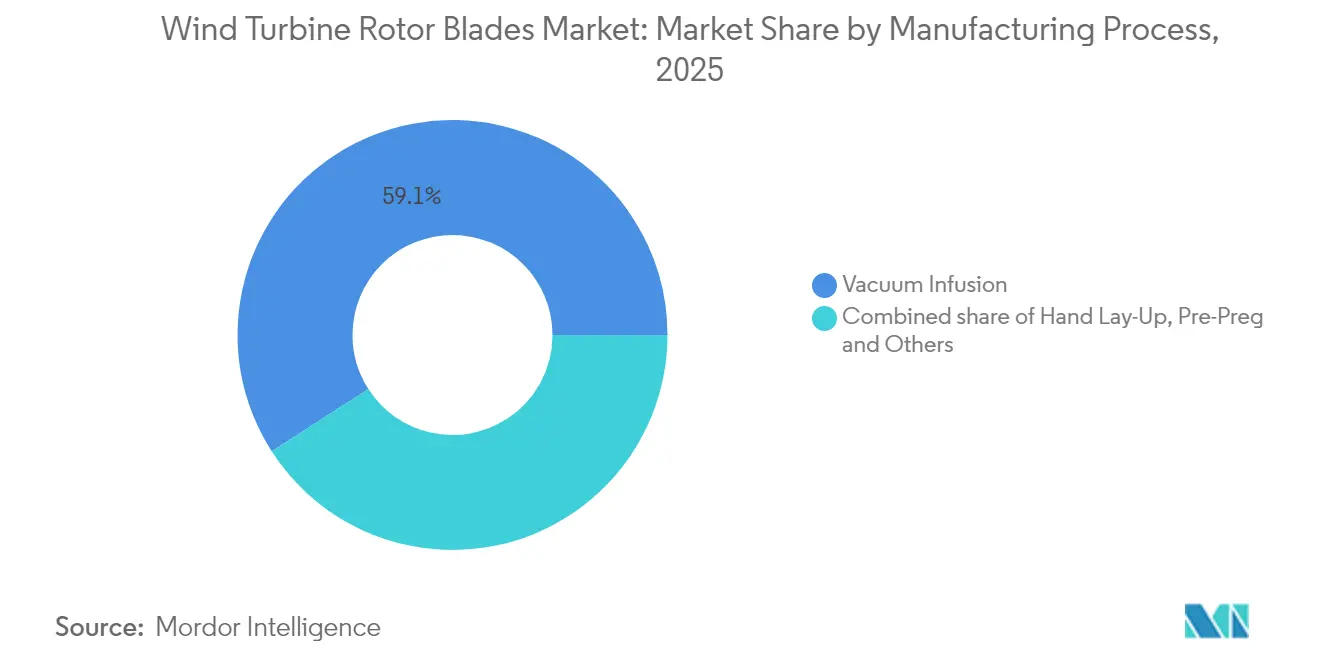
- By manufacturing process, vacuum infusion accounted for 59.10% of production in 2025; pre-preg lines are accelerating at a 10.24% CAGR amid tighter tolerances for offshore blades.
- By geography, Asia-Pacific commanded 52.40% of global revenue in 2025, whereas the Middle East and Africa wind turbine rotor blade market is projected to grow at a 28.15% CAGR to 2031.
- LM Wind Power, TPI Composites, and Siemens Gamesa jointly held more than 35% wind turbine rotor blade market share in 2025, underlining moderate consolidation within the sector.
Note: Market size and forecast figures in this report are generated using Mordor Intelligence’s proprietary estimation framework, updated with the latest available data and insights as of 2026.
Market Trends and Insights
Drivers Impact Analysis of Wind Turbine Rotor Blades Market*
| Driver | (~) % Impact on CAGR Forecast | Geographic Relevance | Impact Timeline |
|---|---|---|---|
| Rapid scale-up of >5 MW turbines in Chinese coastal provinces | +1.5% | Asia-Pacific core, spill-over to global supply chains | Medium term (2-4 years) |
| US Inflation Reduction Act production tax credits catalyzing domestic blade output | +1.2% | North America & EU, indirect global impact | Short term (≤ 2 years) |
| EU REPowerEU plan accelerating repowering of post-2010 onshore fleets | +0.8% | Europe core, technology transfer to emerging markets | Medium term (2-4 years) |
| OEM demand for 70 m+ modular blades to cut transport bottlenecks | +0.6% | Global, with early gains in land-locked regions | Long term (≥ 4 years) |
| Brazil's FINAME green-financing unlocking local blade capacity | +0.5% | South America, potential replication in MEA | Medium term (2-4 years) |
| Floating-offshore demonstrators transitioning to serial 100 m blade orders | +0.4% | North America & EU, expansion to APAC | Long term (≥ 4 years) |
| Source: Mordor Intelligence | |||
Rapid scale-up of Above 5 MW turbines in Chinese coastal provinces
China installed 31.4 GW of offshore capacity by 2024, and most new projects now specify 15 MW machines that need 100 m-plus blades.[1]Manufacturers such as Goldwind are expanding Jiangsu and Guangdong factories to build ultra-large composite structures. High domestic volumes shorten learning curves, lower per-unit costs, and accelerate technology diffusion to export markets. This dynamic allows Chinese suppliers to bid aggressively in global tenders, compelling European and US rivals to invest in cost-cutting automation. The resulting competition heightens the strategic importance of secure carbon-fiber supply and modular tooling that can handle 120 m form factors, reinforcing Asia-Pacific’s leadership in the wind turbine rotor blade market.
US Inflation Reduction Act production tax credits catalyzing domestic blade output
Section 45X grants USD 0.02 per blade produced in the United States, making local manufacturing viable despite higher labor costs.[2] TPI Composites has already reached its 100,000-blade milestone and is adding new US lines. The 10-year credit horizon reduces investment risk, attracting European and Asian partners that seek compliant supply chains. Rising domestic content thresholds encourage material suppliers to co-locate, reshaping logistics flows inside North America. Resultant spending boosts overall installations, reinforcing a virtuous circle for the wind turbine rotor blade market.
EU REPowerEU plan accelerating repowering of post-2010 onshore fleets
REPowerEU aims for 50% wind power by 2050, driving a wave of blade-only upgrades on turbines commissioned after 2010. Streamlined permits cut project timelines, with German and Danish farms swapping in longer, lighter blades that lift energy capture by up to 30%. The strategy maximizes output without new foundations, making retrofit economics attractive even in high-cost markets. Blade suppliers are designing “plug-and-play” formats that fit existing hub interfaces while embedding new aerofoil and lightning protection features. These niche products extend the revenue mix beyond greenfield installations, diversifying earnings across the wind turbine rotor blade market.
OEM demand for 70 m+ modular blades to cut transport bottlenecks
Segmented blade designs led by Nabrawind’s Nabrajoint let 100 m blades navigate standard roads, trimming USD 100 000–150 000 per load in logistics expense. The concept is gaining traction in landlocked Europe, India, and Latin America, where road curvature and bridge clearance limit conventional hauls. Modular assembly near the site reduces breakage risk and accelerates installation. Parallel innovations such as Radia’s WindRunner aircraft could move 300-foot blades directly to remote hubs, further opening high-yield wind corridors. Together, these breakthroughs expand geographical reach and sustain growth momentum for the wind turbine rotor blade market.
Restraints Impact Analysis of Wind Turbine Rotor Blades Market*
| Restraint | (~) % Impact on CAGR Forecast | Geographic Relevance | Impact Timeline |
|---|---|---|---|
| Chronic carbon-fiber supply tightness | -0.90% | Global, most acute in offshore segments | Short term (≤ 2 years) |
| Higher LCOE penalty for sub-2 MW turbine classes | -0.70% | Europe and North America legacy fleets | Medium term (2-4 years) |
| Logistics restrictions on >80 m blades in land-locked European regions | -0.5% | Europe core, emerging in mountainous regions globally | Long term (≥ 4 years) |
| Offshore de-commissioning liability tightening project bankability | -0.3% | North America & EU offshore markets | Long term (≥ 4 years) |
| Source: Mordor Intelligence | |||
Chronic carbon-fiber supply tightness inflating input costs
Aerospace recovery and electric-vehicle growth have lifted carbon-fiber prices by 15-20% since 2024. Offshore blades now use carbon in spar caps and root sections that account for 40% of total weight, making supply bottlenecks critical. Chinese producers, who hold 60% of global capacity, prioritize higher-margin sectors, squeezing wind allocations. Blade makers respond with hybrid lay-ups that spare the scarcest grades, yet each redesign triggers new certification cycles and adds cost. Firms are eyeing backward integration into fiber production to control availability and stabilize margins across the wind turbine rotor blade market.
Higher LCOE penalty for sub-2 MW turbine classes suppressing blade retrofit
Lazard’s levelized cost models show a 20-30% penalty for maintaining turbines below 2 MW relative to modern 3-5 MW units.[4] Owners of early-2000s fleets face poor economics for blade-only upgrades and instead favor site redevelopment. This cuts the addressable refurbishment volume and redirects demand to full-scale replacements or greenfield builds. Blade suppliers concentrate R&D on larger formats and specialized offshore products, reshaping capacity planning throughout the wind turbine rotor blade market.
*Our forecasts treat driver/restraint impacts as directional, not additive. The impact forecasts reflect baseline growth, mix effects, and variable interactions.
Wind Turbine Rotor Blades Market Segment Analysis
By Location of Deployment:
Offshore surge reshaping dynamicsOffshore blades posted a 29.9% CAGR between 2025 and 2031, even as onshore commanded 82.35% revenue in 2025. Floating prototypes are shifting into serial 100 m orders that require corrosion-resistant coatings and advanced lightning arrestors, adding 15-20% to build cost. Europe’s pipeline and China’s coastal megaprojects sustain large-scale demand. Conversely, onshore growth hinges on modular solutions that overcome road limits while tapping high-quality inland wind corridors. Cost-efficient series production under vacuum infusion helps protect margins in this high-volume part of the wind turbine rotor blade market.
Longer term, the offshore pipeline’s depth ensures continued share gains. North Sea leases, US Atlantic approvals, and Japanese floating tenders underpin multi-gigawatt orders for the next decade. Onshore will remain essential for market balance; yet its role increasingly revolves around retrofitting mature sites and serving emerging economies where quick-turn installations match policy timelines. Suppliers that align product roadmaps with these divergent needs can defend or expand their presence across the wind turbine rotor blade market.
By Blade Material:
Hybrid composites challenging carbon fiberCarbon fiber dominated 47.50% of the market share in 2025 owing to unmatched stiffness-to-weight ratios, but its supply issues and price volatility are steering OEMs to hybrid lay-ups. Hybrid composite blades grow 10.39% annually by strategically placing carbon only in load-critical webs while substituting cost-effective glass elsewhere. This design cuts weight by up to 12% over all-glass equivalents and maintains structural margins needed for 15 MW turbines.
Glass fiber remains relevant for onshore blades below 70 m, where transport and tower strength rather than weight drive economics. Meanwhile, research into thermoplastic matrices offers end-of-life recyclability and faster production cycles. Vestas's recyclable carbon fiber thermoplastics trials in 100 m blades illustrate progress. As regulation tightens around circularity, material breakthroughs will influence competitive positioning in the wind turbine rotor blade market.

By Blade Length:
Mega-blades driving growth above 75 mThe 61-75 m category retained 44.30% wind turbine rotor blade market share in 2025 because it fits today’s mainstream land-based turbines. However, blades exceeding 75 m are growing at 12.85% CAGR as manufacturers chase 15+ MW ratings. Building blades over 100 m reshapes factory layouts, tooling, and quality regimes. Automated fiber placement and digital twins reduce defect risk while speeding production.
Logistics frames the next hurdle. Road limits and turning radii cap blade length for inland sites; hence, modular tech and novel carriers like the WindRunner aircraft become critical enablers. Under 45 m blades now serve only niche repowering jobs or community-scale turbines. The ongoing length race underscores the strategic weight of R&D capital in the wind turbine rotor blade market.
By Manufacturing Process:
Pre-preg innovation acceleratingVacuum infusion safeguarded a 59.10% share in 2025 by pairing cost efficiency with large-part capability. Yet pre-preg lines are rising 10.24% annually because they deliver tight resin control vital for offshore blades that face salt spray, dynamic loads, and ice accretion. Pre-preg sheets cut void content, so fatigue life improves, and surface finish smoothness lifts aerodynamic efficiency. The trade-off remains higher material and freezer storage costs.
Hand lay-up declines as automation advances. New infusion variants add robotic fabric placement to retain low cost but raise consistency. Thermoplastic tape winding and in-situ consolidation enter pilot scale, promising faster cycle times and recyclability. Selecting the optimal process now hinges on blade length, order volume, and target region, sharpening competitive edges within the wind turbine rotor blade market.
Geography Analysis
APAC Wind Turbine Rotor Blades Market
Asia-Pacific captured 52.40% of global demand in 2025, anchored by China’s 31.4 GW offshore base and its push toward 15 MW turbines that need 100 m-plus blades. Investments in automated sanding, resin infusion, and modular molds support rapid scaling. Japan and South Korea cultivate floating offshore pilots, while India’s onshore build-out benefits from hybrid composite cost savings. Rising wages and stricter environmental rules are nudging suppliers toward greater automation, yet the region’s scale keeps unit costs low, sustaining leadership in the wind turbine rotor blade market.
Europe Wind Turbine Rotor Blades Market
Europe’s mature fleet now pivots to repowering and deep-water projects. The REPowerEU drive accelerates blade upgrades on post-2010 turbines, and the UK alone targets 115 GW offshore by 2050 with 35% floating share. Landlocked Alpine and Balkan zones force the adoption of segmented blades that can move through tight passes. Regulation favors recyclability, spurring materials R&D partnerships between blade makers and chemical companies. European OEMs leverage advanced design and sustainability credentials to maintain a premium segment edge.
The Americas and MEA Wind Turbine Rotor Blades Market
The Middle East and Africa’s 28.15% CAGR through 2031 reflects Saudi, Emirati, and Egyptian wind targets that could lift regional capacity to 131 GW. Harsh climates demand leading-edge coatings resistant to sand erosion. Domestic content clauses begin to surface, heralding new assembly plants near Red Sea and Gulf ports. North America’s trajectory centers on IRA incentives that relocalize supply chains, while South America’s Brazil-led momentum hinges on FINAME green finance. Collectively, these regional vectors diversify revenue streams and buffer suppliers against single-market shocks in the wind turbine rotor blade market.
Regulatory Landscape
Certification and design compliance for wind turbine rotor blades continues to be anchored to IEC 61400 requirements, including BS EN/DS/ANSI-adopted versions such as IEC 61400-5 (updated via the +A1:2025 amendment). The scope covers blade structural design, material evaluation, manufacturing quality management, and operational safety. This standardization supports cross-border qualification for larger offshore blades, and it also adds documentation and testing load as manufacturers shift toward 100 m-plus formats.
Sustainability and trade measures are increasingly affecting procurement and supply chain choices. In the European Union, Implementing Regulation (EU) 2026/718 introduces a minimum 70% recyclability requirement for wind turbine blades in public procurement procedures launched from 30 June 2026. In the United States, the Department of Energy allocated USD 20 million through a wind turbine recycling funding opportunity (with selection notifications in spring 2025) to accelerate composite recycling technologies. At the same time, tariff and duty administration, including Harmonized Tariff Schedule classification updates and broader 2026 tariff layers, adds another variable to blade and materials sourcing decisions.
Competitive Landscape
Competition is moderately concentrated. LM Wind Power, TPI Composites, and Siemens Gamesa accounted for over one-third of global deliveries in 2024, benefitting from scale economies and broad product portfolios. Consolidation continues as smaller firms struggle with rising certification costs and carbon-fiber shortages. Leaders pursue vertical integration into materials and structural testing to secure supply and cut lead times.
Strategically, localization shapes new investments. TPI’s US expansion exploits IRA credits, while CS Wind’s USD 200 million Vietnam plant underpins cost-competitive exports to Asia-Pacific and the Middle East. R&D pipelines focus on segmented blades, recyclable thermoplastics, and predictive maintenance sensors that flag lightning strikes or leading-edge erosion. Digital twin models track strain in real time, enabling condition-based maintenance and lowering lifetime cost per kWh.
White-space innovation attracts start-ups. Radia’s WindRunner targets remote onshore sites, and Nabrawind’s Nabrawind Nabrajoint modular interface gains OEM endorsements. Materials specialists scale bio-based resins that cure at lower temperatures, cutting energy usage. Success now hinges on balancing mass-production prowess with bespoke engineering, a dynamic that will continue to define hierarchy in the wind turbine rotor blade market.
Wind Turbine Rotor Blades Industry Leaders
-
LM Wind Power (GE Renewable Energy)
-
Siemens Gamesa Renewable Energy
-
TPI Composites Inc.
-
Vestas Wind Systems A/S
-
Nordex SE
- *Disclaimer: Major Players sorted in no particular order

Wind Turbine Rotor Blades Market Companies Covered in this Report
- LM Wind Power (GE Renewable Energy)
- TPI Composites Inc.
- Siemens Gamesa Renewable Energy S.A.
- Vestas Wind Systems A/S
- Nordex SE
- Suzlon Energy Ltd.
- Xinjiang Goldwind Science & Technology Co.
- Lianyungang Zhongfu Lianzhong Composites Group Co. Ltd.
- Sinoma Wind Power Blade Co. Ltd.
- Ming Yang Smart Energy Group Ltd.
- Aeris Energy
- Enercon GmbH
- Dongfang Electric Wind Power Co.
- MFG Wind
- Envision Energy
- Kanpur Plastipack Rotor Division
- PowerBlades GmbH
- Gurit Holding AG
- TECSIS Tecnologia e Sistemas Avancados
- CRRC Wind Power
Market Opportunities and Future Outlook
Localization of blade manufacturing is creating near-term whitespace for suppliers that can combine regional capacity with technology suited to larger turbines. Nordex began production in May 2026 at its Menemen, Izmir blade facility (up to 1,200 blades annually at full utilization), and ENERCON announced a EUR 50 million rotor blade plant in Bergama, Izmir, targeting a Q4 2026 opening and 150 blade sets per year. Together, these projects broaden near-shore supply between Europe and surrounding growth markets, and they support demand for 70 m-plus and offshore-class blades as transport, lead time, and local content requirements increasingly shape OEM sourcing.
Circularity and end-of-life solutions are also influencing blade specification for offshore and public-tender projects. WindEurope highlighted a sector-wide voluntary ban on sending decommissioned blades to landfill from January 2026. Industrial recycling activity is advancing as Stena Recycling moved chemical recycling (developed with Vestas) into a testbed environment in Halmstad, Sweden in May 2026 to validate separation of epoxy, glass, and carbon fiber at larger scale. On the deployment side, RWE reported installing the first turbines at its 1.1 GW Thor offshore project in Denmark in April 2026, using recyclable rotor blades with a specialized resin, which reinforces procurement pathways for recyclable blade designs alongside conventional performance metrics.
Recent Industry Developments in Wind Turbine Rotor Blades Market
- July 2026: TPI Composites completed its financial restructuring and emerged from Chapter 11 under new ownership, becoming a portfolio company of Energy Capital Partners. The reorganized company continued operating blade manufacturing in Iowa (United States) and Juarez (Mexico) alongside its field services footprint, supporting continuity of supply for OEM programs that rely on established North American capacity.
- July 2025: Energiequelle commissioned two new Enercon turbines in Germany as a repowering project, replacing older E-58 units with two 5.56 MW turbines. Repowering activity of this type increases demand for updated blade sets and related services while leveraging existing grid connections and site permits.
- June 2024: Vestas announced plans to establish a new blade factory at Leith Docks in Scotland to support North Sea offshore wind. The facility is tied to manufacturing blades for the V236-15.0 MW platform, aligning European blade capacity with the industry shift toward 15 MW-class turbines and 100 m-class rotor blades.
Wind Turbine Rotor Blades Market Report Scope and Research Methodology
Market Definition and Coverage
For this study, the wind turbine rotor blades market is defined as revenues from manufacturing and selling rotor blades used on onshore and offshore wind turbines, captured in USD at the blade supply level for the study period.
Scope exclusions: We exclude nacelles, towers, foundations, installation, grid connection works, and long term operations and maintenance services.
Segments Covered in This Report
- By Location of Deployment
- Onshore
- Offshore
- By Blade Material
- Glass Fiber
- Carbon Fiber
- Hybrid Composites
- Others
- By Blade Length
- Below 45 m
- 46 to 60 m
- 61 to 75 m
- Above 75 m
- By Manufacturing Process
- Hand Lay-Up
- Vacuum Infusion
- Pre-Preg
- Others
- By Geography
- North America
- United States
- Canada
- Mexico
- Europe
- Germany
- United Kingdom
- France
- Spain
- Italy
- Russia
- Denmark
- Sweden
- Norway
- Rest of Europe
- Asia Pacific
- China
- India
- Japan
- Australia
- South Korea
- ASEAN Countries
- Rest of Asia Pacific
- South America
- Brazil
- Argentina
- Rest of South America
- Middle East and Africa
- United Arab Emirates
- Saudi Arabia
- South Africa
- Egypt
- Rest of Middle East and Africa
- North America
Data Sources, Market Sizing, and Validation
Desk Research
Desk research was used to map the demand picture for new wind capacity and the supply picture for blade production, and then to build initial assumptions for volumes and pricing direction. We referred to public sources such as IEA wind and electricity updates, IRENA renewable capacity statistics, GWEC publications, US EIA wind generation and capacity tables, and Eurostat energy datasets so the regional build-out trend could be cross-checked.
To convert activity into market value, we also reviewed customs trade statistics for relevant composite inputs and parts, patent databases for blade materials and manufacturing techniques, plus company annual reports and investor presentations for capacity additions and order signals. A paid subscription for company financials and intelligence was used to sanity-check revenue exposures, and an import and export shipment-level database was used selectively to validate trade direction in key corridors. The sources listed here are illustrative only, and many other public and paid references were also used for data collection, validation, and research clarification.
Primary Interviews and Surveys
Primary inputs were used to validate what desk sources usually do not spell out, like typical blade pricing by size class, how quickly average blade lengths are moving, and the mix shift between glass fiber and carbon use in newer designs. We spoke with a mix of blade manufacturers, composite ecosystem participants, wind project teams, and independent experts across APAC, EMEA, and the Americas, which helped tighten regional splits, offshore versus onshore assumptions, and the timing of project execution.
Distribution of primary research fieldwork respondents
| Company type | Respondent position | Region |
|---|---|---|
| Top tier: 33% | CXOs: 15% | APAC: 48% |
| Mid tier: 52% | Functional/Unit leaders: 27% | EMEA: 31% |
| Smaller Players: 15% | Managers: 58% | Americas: 21% |
Market-Sizing & Forecasting
Sizing is built using a top-down and bottom-up combination, where annual wind additions and rotor diameter trends are used to reconstruct the blade demand pool, and then converted to value using size-linked average selling prices by region. Because blades track turbine deployments closely, the model is organized around onshore versus offshore installations, and then adjusted for blades per turbine and average blade length progression.
Inputs used in the model (illustrative) include annual installed wind capacity, the offshore share of new builds, average rotor diameter by turbine class, composite material mix shifts (glass versus carbon), manufacturing capacity utilization signals, and trade and logistics indicators that can move delivered blade costs. Forecasting is done through scenario analysis, where policy momentum, grid connection pace, and project pipeline visibility are translated into capacity additions, followed by a pricing path that reflects expected blade size and material changes, and then reviewed with expert feedback.
After the top-down totals are formed, we corroborate them with selective bottom-up approximations, such as sampled blade ASPs by size bracket multiplied by estimated unit demand, followed by channel checks using tender activity and supplier commentary. When direct data is thin for a smaller region, proxy assumptions from a comparable market are applied and then refined through interview feedback and consistency checks against installation volumes.
Data Validation & Update Cycle
Validation is completed through multiple checks so the final totals are not driven by one dataset. Model outputs are compared against independent signals like annual wind installations, announced blade factory capacity, and observed shifts toward longer blades in offshore projects, and then any unusual results are reviewed before sign-off.
During review, currency conversions, year alignment, and implied pricing are re-checked, and follow-up calls are triggered when a regional split or growth rate looks out of line with the underlying deployment picture. Reports are refreshed annually, with interim updates made when material events occur such as policy changes, major pipeline resets, or step changes in offshore ordering. Before delivery, a final analyst pass is done so clients receive the latest updated view.
Mordor Intelligence's Wind Turbine Rotor Blades Market Size Compared Against Other Published Estimates
Published market sizes for rotor blades can vary widely because the counted item is not always consistent, and because base year selection and pricing ladders differ across studies. Some estimates start from wind additions and convert volumes into value, and others lean more on reported supplier-side revenues, which can create a large gap even if both are directionally correct.
Key differences in this market usually come from whether the number is limited to blades supplied into new turbine deployments, or it expands into lifecycle activity like retrofit and decommissioning, along with how offshore blade size progression is priced over time. Base years also matter a lot here because offshore order timing can swing quickly, and using a single global average price can mute the impact of longer, higher-value blades in certain regions.
Benchmark comparison
| Source | Market Size | Gaps in Research Methodology |
|---|---|---|
| Mordor Intelligence | USD 55.49 B (2026) | |
| Regional Consultancy A | USD 24.78 B (2024) | This figure uses a 2024 starting point and a broader rotor-blade storyline that can fold retrofit and end-of-life activity into the value, which changes the demand base versus new installations only. |
| Trade Journal B | USD 10.46 B (2023) | This estimate is anchored to 2023 and appears to rely more on reported supplier revenues with a simpler pricing ladder by blade class, which can undercount markets where offshore blade lengths are rising fastest. |
The spread mainly comes from year alignment and what adjacent activities are included around the blade, and not from one single calculation step. Some figures roll in retrofit or decommissioning related value, and some apply flatter price curves that do not fully reflect longer offshore blades. Those differences explain the range, with rotor blades counted only when supplied into wind turbine deployments in Mordor Intelligence sizing, and retrofit and end-of-life blade activity kept outside scope to keep the totals tied to installations, blade counts, and size-linked pricing.
Key Questions Answered in the Report
How large is the wind turbine rotor blade market today and how fast is it growing?
The market reached USD 55.49 billion in 2026 and is projected to rise to USD 87.86 billion by 2031, registering a 9.62% CAGR during 2026-2031.
Which region currently commands the greatest market share?
Asia-Pacific led with 52.40% of global revenue in 2025, driven by China’s rapid offshore build-out and established manufacturing base.
Why is the offshore segment expanding so quickly?
Commercial-scale projects now specify 15 MW-plus turbines that need 100 m-class blades, pushing offshore demand to a 29.9% CAGR through 2031 and spurring investments in precision manufacturing and corrosion-resistant designs.
How do carbon-fiber supply constraints affect blade producers?
Competing aerospace and automotive demand has lifted carbon-fiber prices by 15-20% since 2024, prompting blade makers to adopt hybrid composite lay-ups and consider backward integration to secure supply.
What policy incentives are reshaping blade manufacturing footprints?
The US Inflation Reduction Act’s Section 45X offers USD 0.02 per domestically produced blade, while the EU’s REPowerEU plan accelerates repowering projects-both driving manufacturers to localize production and upgrade product lines.
What innovations are easing transport bottlenecks for ever-longer blades?
Segmented 70 m-plus blades such as Nabrawind’s Nabrajoint can be hauled on standard roads, and Radia’s planned WindRunner aircraft aims to fly 300-foot blades directly to remote sites, cutting logistics costs and opening new onshore corridors.