
Whipping Cream Market Size and Share
Market Overview
| Study Period | 2021 - 2031 |
|---|---|
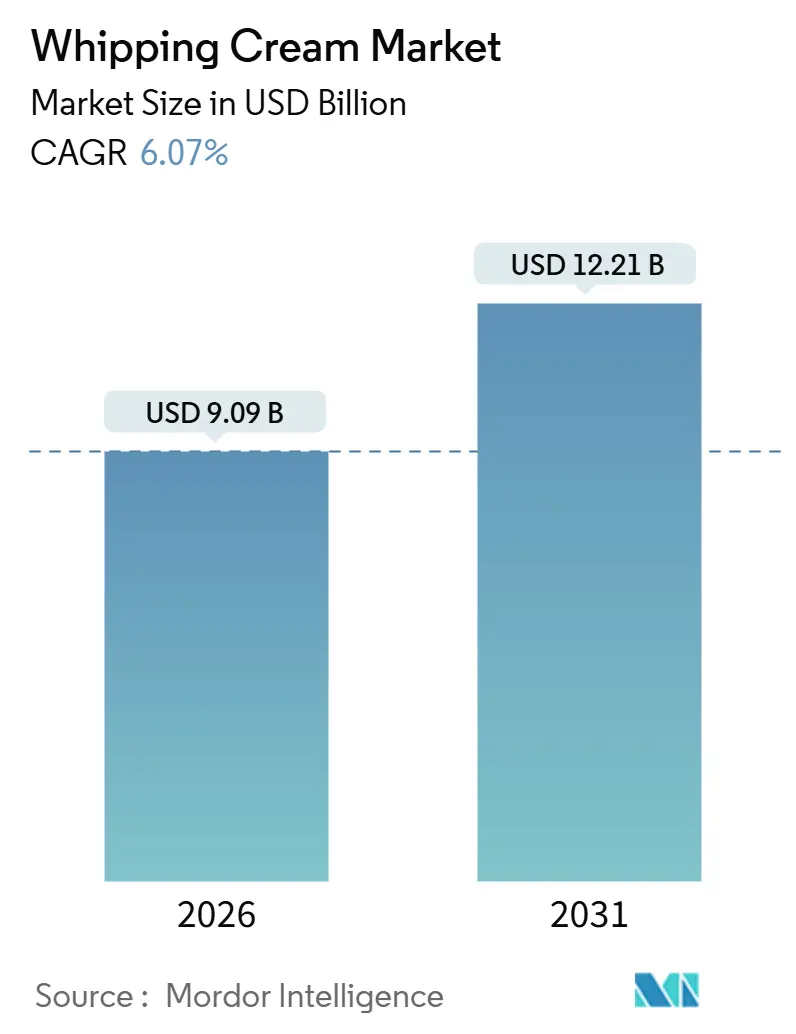
| Market Size (2026) | USD 9.09 Billion |
| Market Size (2031) | USD 12.21 Billion |
| Growth Rate (2026 - 2031) | 6.07 % |
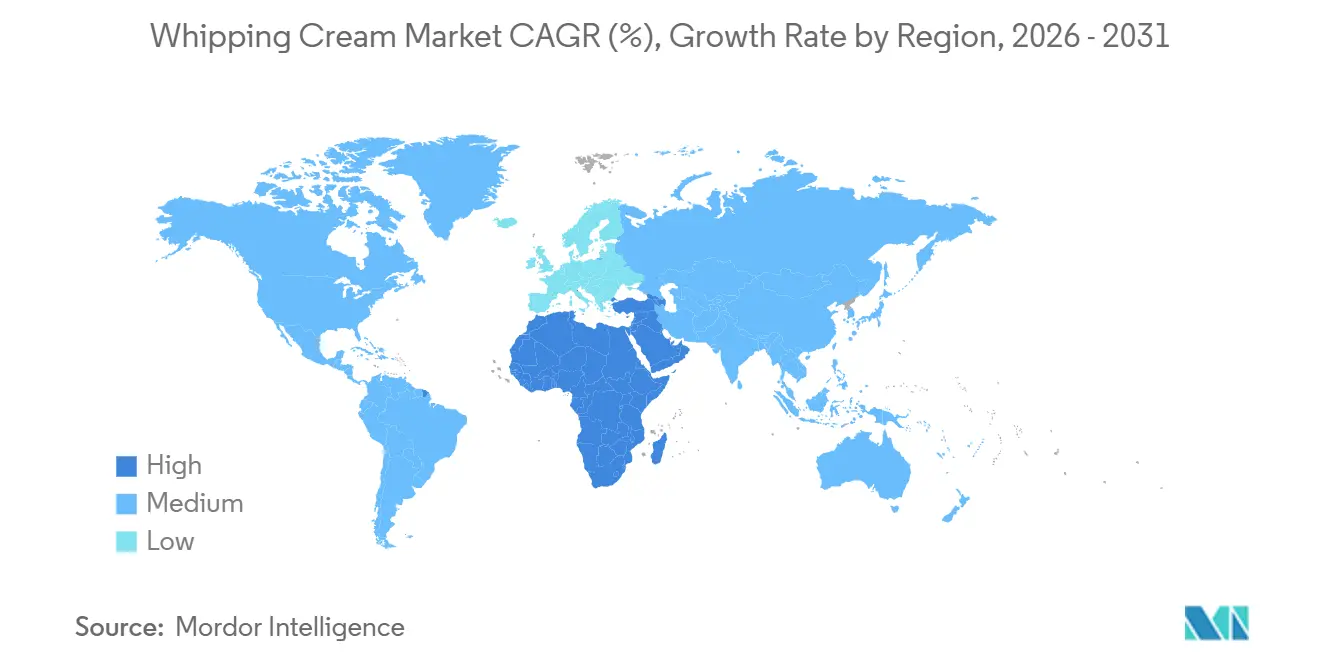
| Fastest Growing Market | Middle East and Africa |
| Largest Market | Europe |
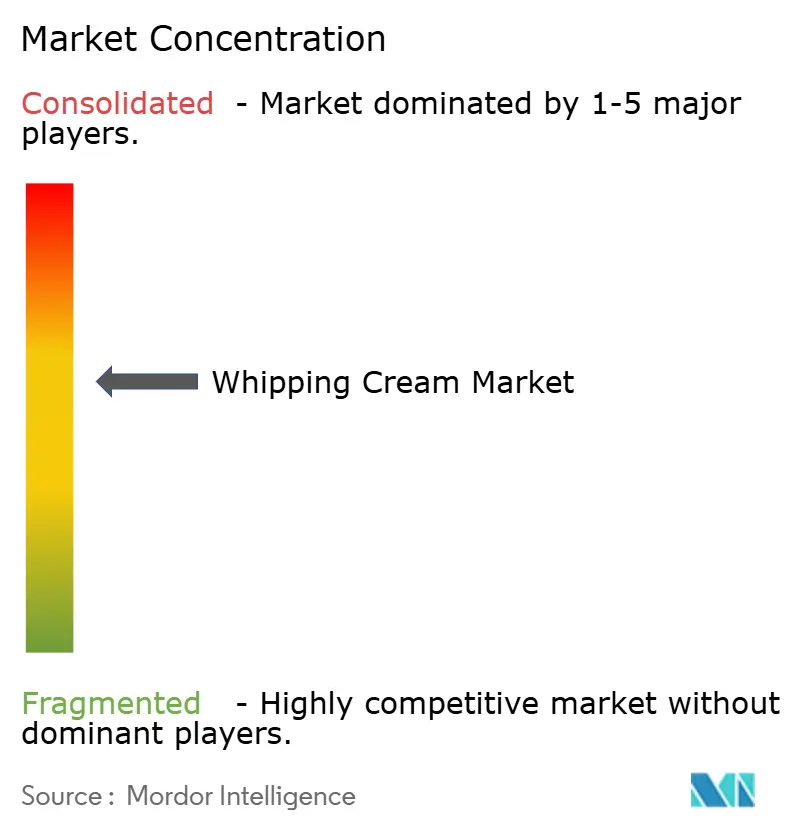
| Market Concentration | Medium |
Major Players *Disclaimer: Major Players sorted in no particular order Image © Mordor Intelligence. Reuse requires attribution under CC BY 4.0. | |
Whipping Cream Market Analysis by Mordor Intelligence
The whipping cream market size is estimated at USD 9.09 billion in 2026, and is expected to reach USD 12.21 billion by 2031, at a CAGR of 6.07% during the forecast period (2026-2031). This trajectory reflects structural shifts in how consumers and foodservice operators deploy dairy and plant-based toppings across beverages, desserts, and home-cooking applications. Capacity investments by major dairy cooperatives signal confidence in sustained demand, with Fonterra breaking ground on a USD 88 million UHT cream plant at Edendale in December 2024 that will produce 50 million litres annually by August 2026, doubling to 100 million litres by 2030. These moves underscore a bet that premiumisation in coffee culture, home baking, and on-trade hospitality will outpace health-driven substitution toward non-dairy alternatives. Regulatory clarity on plant-based labeling from the FDA in January 2025 further widens product choice and stimulates competition.
Key Report Takeaways
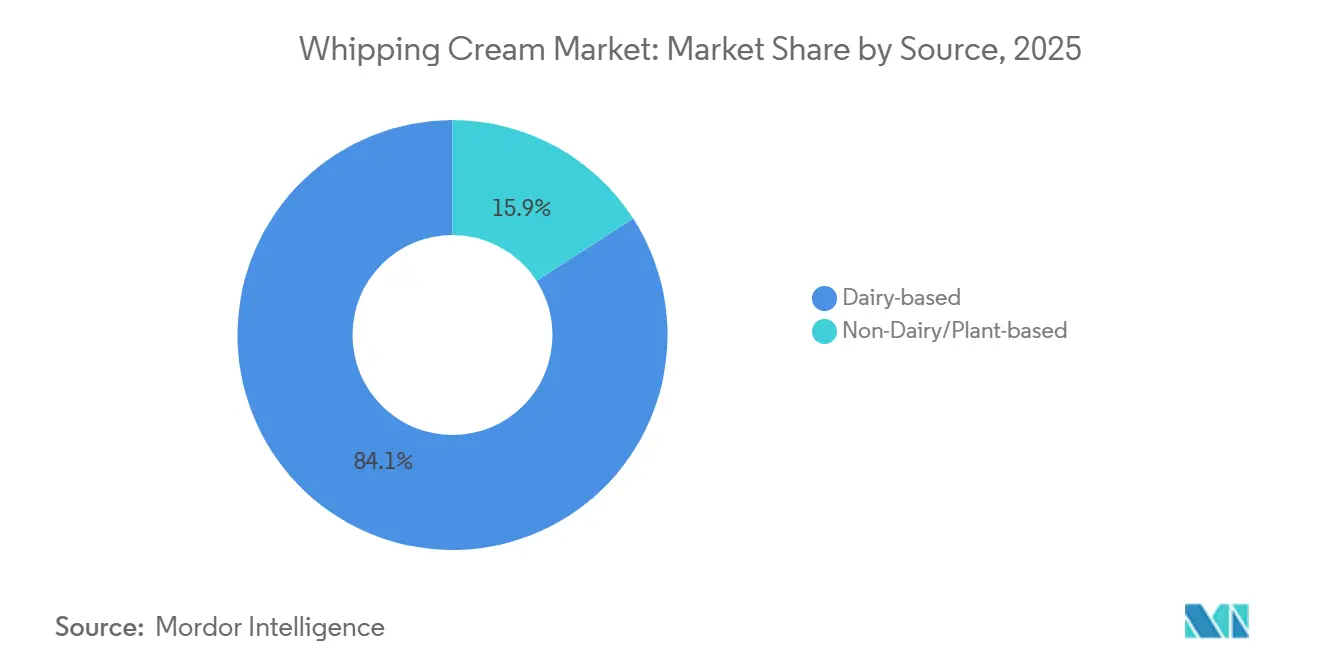
- By source, dairy cream commanded 84.11% of the whipping cream market share in 2025, while non-dairy alternatives are forecast for an 8.05% CAGR through 2031.
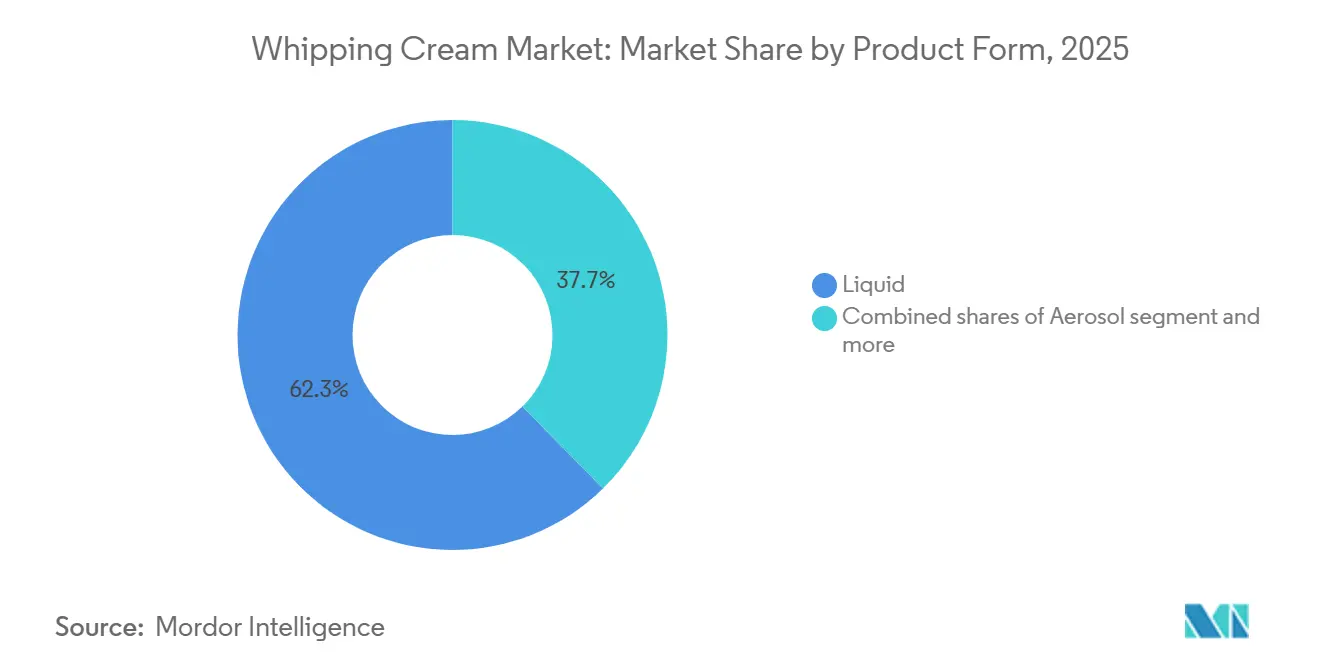
- By product form, liquid cream led with 62.34% of the whipping cream market share in 2025; aerosol formats are projected to advance at an 8.16% CAGR to 2031.
- By distribution channel, off-trade outlets held a 57.65% revenue share in 2025, whereas on-trade sales are poised to climb at a 7.86% CAGR as tourism and café culture rebound.
- By geography, Europe accounted for 26.73% of 2025 revenue, and the Middle East & Africa region is set to expand at an 8.24% CAGR through 2031.
Note: Market size and forecast figures in this report are generated using Mordor Intelligence’s proprietary estimation framework, updated with the latest available data and insights as of January 2026.
Market Trends and Insights
Drivers Impact Analysis of Whipping Cream Market*
| Driver | (~) % Impact on Market CAGR | Geographic Relevance | Impact Timeline |
|---|---|---|---|
| Growth in home baking and cooking trends | +1.5% | Global, with strongest uptake in Europe and North America | Medium term (2-4 years) |
| Expanding foodservice and café culture globally | +2.1% | Global, APAC (Asia-Pacific) and MEA (Middle East and Africa) accelerating | Long term (≥ 4 years) |
| Greater use in beverages and specialty coffees | +1.8% | North America, Europe, APAC urban centers | Medium term (2-4 years) |
| Rising popularity of plant-based cream alternatives | +1.2% | North America, Europe, APAC coastal cities | Long term (≥ 4 years) |
| Ease of purchase via online retail channels | +1.0% | Global, led by North America and China | Short term (≤ 2 years) |
| Premium dessert demand in tourism hubs | +0.9% | MEA, Europe, select APAC destinations | Medium term (2-4 years) |
| Source: Mordor Intelligence | |||
Rising Home-Baking Culture Drives Retail Demand
Pandemic-era lockdowns catalyzed a durable shift toward home baking, with Arla Foods reporting that 70% of Danes baked at home in 2024, sustaining demand for whipping cream in cakes, pastries, and mousse preparations. This behavior persists even as mobility restrictions are lifted, because consumers discovered cost savings and creative satisfaction in homemade desserts. Retailers responded by expanding shelf space for premium dairy ingredients, including heavy cream with 36% milkfat content that whips to stiffer peaks than standard formulations. The trend is most pronounced in Europe and North America, where baking culture is embedded, yet emerging middle classes in the Asia-Pacific are adopting Western dessert recipes, broadening the addressable market. Ingredient suppliers are launching smaller-format packaging, 250 ml and 500 ml cartons, to reduce waste for occasional bakers, a move that also raises per-unit margins.
Rising Popularity of Plant-Based Cream Alternatives
The plant-based segment in the whipping cream market demonstrates an 8.05% CAGR, attributed to increased consumer awareness regarding health and sustainability factors. According to the Good Food Institute, 59% of United States households purchased plant-based foods in 2024, with nearly 80% demonstrating repeat purchase behavior [1]. This market trend indicates sustained demand for dairy-free whipping alternatives, particularly plant-based creams derived from coconut, oat, or soy. Technological developments in plant-based formulations have enhanced the stability, texture, and whipping properties of these products to align with conventional dairy standards. The FDA issued draft guidance in January 2025 clarifying that plant-based products may use dairy terms if accompanied by the plant source, reducing regulatory uncertainty. This clarity enables brand investment in marketing and distribution, likely accelerating the 8.05% CAGR for non-dairy whipping cream through 2031. The segment's growth paradoxically benefits incumbent dairy processors, who are acquiring or launching plant-based lines to defend shelf space and capture flexitarian consumers.
Greater Use in Beverages and Specialty Coffees
Specialty coffee sales in the United States grew over two years and reached significant heights in 2024, with Nestlé investing USD 675 million in an Arizona factory to produce Coffee-mate creamers and launching a cold-foam line in January 2025, targeting consumers who crave whipped toppings on iced beverages. The cold-foam format, a lightly whipped cream that floats atop cold brew or iced lattes, has migrated from coffeehouse menus into retail channels, with three-flavor SKUs priced at USD 4.68 to USD 5.49 per 14-fluid-ounce bottle. This innovation extends whipping cream's use case beyond dessert finishing into daily beverage rituals, capturing incremental volume from consumers who previously added only milk or half-and-half. Arla partnered with Baileys to launch a 250 ml squirty whipped cream at Tesco in October 2024 for GBP 2.50 (USD 3.15), blending indulgence with convenience. These product forms lower the barrier to trial and encourage repeat purchase by eliminating the need for manual whipping equipment.
E-commerce Enabling Direct-to-Consumer Cream Brands
E-commerce expansion is driving changes in the whipping cream market as direct-to-consumer (DTC) brands establish distribution channels independent of traditional retail networks. Digital platforms enable companies to distribute specialized products, including organic, plant-based, and artisanal whipping cream variants, frequently packaged with complementary offerings. For instance, Straus Family Creamery in the United States exemplifies this business model by distributing organic whipping cream through its digital platform and premium online grocery retailers. The e-commerce distribution model supports subscription-based revenue streams, enhances inventory management, and provides small-batch manufacturers access to expanded markets. The increasing adoption of online grocery purchasing has positioned DTC as a key distribution channel in the premium and specialty whipping cream segment.
Restraints Impact Analysis of Whipping Cream Market*
| Restraint | % Impact on CAGR Forecast | Geographic Relevance | Impact Timeline |
|---|---|---|---|
| Health concerns over saturated fat and calorie content | -1.3% | Global, most acute in North America and Europe | Long term (≥ 4 years) |
| Raw-milk price volatility and supply shortfalls | -1.1% | Global, with regional spikes in Oceania and Europe | Short term (≤ 2 years) |
| Cold-chain infrastructure gaps | -0.8% | APAC emerging markets, MEA, South America | Medium term (2-4 years) |
| Intensifying competition from non-dairy toppings and whipped aerosols | -0.7% | North America, Europe, APAC urban centers | Medium term (2-4 years) |
| Source: Mordor Intelligence | |||
Health Concerns over Saturated Fat and Calorie Content
Rising consumer awareness about health risks associated with high-fat diets has created significant challenges for traditional whipping cream manufacturers, driving the development of healthier alternatives. Studies on hydrocolloids in whipping cream demonstrate that additives such as pectin and carrageenan enhance foaming properties while reducing lipid digestion rates. The incorporation of these hydrocolloids helps maintain product stability and texture while addressing health concerns. Carrageenan demonstrates superior effectiveness compared to pectin in decreasing lipid digestion, enabling the development of whipped cream products with improved nutritional profiles. These developments address consumer demand for products that combine indulgence with health benefits. Manufacturers are investing in research and development to create innovative formulations that maintain the desired taste and texture while reducing fat content. The market shows increasing acceptance of these modified whipping cream products, particularly among health-conscious consumers who seek alternatives to traditional dairy products.
Raw-milk Price Volatility and Supply Shortfalls
Dairy commodity markets exhibited sharp swings in 2024 and 2025. For instance, USDA data showed Class II butterfat prices in the U.S. Northeast declining from USD 2.85 per pound in January 2025 to USD 2.54 by March 2025, reflecting abundant domestic cream supply. These regional divergences complicate procurement for multinational processors and create margin compression when input costs spike faster than retail prices can adjust. The Big-7 dairy exporters, New Zealand, the European Union, the United States, Australia, Argentina, Uruguay, and Brazil, are forecast to increase milk supply by only 1.6% in 2025 and 0.6% in 2026, constraining the raw-material base for cream production. Smaller processors lacking futures-market hedging or long-term supply contracts face heightened risk of margin erosion or supply interruptions.
*Our forecasts treat driver/restraint impacts as directional, not additive. The impact forecasts reflect baseline growth, mix effects, and variable interactions.
Whipping Cream Market Segment Analysis
By Source:
Dairy Dominance Faces Plant-Based DisruptionDairy-based whipping cream captured 84.11% of market revenue in 2025, underpinned by established supply chains, consumer familiarity, and superior whipping performance derived from butterfat's crystallization properties. However, non-dairy and plant-based alternatives are expanding at an 8.05% CAGR through 2031, the fastest rate among source segments, as formulators close the gap on taste and texture. The FDA's January 2025 draft guidance clarifying that plant-based products may use dairy terminology if accompanied by the plant source reduces regulatory friction and enables brand investment.
Dairy processors are responding by acquiring or launching plant-based lines to defend shelf space. Fonterra's USD 88 million UHT cream plant at Edendale, which began production in August 2026 with 50 million litres of annual capacity doubling to 100 million by 2030, signals confidence that dairy demand will persist even as alternatives grow. Non-dairy entrants such as Califia Farms are deploying coconut, oat, and almond bases with hydrocolloids to replicate dairy's mouthfeel, capturing flexitarian consumers who oscillate between dairy and plant-based depending on use occasion. This bifurcation suggests that the 84.11% dairy share in 2025 will erode gradually rather than collapse, as both segments coexist and serve distinct consumer needs.
By Product Form:
Aerosol Gains Ground on ConvenienceLiquid whipping cream held 62.34% of the market share in 2025, favored by professional bakers and baristas for its versatility and ability to achieve precise textures through manual or mechanical whipping. Yet aerosol formats are growing at 8.16% CAGR through 2031, driven by single-serve convenience and impulse purchases. Whipnotic's flavored aerosol line, featuring a patented nozzle, expanded to over 1,000 retail locations in 2024 and posted 150% quarterly revenue growth by targeting consumers who want dessert finishing without equipment or cleanup. Nestlé launched Coffee-mate Cold Foam in January 2025, offering three flavors in 14-fluid-ounce bottles priced at USD 4.68 to USD 5.49, aimed at the one-in-five coffee drinkers who crave whipped toppings on iced beverages.
The "Others" category, encompassing powdered and frozen formats, serves niche applications such as industrial baking and long-haul foodservice where refrigeration is constrained. Powdered cream offers extended shelf life and reduced freight costs due to lower weight, yet reconstitution adds labor and the final texture rarely matches fresh liquid or aerosol. Frozen whipped cream is used in pre-portioned desserts and institutional catering, where consistency and portion control outweigh the premium mouthfeel of fresh-whipped dairy. Liquid cream's 62.34% share reflects its entrenched position in professional kitchens and home baking, yet aerosol's 8.16% CAGR indicates that convenience-driven formats will capture incremental volume from consumers who prioritize speed and single-serve packaging over artisanal preparation.

By Distribution Channel:
On-Trade Growth Outpaces Retail ExpansionThe off-trade segment dominates the whipping cream market with a 57.65% share in 2025. This segment includes supermarkets, hypermarkets, convenience stores, and online platforms. Online stores show notable growth, driven by e-commerce expansion and increasing direct-to-consumer sales in the dairy industry. The convenience and accessibility of online shopping, combined with improved cold chain logistics for dairy products, contribute to this growth. Supermarkets and hypermarkets maintain their position as the largest sub-segment through established cold chain infrastructure, diverse product offerings, and the ability to provide competitive pricing through bulk purchasing.
The on-trade segment demonstrates robust growth at a 7.86% CAGR (2026-2031), exceeding overall market growth rates. This expansion stems from the growth of food service chains in emerging markets and the increased inclusion of premium desserts in restaurant menus. The rising consumer preference for dining out, the growth in café culture, and the expansion of bakery chains further drive this segment's growth. For instance, in the United States, 55% of consumers preferred dining at restaurants over ordering takeout or delivery in 2023, according to US Foods Inc [2]. The segment presents opportunities for specialized whipping cream products tailored to food service requirements, focusing on stability and performance in commercial settings. These products often feature enhanced heat resistance, longer holding times, and consistent whipping performance. The distinct growth patterns between off-trade and on-trade segments emphasize the need for targeted product development and marketing approaches by manufacturers, including packaging solutions, product formulations, and distribution strategies specific to each channel.
Geography Analysis
Europe Whipping Cream Market
Europe commanded 26.73% of whipping cream revenue in 2025, anchored by mature baking traditions, dense coffeehouse networks, and strong per-capita dairy consumption. Germany, France, the United Kingdom, Italy, and Spain represent the largest country markets, where whipping cream is a staple in patisserie, café beverages, and home dessert preparation. Smaller markets such as Poland, Belgium, Sweden, and the Netherlands contribute incremental volume, with Poland benefiting from rising disposable incomes and Belgium from its artisanal chocolate and dessert culture. Europe's established cold-chain infrastructure and stringent food-safety standards under the European Food Safety Authority (EFSA) enable efficient distribution and long shelf life, supporting the region's leadership position.
North America Whipping Cream Market
North America is the second-largest geography, driven by the United States' foodservice sector and Canada's robust dairy industry. U.S. Class II butterfat prices declined from USD 2.85 per pound in January 2025 to USD 2.54 by March 2025 in the Northeast, reflecting abundant domestic cream supply that benefits processors and pressures farmgate prices, according to the USDA AMS. Mexico's growing middle class and expanding café culture add incremental volume, though cold-chain gaps in rural areas constrain penetration. Canada's dairy supply management system stabilizes farmgate prices but limits export competitiveness, focusing processors on domestic and niche premium segments. North America's regulatory environment under the FDA and USDA ensures product safety and labeling clarity, with the FDA's December 2024 finalization of a "healthy" claim rule tightening saturated-fat thresholds effective 2028.
MEA Whipping Cream Market
The Middle East and Africa region is expanding at an 8.24% CAGR through 2031, the fastest rate among geographies, propelled by tourism infrastructure in Gulf Cooperation Council states, expatriate demand, and retail modernization. The United Arab Emirates imported USD 1.6 billion of dairy products in 2020, with milk and cream accounting for 43% (USD 669 million), underscoring reliance on imports to meet consumption. Saudi Arabia is the fastest-growing market within MEA, driven by Vision 2030 initiatives that are expanding hospitality capacity and liberalizing the entertainment sectors. High-end hotels and restaurants in Dubai, Riyadh, and Doha stock premium whipping cream for plated desserts and specialty coffees that command USD 10 to USD 15 per item, margins that justify airfreight of chilled dairy from Europe or Oceania when local supply is insufficient. According to the World Tourism Organization (UN Tourism), the UAE and Saudi Arabia recorded the highest international tourist arrivals among Middle Eastern countries, with 28.15 million and 27.4 million visitors respectively in 2023 [3].
Regulatory Landscape
Whipping cream is subject to dairy standards of identity, hygiene rules, and labeling requirements that vary by market, but align on compositional definitions and heat-treatment controls. In the United States, FDA standards of identity in 21 CFR Part 131 define cream categories (including light whipping cream at 30% to less than 36% milkfat) and link naming to compliance, which shapes formulation and claims for both retail and foodservice packs. In the European Union, hygiene requirements under Regulation (EC) No 853/2004 are complemented by updates such as Commission Delegated Regulation (EU) 2024/1141 (April 2024), which added alternative HACCP-based options for verifying dairy heat treatment beyond single-test reliance, affecting plant QA protocols for pasteurized and UHT cream.
For plant-based whipping alternatives sold alongside dairy, labeling clarity is a competitive factor. The FDA issued draft guidance in January 2025 on plant-based labeling that permits dairy terms when accompanied by the plant source, reducing uncertainty for marketing and shelf placement of coconut, oat, and soy whipping products. In China, GB 19646-2025 for cream, butter, and anhydrous milk fat was released on March 27, 2025 and entered into force on March 16, 2026, requiring exporters and domestic producers to align product safety and labeling to the updated national standard. Broader food traceability requirements also raise compliance expectations, with the FDA FSMA Final Rule on additional traceability records finalized in July 2026, increasing documentation needs for supply chain participants handling perishable dairy ingredients.
Value Chain Analysis
The whipping cream value chain begins with raw milk supply from dairy farms and cooperatives, followed by collection and chilled transport to processing sites for centrifugal separation, fat standardization, and heat treatment (pasteurization or UHT) before packaging and distribution. Large, integrated dairy groups and cooperatives (including Fonterra, Land O'Lakes, and Lactalis) take a leading role because they can coordinate milk pooling, quality testing, and continuous processing to meet the microbiological and functional specifications required for whipping performance. UHT and aseptic capability is a key structural lever, extending shelf life and supporting export-oriented flows, illustrated by Fonterra commissioning an additional UHT cream production footprint at Edendale (USD 88 million) with 50 million litres of annual capacity at startup.
Downstream, the chain splits between off-trade retail (supermarkets/hypermarkets, convenience, specialists, and online) and on-trade (cafes, bakeries, restaurants, and hotels), each with different pack sizes, performance requirements, and service levels. Cold-chain logistics remains a bottleneck for liquid formats, with transport capacity, fuel costs, and labor availability affecting delivery consistency and shrink. Processors increasingly use route optimization and scheduling tools to improve on-time performance for time-temperature-sensitive loads. Sustainability programs are also reshaping supplier relationships and procurement, with initiatives such as Danone's Milk Academy (training with Wageningen University and Cornell University) and Nestle's partnership with the World Farmers Organisation focused on building farmer capability and data-sharing to support longer-term supply continuity and farm-level practice changes.
Competitive Landscape
The whipping cream market demonstrates moderate consolidation, with established dairy companies and regional manufacturers operating in the industry. Companies such as Fonterra Co-operative Group, Arla Foods, Nestlé S.A., Land O’Lakes, and FrieslandCampina hold significant market positions through their extensive distribution networks and diverse product portfolios. These companies prioritize product innovation through the development of new flavors, textures, and functional properties.
Major market players focus on sustainability initiatives that encompass responsible sourcing, reduced packaging waste, and lower carbon emissions. Their market expansion efforts target the Asia-Pacific and Middle East and Africa regions, where rising disposable incomes and changing consumer preferences drive demand. Companies are also investing in research and development to improve product quality, enhance production efficiency, and meet evolving consumer preferences for healthier options.
The market's competitive landscape is transforming as plant-based manufacturers and technology-focused startups challenge traditional dairy producers. New entrants differentiate themselves through alternative ingredients, clean-label formulations, and innovative packaging solutions. Companies are investing in advanced processing technologies to improve product stability, extend shelf life, and enhance environmental sustainability. These technological investments include ultra-high temperature processing, aseptic packaging systems, and automated quality control measures, making technological capabilities an important competitive advantage in the market.
Whipping Cream Industry Leaders
-
Fonterra Co-operative Group
-
Arla Foods AMBA
-
Land O’Lakes
-
FrieslandCampina N.V.
-
Nestlé S.A.
- *Disclaimer: Major Players sorted in no particular order
Whipping Cream Market Companies Covered in this Report
- Arla Foods amba
- Fonterra Co-operative Group
- Land O’Lakes, Inc.
- FrieslandCampina N.V.
- Nestlé S.A.
- Conagra Brands Inc.
- Rich Products Corporation
- Lactalis Group
- Saputo Inc.
- Danone S.A.
- Morinaga Milk Industry Co. Ltd
- Tatua Co-operative Dairy Company Ltd
- Gay Lea Foods Co-operative Ltd
- Califia Farms LLC
- Megmilk Snow Brand Co. Ltd
- Tropilite Foods Pvt Ltd
- Granarolo S.p.A.
- Hanan Products Company Inc.
- Wilton Brands LLC
- PT Greenfields
Market Opportunities and Future Outlook
Product differentiation is moving beyond traditional heavy cream into functional and dietary-led variants that still deliver stable foam and convenient use in beverages and desserts. A clearer whitespace is lactose-free and sweetened solutions designed for foodservice and at-home toppings, highlighted by Milram (DMK Group) debuting a sweetened lactose-free whipped cream at Horecava in Amsterdam in January 2026. At the same time, plant-based whipping creams are gaining shelf space as FDA draft guidance (January 2025) clarified labeling conventions for plant-based products using dairy terms when paired with the plant source, supporting brand investment in packaging, merchandising, and distribution across retail and e-commerce.
Supply-side investments are also shifting where cream can be manufactured and shipped profitably, particularly for long-distance and export-driven demand centers. Fonterra's Edendale UHT cream expansion (USD 88 million; designed for 50 million litres annually by August 2026, with expansion to 100 million litres by 2030) points to demand for shelf-stable cream that reduces reliance on refrigerated transit while supporting bakery and beverage applications. Technical work on UHT and alternative-protein whipping performance also creates room for formulation and process innovation, because UHT can impair foam properties and stability, pushing manufacturers to improve emulsifier systems, protein functionality, and processing controls so extended-life products still achieve professional-grade whipping outcomes.
Recent Industry Developments in Whipping Cream Market
- May 2026: Fonterra launched Anchor Essence Cream at Bakery China 2026 in Shanghai, positioning the product for professional bakery and foodservice use. The launch also introduced FernMark Grass-Fed branding for a New Zealand dairy cream product, supporting premium positioning and provenance-led differentiation in export channels.
- October 2025: Arla Foods, in partnership with Diageo, launched Baileys Extra Thick Chocolate Cream in the United Kingdom. Extending the Baileys-branded cream range reinforced licensed indulgence cues in chilled dairy and helped Arla compete for seasonal and dessert-led usage occasions in retail.
- November 2024: Arla Foods rolled out Baileys Squirty Cream and Baileys Espresso Extra Thick Cream in UK retail. The mix of aerosol convenience and thicker spoonable formats broadened consumption occasions from dessert finishing to coffee and at-home treats, strengthening brand-led value growth in mature cream aisles.
Whipping Cream Market Report Scope and Research Methodology
Market Definition and Coverage
For this study, the market covers sales of whipping cream products that are intended to be whipped into foam and used across home cooking, bakery, desserts, beverages, and foodservice. The value is captured at the product sales level across key consuming regions.
Scope exclusions: Excludes low fat table cream, cooking cream that is positioned mainly for sauces, and bulk butterfat traded only for industrial re-processing.
Segments Covered in This Report
- Source
- Dairy-based
- Non-Dairy/Plant-based
- Product Form
- Liquid
- Aerosol
- Others
- Distribution Channel
- Off-Trade
- Supermarkets/Hypermarkets
- Convenience Stores
- Specialist Retailers
- Online Stores
- Other Distribution Channels
- On-Trade
- Off-Trade
- Geography
- North America
- United States
- Canada
- Mexico
- Rest of North America
- Europe
- Germany
- United Kingdom
- Italy
- France
- Spain
- Netherlands
- Poland
- Belgium
- Sweden
- Rest of Europe
- Asia-Pacific
- China
- India
- Japan
- Australia
- Indonesia
- South Korea
- Thailand
- Singapore
- Rest of Asia-Pacific
- South America
- Brazil
- Argentina
- Colombia
- Chile
- Peru
- Rest of South America
- Middle East and Africa
- South Africa
- Saudi Arabia
- United Arab Emirates
- Nigeria
- Egypt
- Morocco
- Turkey
- Rest of Middle East and Africa
- North America
Data Sources, Market Sizing, and Validation
Desk Research
Desk work started by building a demand context for whipping cream, then narrowing to products sold specifically for whipping use. We referenced public sources such as USDA dairy outlook and price series, Eurostat dairy production data, FAOSTAT milk and dairy supply statistics, UN Comtrade trade flows for dairy fats and cream, and Codex or national food standards that define dairy fat ranges and labeling.
We also reviewed company annual reports, investor decks, and press releases to track product mix shifts, including aerosol formats and plant-based whipping alternatives. Alongside this, we used paid subscriptions for company financials and intelligence, plus news and financials, to cross-check revenue direction, footprint changes, and capacity announcements that can move supply. The sources listed here are not exhaustive, and we used additional public references during data collection, validation, and clarification.
Primary Interviews and Surveys
Primary work focused on validating what gets counted as whipping cream in real purchase behavior, and how pricing changes across retail and foodservice channels. We spoke with dairy processors, ingredient distributors, foodservice buyers, and category managers across APAC, EMEA, and the Americas to confirm fat-content norms, pack sizes, seasonal demand peaks, and typical trade margins. These inputs helped us adjust assumptions that public data alone could not fully verify.
Distribution of primary research fieldwork respondents
| Company type | Respondent position | Region |
|---|---|---|
| Top tier: 33% | CXOs: 18% | APAC: 49% |
| Mid tier: 46% | Functional/Unit leaders: 39% | EMEA: 30% |
| Smaller Players: 21% | Managers: 43% | Americas: 21% |
Market-Sizing & Forecasting
Sizing was built using a top down approach where dairy production and trade data were used to reconstruct the available cream and dairy fat pool, which was then filtered through the portion typically sold and consumed as whipping cream. The model was checked with selective bottom up approximations, including sampled supplier revenues, channel checks on retail and foodservice splits, and volume-by-price sanity checks on common pack formats. Adjustments were made only when checks indicated persistent gaps.
Key inputs included dairy fat availability and cream production indicators, import and export movements for cream and related dairy fat categories, retail price and foodservice price direction, and seasonality around bakery and holiday demand. We also accounted for adoption of aerosol and plant-based whipping products where they are sold as whipping solutions. For forecasting, we used scenario analysis based on expert views on milk price cycles, consumer trading behavior, and the pace of foodservice recovery in major cities. Where bottom up signals were missing for smaller countries, we used proxy ratios from comparable markets and then re-validated the implied per-capita demand using interview feedback.
Data Validation & Update Cycle
Validation was handled through multiple cross-checks to keep the final numbers aligned to visible market signals. We compared outputs against independent indicators such as dairy fat price movements, regional cream supply tightness, and trade direction shifts, and then investigated outliers before sign-off.
A second analyst review tested key assumptions, including the share of cream used for whipping and the implied average selling price path by channel. If results moved sharply due to a new regulation, a supply disruption, or a large capacity change, we re-contacted experts to confirm the impact. Reports are refreshed annually, with interim updates when material events occur, and a final pre-delivery review is completed so clients receive the most current view.
Mordor Intelligence's Whipping Cream Market Sizing Compared With Other Published Estimates
It is common to see different market sizes for whipping cream because each publisher draws the line around the product differently, and they also select different years and pricing assumptions. Variations also come from whether the estimate leans more on production-side signals or more on consumption-side demand, and how frequently inputs are refreshed.
Some published figures treat whipped toppings and premix formats as part of the same market, and they may count broader cream products beyond items sold mainly for whipping. In the Mordor Intelligence model, only products positioned and purchased for whipping use are counted, while cooking creams and table creams are kept out. This tighter scope narrows the demand pool and reduces double counting when dairy fat is re-routed into other categories.
Benchmark comparison
| Source | Market Size | Gaps in Research Methodology |
|---|---|---|
| Mordor Intelligence | USD 9.09 B (2026) | |
| Global Consultancy A | USD 9.15 B (2024) | Uses an earlier base year and a broader definition that explicitly includes non-dairy whipping creams, and the value can shift depending on how retail versus foodservice pricing is averaged in 2024. |
| Industry Publisher B | USD 8.30 B (2024) | Counts source and type buckets like premix, and the total can change based on how related whipped topping products are grouped and how long-range inflation is applied from a 2024 starting point. |
The spread across the table is mostly explained by scope choices and timing, not by one single math step. Once the definition is kept tight to whipping-intended products and the value is checked against supply, trade, and price signals, the result is easier to replicate and to stress-test when assumptions such as dairy fat prices or seasonal demand shift.
Key Questions Answered in the Report
How large is the global whipping cream market in 2026?
The whipping cream market size reached USD 9.09 billion in 2026 and is set to climb to USD 12.21 billion by 2031.
What is the expected growth rate for whipping cream to 2031?
The market is forecast to post a 6.07% CAGR between 2026 and 2031.
Which product form is growing fastest within whipping cream?
Aerosol whipping cream is projected to expand at an 8.16% CAGR through 2031, outpacing liquid formats.
Which region shows the highest future growth for whipping cream?
The Middle East & Africa region is expected to register an 8.24% CAGR due to tourism-led foodservice demand.