Wheat Seed Market Size and Share
Market Overview
| Study Period | 2017 - 2030 |
|---|---|
| Market Size (2025) | USD 6.36 Billion |
| Market Size (2030) | USD 8.38 Billion |
| Growth Rate (2025 - 2030) | 5.65% CAGR |
| Fastest Growing Market | South America |
| Largest Market | Europe |
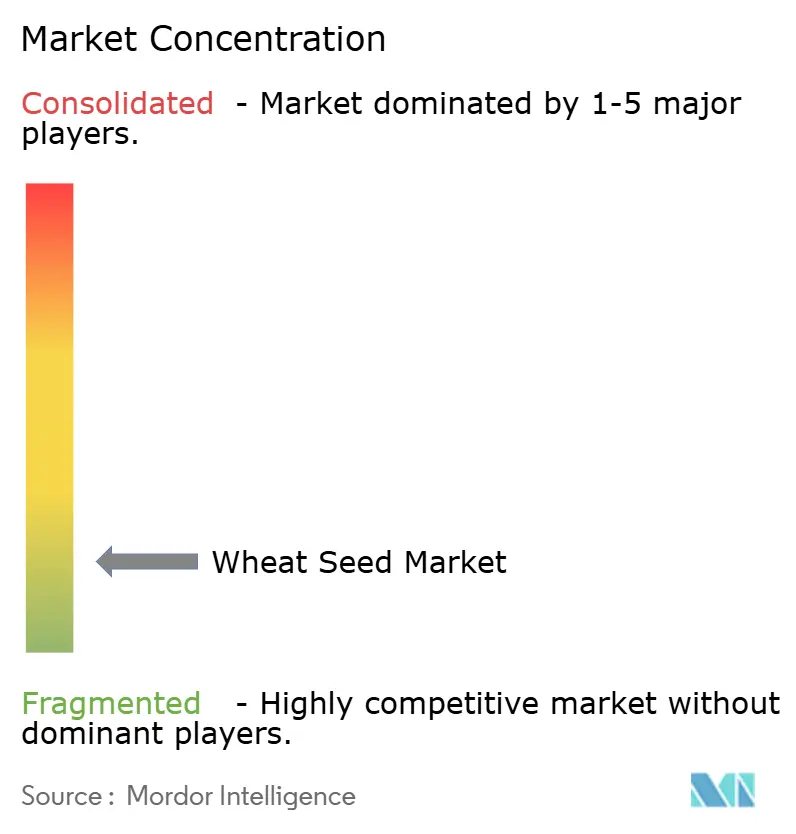
| Market Concentration | Low |
Major Players
*Disclaimer: Major Players sorted in no particular order Image © Mordor Intelligence. Reuse requires attribution under CC BY 4.0. |
|

Wheat Seed Market Analysis by Mordor Intelligence
The wheat seed market size is USD 6.36 billion in 2025 and is forecast to reach USD 8.38 billion by 2030, advancing at a 5.65% CAGR over 2025-2030. Surging demand for climate-resilient cultivars, rising adoption of seed-treatment coatings, and government procurement programs that reward certified seed use are the primary forces driving value growth. Corporate breeding pipelines are converging genomic selection, high-throughput phenotyping, and Clustered Regularly Interspaced Short Palindromic Repeats (CRISPR) gene editing to shorten variety-development cycles, allowing faster responses to emerging abiotic and biotic stress factors. Europe commands the largest share due to stringent varietal certification rules, well-funded public breeding, and farmers' willingness to replace seed every season. South America records the fastest regional expansion as Argentina and Brazil scale tropical wheat acreage and commercialize drought-tolerant hybrids. Although open-pollinated varieties still dominate in planted area, hybrids capture disproportionate value because they deliver reliable yield premiums in mechanized farming systems and offer companies defensible intellectual-property positions. Competitive intensity remains high because thousands of regional breeders service localized adaptation niches; nevertheless, accelerating consolidation is projected as global players leverage technology platforms to acquire smaller firms and broaden germ-plasm pools.
Key Report Takeaways
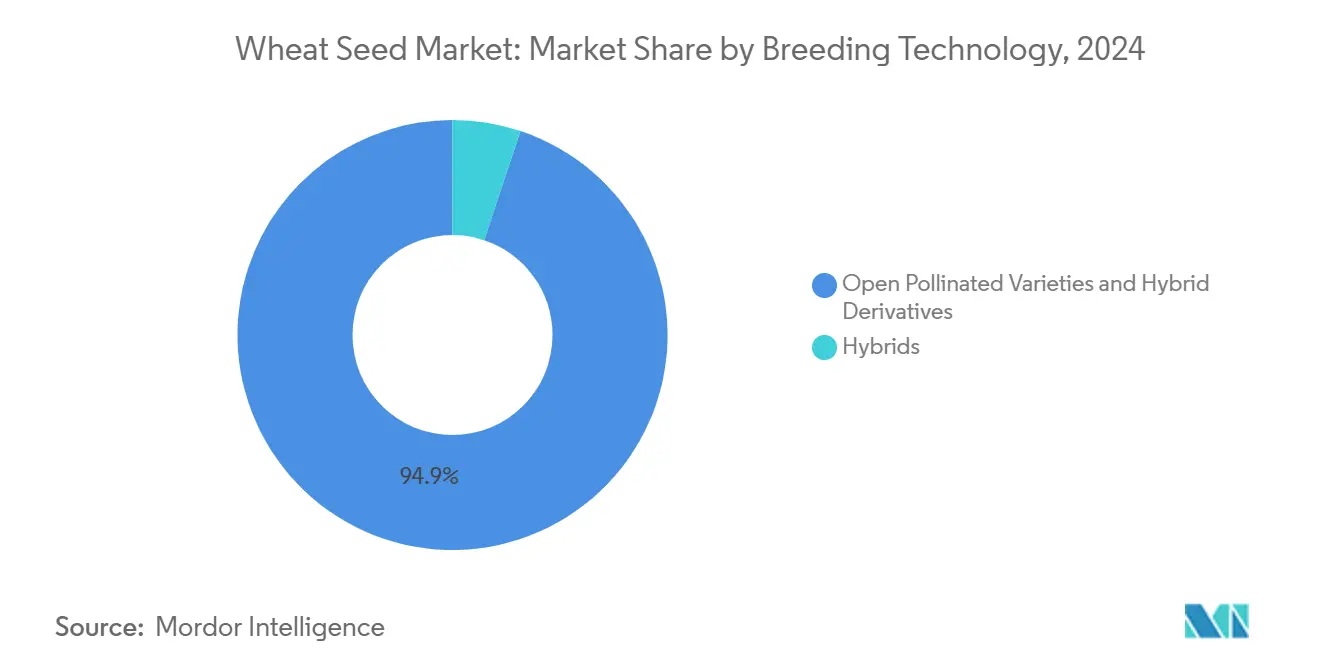
- By breeding technology, the Open-pollinated varieties accounted for 94.9% of the wheat seed market share in 2024, and the hybrids are projected to expand at a 6.6% CAGR to 2030.
- By geography, Europe led the wheat seed market with 44.9% revenue share in 2024, while South America is forecast to post the fastest 8.2% CAGR through 2030.
Global Wheat Seed Market Trends and Insights
Drivers Impact Analysis
| Driver | (~) % Impact on CAGR Forecast | Geographic Relevance | Impact Timeline |
|---|---|---|---|
| Accelerated varietal turnover in emerging economies | +1.2% | Asia-Pacific, Africa, South America | Medium term (2-4 years) |
| Rising government minimum-support prices and input subsidies | +0.9% | Global, concentrated in India, Pakistan, Nigeria | Short term (≤ 2 years) |
| Expansion of seed-treatment adoption boosting premium seed demand | +0.7% | Global, led by North America and Europe | Medium term (2-4 years) |
| Corporate pivot toward hybridization platforms (CRISPR-enabled) | +1.1% | Global, early adoption in North America and Europe | Long term (≥ 4 years) |
| Climate-resilience mandates from multilateral lenders | +0.8% | Africa, Asia-Pacific, South America | Long term (≥ 4 years) |
| Digital seed-traceability platforms linking growers to buyers | +0.4% | Global, pilot programs in developed markets | Medium term (2-4 years) |
| Source: Mordor Intelligence | |||
Accelerated Varietal Turnover in Emerging Economies
Farmers in India, Pakistan, Ethiopia, and Nigeria are switching varieties every one to two seasons rather than the traditional three-year cycle after state extension programs subsidized certified seed costs by 40% in 2024[1]Source: Ministry of Agriculture and Farmers Welfare, “Seeds Division Annual Report,” Government of India, agricoop.nic.in. Certified seed volumes distributed by India’s National Seeds Corporation rose 23% year on year, and similar growth rates were reported by private distributors in Ethiopia. Faster turnover drives recurring revenue for breeders because farmers rely less on farm-saved grain that suffers from genetic drift and disease buildup. The phenomenon is most visible in irrigated and medium-large holdings where yield risk tolerance is lower and cash flow allows up-front investment. Companies that can deliver localized disease-resistance packages are well placed to capture this structural demand shift across the wheat seed market.
Expansion of Seed-Treatment Adoption Boosting Premium Seed Demand
Bundled insecticidal and fungicidal coatings convert commodity seed into a higher-margin product category that commands 15-25% price premiums. Bayer AG recorded EUR 1.2 billion (USD 1.3 billion) in seed-treatment revenue during 2024, with wheat accounting for 18% of sales. Adoption is responding to heightened soil-borne disease pressure linked to erratic rainfall patterns, making treatments a compelling form of biological insurance. The practice is spreading from intensive North American and European systems to South American export farms and irrigated tracts in Northern China. Breeders that align variety releases with proprietary coating chemistries strengthen brand stickiness and create cross-selling synergies within the wheat seed market.
Corporate Pivot Toward Hybridization Platforms (CRISPR-Enabled)
Corteva Agriscience allocated USD 180 million to hybrid wheat programs in 2024 that incorporate CRISPR-modified restorers, improving pollen fertility and enabling commercial-scale seed production. BASF SE and Groupe Limagrain have taken similar steps, signaling industry consensus that heterosis premiums outweigh development complexity. Yield advantages of 8-15% over open-pollinated checks have been consistently validated in multiyear trials across Argentina, Germany, and the United States. Patent portfolios around cytoplasmic male sterility (CMS) and fertility-restoration genes provide legal defensibility, encouraging continued capital allocation. Hybrids thus emerge as the main value-growth lever despite composing a modest share of planted hectares.
Climate-Resilience Mandates From Multilateral Lenders
The World Bank earmarked USD 2.4 billion for climate-smart agriculture projects in 2024, stipulating that funded wheat acreage must use certified drought- or heat-tolerant cultivars[2]Source: World Bank, “Climate Change Action Plan 2021-2025,” The World Bank Group, worldbank.org. In Sub-Saharan Africa, more than 1.1 million hectares were planted with new stress-tolerant lines supplied through donor channels, representing a 37% jump over 2023. Similar mandates in Bangladesh and Nepal tie concessional loans to the adoption of varieties verified for temperature resilience. These policy-linked guarantees de-risk breeder investment by creating a predictable demand for advanced germ-plasm. Over the next decade, they are projected to add nearly one percentage point to volume growth in the wheat seed market.
Restraint Impact Analysis
| Restraint | (~) % Impact on CAGR Forecast | Geographic Relevance | Impact Timeline |
|---|---|---|---|
| Farmer distrust toward patented hybrid royalty clauses | -0.80% | Global, concentrated in developing markets | Medium term (2-4 years) |
| Regulatory uncertainty on gene-edited traits (non-transgenic) | -0.60% | Global, particularly Europe and Asia-Pacific | Long term (≥ 4 years) |
| Rising on-farm seed-saving in price-sensitive regions | -0.90% | Africa, Asia-Pacific, South America | Short term (≤ 2 years) |
| Supply-chain bottlenecks for early-generation breeder seed | -0.40% | Global, acute in developing markets | Medium term (2-4 years) |
| Source: Mordor Intelligence | |||
Farmer Distrust Toward Patented Hybrid Royalty Clauses
In markets where grain prices fluctuate sharply, many growers perceive subscription-style royalties as eroding margin security. Legal disputes in Argentina over royalty enforcement grew 34% in 2024, and farmer associations in Kenya threatened boycotts of hybrid offerings carrying annual technology fees[3]Source: Argentine Federation of Agricultural Cooperatives, “Agricultural Technology Adoption Report,” coninagro.org.ar. When enforcement mechanisms appear heavy-handed, farmers revert to uncertified grain for planting, reducing hybrid penetration. Breeders attempt to mitigate resistance through deferred-payment schemes and local demonstration plots; yet uptake remains sensitive to perceived fairness. The barrier could subtract nearly one percentage point from anticipated hybrid volume growth across the wheat seed market unless royalty models evolve.
Regulatory Uncertainty on Gene-Edited Traits (Non-Transgenic)
The European Commission has yet to publish final guidelines governing the commercialization of CRISPR-edited wheat, extending approval timelines by around two years[4]Source: European Commission, “New Techniques in Biotechnology Consultation,” food.ec.europa.eu. China’s similar draft framework remains under consultation, creating parallel caution among domestic seed companies. Developers must therefore maintain separate pipelines and data packages for markets with restrictive or ambiguous rules, elevating overhead costs. Given wheat’s thin seed margins compared with high-value crops like maize, small and midsize breeders particularly struggle to absorb the compliance burden. Although regulatory clarity is projected by 2027, near-term hesitation curtails launch momentum for several gene-edited lines that feature enhanced nutrient-use efficiency and abiotic-stress tolerance.
Segment Analysis
By Breeding Technology: Hybrid Premium Gains Traction
Open-pollinated cultivars held 94.9% of the wheat seed market share in 2024, but hybrid varieties are expanding faster than any other category at a 6.6% CAGR from 2025 to 2030. Hybrids already generate 12% of the overall wheat seed market size in Western Europe and North America, where farmers value their reliable 8-15% yield edge, and are set to exceed 15% by 2030. Germ-plasm gains made possible through CMS systems and CRISPR-enabled restorer genes reduce the historical penalty of producing commercial hybrid seed at scale. Companies integrate genomic selection, doubled-haploid acceleration, and predictive analytics to shorten breeding cycles to five years, down from eight years a decade earlier. Constant releases create portfolio freshness and keep royalty streams flowing, a critical factor in sustaining research budgets across the wheat seed industry.
Despite robust premiums, hybrids face mechanical isolation demands that challenge smallholders who mix wheat with other cereals, thus constraining volume penetration in fragmented Asian and African landscapes. Multinational breeders partner with national institutes to supply hybrid parental lines while local multipliers handle seed production, aligning genetic innovation with low-cost labor advantages. In Argentina, early commercial plantings demonstrated net revenue gains of USD 140 per hectare versus conventional checks, underscoring economics that justify double-digit price premiums. Over the forecast horizon, hybrid development is projected to elevate the total wheat seed market size by USD 800 million, with ancillary growth in seed-treatment and crop-input bundle.
Note: Segment shares of all individual segments available upon report purchase
Geography Analysis
Europe retained 44.9% of the wheat seed market size in 2024 because farmers routinely replace seed each season and stringent varietal-quality standards require high genetic purity. France, Germany, and Poland account for one of the largest regional values owing to irrigated high-yield environments that make seed innovation pay. The European Commission’s evolving stance on New Genomic Techniques is likely to catalyze the adoption of gene-edited lines that bypass transgenic classification, reinforcing Europe’s preeminence in premium segments.
South America is projecting the fastest 8.2% CAGR, led by Argentina’s 12% acreage expansion and Brazil’s success with tropical wheat. Argentina’s Ministry of Agriculture confirmed 6.2 million hectares sown in 2024, the highest in a decade, helped by export incentives and new drought-tolerant cultivars. Brazilian Agricultural Research Corporation trials in Cerrado regions achieved yields above 6 metric tons per hectare, more than double historical averages. Currency weakness against the United States Dollar makes export wheat more competitive, encouraging investment in certified seeds that boost output. The wheat seed market share of South America is projected to climb from 11% in 2024 to 14% by 2030.
Asia-Pacific remains heterogeneous. China pursues hybrid demonstration farms in Hebei and Henan provinces; India leans on public breeding to supply rust-resistant open-pollinated lines; Pakistan integrates private genetics through state distribution channels. Africa’s seed systems rely heavily on donor funding and public-private partnerships to disseminate heat-tolerant cultivars. North America maintains stable volume, but hybrid adoption and seed-treatment bundling raise average selling prices, contributing to modest revenue growth.

Competitive Landscape
The wheat seed market is fragmented; the top five players, BASF SE, Groupe Limagrain, Corteva Agriscience, KWS SAAT SE & Co. KGaA, and Syngenta AG, collectively hold a significant share of global revenue. BASF SE leverages integrated crop-science platforms linking fungicidal seed coatings with drought-tolerant genetics. Groupe Limagrain strategizes through farmer cooperative roots and owns winter-wheat leadership across Europe, while Corteva Agriscience channels cash flows from maize hybrids to fund wheat CRISPR programs. KWS SAAT SE & Co. KGaA targets premium bread-wheat classes in high-latitude geographies and entered South Asia via a joint venture with Kaveri Seeds in 2024.
Patent activity signals intensifying technology competition: biotechnology patents mentioning wheat rose 28% in 2024, with CRISPR claims forming 35% of United States Patent and Trademark Office filings. Many midsize regional breeders cannot sustain the regulatory burden of multi-market launches and thus seek licensing or acquisition deals. Private-equity funds have begun assembling roll-ups of local companies to create platforms attractive to strategic buyers. Market concentration is therefore set to rise modestly but will remain well below crops like maize because wheat’s self-pollinated biology favors regional specialization.
Emerging disruptors include startup Enko Chem, which applies machine-learning to discover novel herbicide tolerance genes, and Trait-Agro, which offers gene-edited disease-immunity modules under a licensing model that bypasses physical seed production. Digital platforms such as Ag-Verify provide blockchain tagging of breeder seed lots, promising traceability that unlocks premiums without major logistics investment. Collaborative breeding consortia among universities, public institutes, and companies continue to play a crucial role in disease resistance and abiotic-stress trait discovery.
Wheat Seed Industry Leaders
-
BASF SE
-
Corteva Agriscience
-
Florimond Desprez
-
Groupe Limagrain
-
Advanta Seeds (UPL Limited)
- *Disclaimer: Major Players sorted in no particular order
Recent Industry Developments
- March 2025: Bioceres Crop Solutions announced it secured U.S. patent protection through 2042 for its HB drought-tolerant wheat, strengthening IP for U.S. commercialization and trait licensing.
- March 2025: RAGT Seeds announced that it received full approval on the United Kingdom Agriculture and Horticulture Development Board's (AHDB) Recommended List for 2025/26. This soft Group 4 wheat variety offers high yields, providing farmers with additional high-performance options for 2025 planting.
- January 2025: Canadian Western Red Spring (CWRC) renewed investment in wheat breeding programs to support development of new varieties with improved disease resistance and climate resilience for western Canada farmers
Global Wheat Seed Market Report Scope
The Global Wheat Seed Market Report is Segmented by Breeding Technology (Hybrids and Open Pollinated Varieties, and Hybrid Derivatives), and Geography (Africa, Asia-Pacific, Europe, Middle East, North America, South America). The Market Forecasts are Provided in Terms of Value (USD) and Volume (Metric Tons).
| Hybrids | Non-Transgenic Hybrids | |
| Transgenic Hybrids | Other Traits | |
| Open Pollinated Varieties & Hybrid Derivatives | ||
| Africa | By Country | Egypt |
| Ethiopia | ||
| Kenya | ||
| Nigeria | ||
| South Africa | ||
| Tanzania | ||
| Rest of Africa | ||
| Asia-Pacific | By Country | Australia |
| Bangladesh | ||
| China | ||
| India | ||
| Japan | ||
| Myanmar | ||
| Pakistan | ||
| Thailand | ||
| Rest of Asia-Pacific | ||
| Europe | By Country | France |
| Germany | ||
| Italy | ||
| Netherlands | ||
| Poland | ||
| Romania | ||
| Russia | ||
| Spain | ||
| Turkey | ||
| Ukraine | ||
| United Kingdom | ||
| Rest of Europe | ||
| Middle East | By Country | Iran |
| Saudi Arabia | ||
| Rest of Middle East | ||
| North America | By Country | Canada |
| Mexico | ||
| United States | ||
| Rest of North America | ||
| South America | By Country | Argentina |
| Brazil | ||
| Rest of South America |
| Breeding Technology | Hybrids | Non-Transgenic Hybrids | |
| Transgenic Hybrids | Other Traits | ||
| Open Pollinated Varieties & Hybrid Derivatives | |||
| Geography | Africa | By Country | Egypt |
| Ethiopia | |||
| Kenya | |||
| Nigeria | |||
| South Africa | |||
| Tanzania | |||
| Rest of Africa | |||
| Asia-Pacific | By Country | Australia | |
| Bangladesh | |||
| China | |||
| India | |||
| Japan | |||
| Myanmar | |||
| Pakistan | |||
| Thailand | |||
| Rest of Asia-Pacific | |||
| Europe | By Country | France | |
| Germany | |||
| Italy | |||
| Netherlands | |||
| Poland | |||
| Romania | |||
| Russia | |||
| Spain | |||
| Turkey | |||
| Ukraine | |||
| United Kingdom | |||
| Rest of Europe | |||
| Middle East | By Country | Iran | |
| Saudi Arabia | |||
| Rest of Middle East | |||
| North America | By Country | Canada | |
| Mexico | |||
| United States | |||
| Rest of North America | |||
| South America | By Country | Argentina | |
| Brazil | |||
| Rest of South America | |||
Market Definition
- Commercial Seed - For the purpose of this study, only commercial seeds have been included as part of the scope. Farm-saved Seeds, which are not commercially labeled are excluded from scope, even though a minor percentage of farm-saved seeds are exchanged commercially among farmers. The scope also excludes vegetatively reproduced crops and plant parts, which may be commercially sold in the market.
- Crop Acreage - While calculating the acreage under different crops, the Gross Cropped Area has been considered. Also known as Area Harvested, according to the Food & Agricultural Organization (FAO), this includes the total area cultivated under a particular crop across seasons.
- Seed Replacement Rate - Seed Replacement Rate is the percentage of area sown out of the total area of crop planted in the season by using certified/quality seeds other than the farm-saved seed.
- Protected Cultivation - The report defines protected cultivation as the process of growing crops in a controlled environment. This includes greenhouses, glasshouses, hydroponics, aeroponics, or any other cultivation system that protects the crop against any abiotic stress. However, cultivation in an open field using plastic mulch is excluded from this definition and is included under open field.
| Keyword | Definition |
|---|---|
| Row Crops | These are usually the field crops which include the different crop categories like grains & cereals, oilseeds, fiber crops like cotton, pulses, and forage crops. |
| Solanaceae | These are the family of flowering plants which includes tomato, chili, eggplants, and other crops. |
| Cucurbits | It represents a gourd family consisting of about 965 species in around 95 genera. The major crops considered for this study include Cucumber & Gherkin, Pumpkin and squash, and other crops. |
| Brassicas | It is a genus of plants in the cabbage and mustard family. It includes crops such as carrots, cabbage, cauliflower & broccoli. |
| Roots & Bulbs | The roots and bulbs segment includes onion, garlic, potato, and other crops. |
| Unclassified Vegetables | This segment in the report includes the crops which don’t belong to any of the above-mentioned categories. These include crops such as okra, asparagus, lettuce, peas, spinach, and others. |
| Hybrid Seed | It is the first generation of the seed produced by controlling cross-pollination and by combining two or more varieties, or species. |
| Transgenic Seed | It is a seed that is genetically modified to contain certain desirable input and/or output traits. |
| Non-Transgenic Seed | The seed produced through cross-pollination without any genetic modification. |
| Open-Pollinated Varieties & Hybrid Derivatives | Open-pollinated varieties produce seeds true to type as they cross-pollinate only with other plants of the same variety. |
| Other Solanaceae | The crops considered under other Solanaceae include bell peppers and other different peppers based on the locality of the respective countries. |
| Other Brassicaceae | The crops considered under other brassicas include radishes, turnips, Brussels sprouts, and kale. |
| Other Roots & Bulbs | The crops considered under other roots & bulbs include Sweet Potatoes and cassava. |
| Other Cucurbits | The crops considered under other cucurbits include gourds (bottle gourd, bitter gourd, ridge gourd, Snake gourd, and others). |
| Other Grains & Cereals | The crops considered under other grains & cereals include Barley, Buck Wheat, Canary Seed, Triticale, Oats, Millets, and Rye. |
| Other Fibre Crops | The crops considered under other fibers include Hemp, Jute, Agave fibers, Flax, Kenaf, Ramie, Abaca, Sisal, and Kapok. |
| Other Oilseeds | The crops considered under other oilseeds include Ground nut, Hempseed, Mustard seed, Castor seeds, safflower seeds, Sesame seeds, and Linseeds. |
| Other Forage Crops | The crops considered under other forages include Napier grass, Oat grass, White clover, Ryegrass, and Timothy. Other forage crops were considered based on the locality of the respective countries. |
| Pulses | Pigeon peas, Lentils, Broad and horse beans, Vetches, Chickpeas, Cowpeas, Lupins, and Bambara beans are the crops considered under pulses. |
| Other Unclassified Vegetables | The crops considered under other unclassified vegetables include Artichokes, Cassava Leaves, Leeks, Chicory, and String beans. |
Research Methodology
Mordor Intelligence follows a four-step methodology in all our reports.
- Step-1: IDENTIFY KEY VARIABLES: In order to build a robust forecasting methodology, the variables and factors identified in Step-1 are tested against available historical market numbers. Through an iterative process, the variables required for market forecast are set and the model is built on the basis of these variables.
- Step-2: Build a Market Model: Market-size estimations for the forecast years are in nominal terms. Inflation is not a part of the pricing, and the average selling price (ASP) is kept constant throughout the forecast period.
- Step-3: Validate and Finalize: In this important step, all market numbers, variables and analyst calls are validated through an extensive network of primary research experts from the market studied. The respondents are selected across levels and functions to generate a holistic picture of the market studied.
- Step-4: Research Outputs: Syndicated Reports, Custom Consulting Assignments, Databases, and Subscription Platforms


