
Global Western Blotting Market Size and Share
Market Overview
| Study Period | 2020 - 2031 |
|---|---|
| Market Size (2026) | USD 1.79 Billion |
| Market Size (2031) | USD 2.39 Billion |
| Growth Rate (2026 - 2031) | 5.92 % |
| Fastest Growing Market | Asia-Pacific |
| Largest Market | North America |
| Market Concentration | Medium |
Major Players *Disclaimer: Major Players sorted in no particular order Image © Mordor Intelligence. Reuse requires attribution under CC BY 4.0. | |
Global Western Blotting Market Analysis by Mordor Intelligence
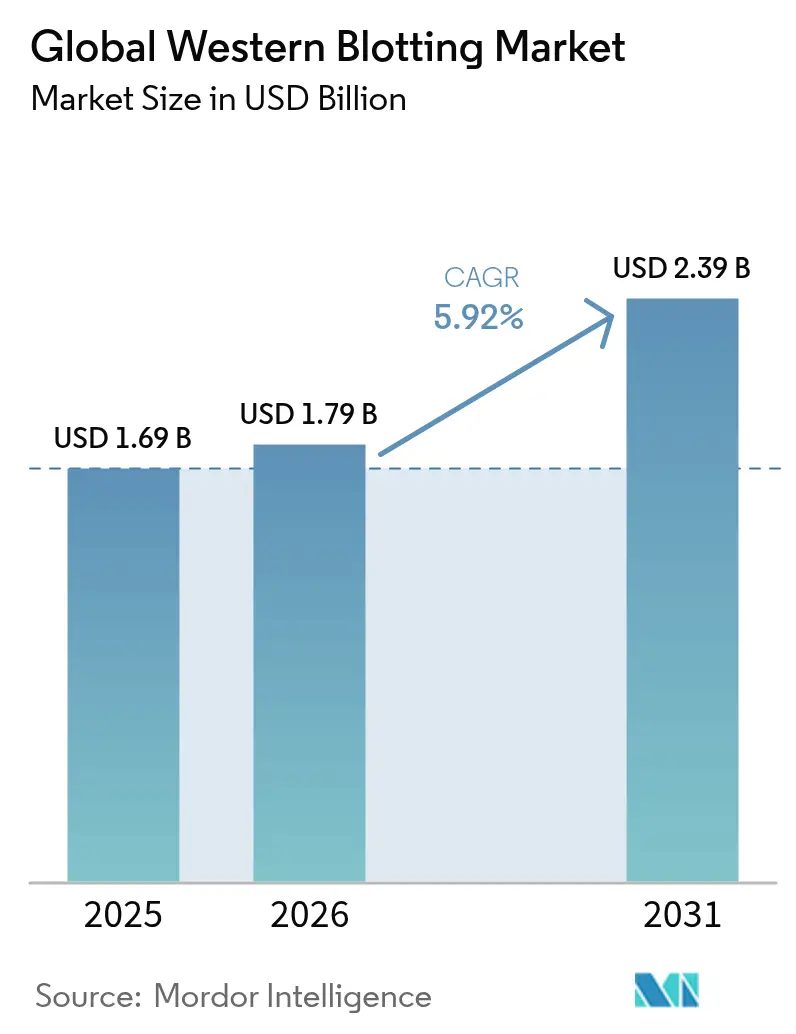
The western blot market size was valued at USD 1.69 billion in 2025 and estimated to grow from USD 1.79 billion in 2026 to reach USD 2.39 billion by 2031, at a CAGR of 5.92% during the forecast period (2026-2031). Increased chronic-disease incidence, the expansion of proteomics pipelines, and a wave of automation investments reinforce demand for protein confirmation assays in research and diagnostic workflows. Automated and microfluidic platforms are attracting laboratories that need higher throughput, less reagent consumption, and better reproducibility, while the ongoing preference for validated antibody-based techniques protects the core consumables business. Integration of artificial intelligence (AI) in antibody validation, tighter regulatory guidance on analytical robustness, and sustained life-sciences funding collectively anchor future growth for the Western blot market. Competitive pressure from multiplex immunoassays and mass-spectrometry-based approaches is intensifying, yet western blotting remains a benchmark method for confirming protein expression, post-translational modifications, and therapeutic product quality.
Key Report Takeaways
- By product type, consumables held 64.78% of the western blot market share in 2025, while automated and microfluidic instruments are projected to expand at a 7.68% CAGR through 2031.
- By application, biomedical and biochemical research commanded a 59.12% share of the western blot market size in 2025; disease diagnostics is forecast to post a 7.12% CAGR to 2031.
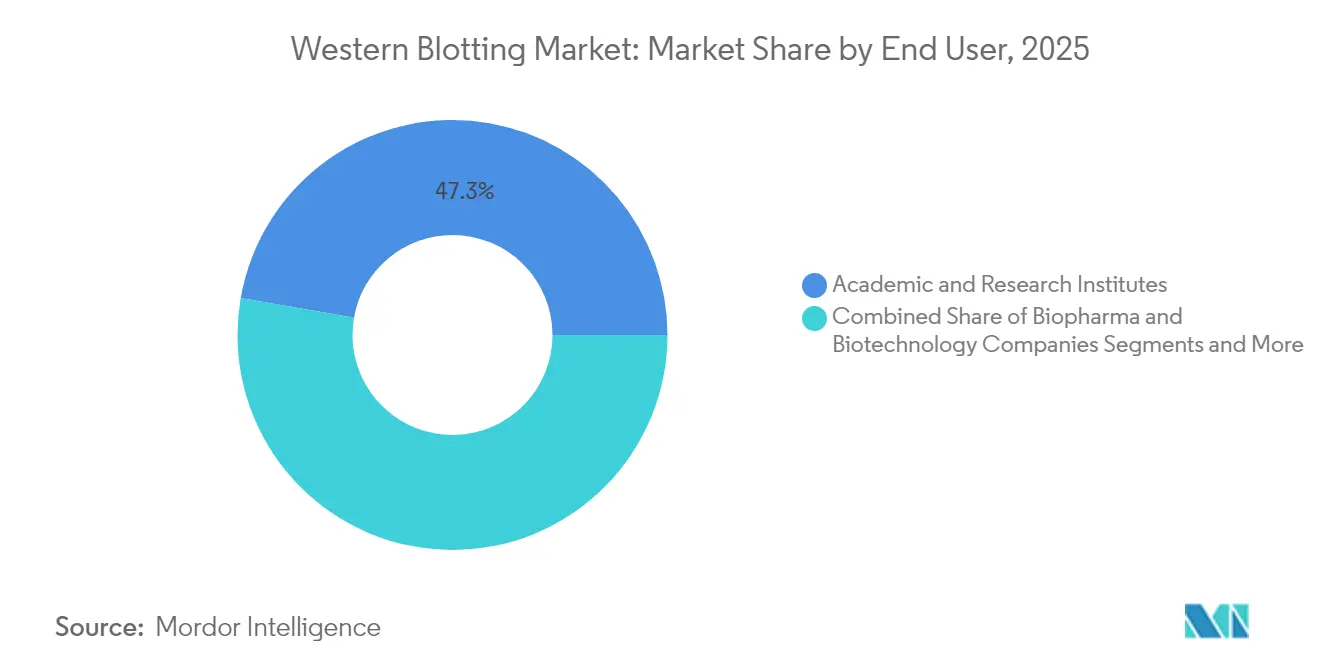
- By end-user, academic and research institutes led with 47.25% of the western blot market share in 2025, whereas hospitals and diagnostic laboratories are growing fastest at 6.93% CAGR.
- By geography, North America accounted for 41.62% revenue in 2025; Asia Pacific is the fastest-growing region, advancing at an 8.28% CAGR through 2031.
Note: Market size and forecast figures in this report are generated using Mordor Intelligence’s proprietary estimation framework, updated with the latest available data and insights as of 2026.
Global Western Blotting Market Trends and Insights
Drivers Impact Analysis*
| Driver | (~) % Impact on CAGR Forecast | Geographic Relevance | Impact Timeline |
|---|---|---|---|
| Rising Prevalence of Chronic Diseases | +1.20% | Global, North America & Europe focus | Long term (≥ 4 years) |
| Expansion of Proteomics & Biomarker Discovery Pipelines | +0.90% | Global, led by APAC & North America | Medium term (2-4 years) |
| Escalating Pharma/Biotech R&D Budgets | +0.80% | North America & EU, expanding to APAC | Medium term (2-4 years) |
| Adoption of Automated & Microfluidic WB Platforms | +1.10% | Global, early adoption in developed markets | Short term (≤ 2 years) |
| AI-Driven Antibody Validation Workflows | +0.70% | North America & EU, selective APAC | Medium term (2-4 years) |
| Regulatory Focus on Reproducible Protein Data | +0.60% | Global, stricter in North America & EU | Long term (≥ 4 years) |
| Source: Mordor Intelligence | |||
Rising Prevalence of Chronic Diseases
Cancer incidence climbed 58% in Europe between 1995 and 2022, creating sustained demand for protein biomarker confirmation in tumor biology and metabolic-disorder studies.[1]Oncology research now requires the detection of low-abundance proteins and subtle post-translational changes, functions that western blotting supports reliably. The growing elderly population further enlarges case volumes for chronic conditions, reinforcing routine use of blot consumables and imaging reagents. As precision-medicine programs multiply, laboratories integrate automated blot platforms that handle higher throughput with minimal manual error. These patterns together lengthen the revenue runway for the Western blot market.
Expansion of Proteomics & Biomarker Discovery Pipelines
Large-scale proteomics initiatives are reshaping pharmaceutical discovery. Thermo Fisher Scientific’s USD 3.1 billion purchase of Olink added more than 5,300 validated biomarker targets to its portfolio.[2] Single-cell protein assays enabled by microfluidic western blotting now reveal heterogeneity that bulk analyses miss. AI-driven antibody screening accelerates candidate selection, cutting validation time and widening use cases. Rising sales of tandem-mass-tag reagents, up 18% to USD 4.01 million in 2024, indicate vigorous spending on complementary proteomics tools. These trends underpin continuous platform upgrades within the Western blot market.
Escalating Pharma / Biotech R&D Budgets
Global pharmaceutical R&D spending remains robust, particularly in biologics where protein confirmation assays are mandated. Thermo Fisher recorded USD 42.879 billion in 2024 revenue, reflecting instrumentation demand across discovery and quality-control labs. Bio-Rad’s ChemiDoc Go system launch shows manufacturers allocating capital toward next-generation blot imaging workflows. Venture funding recovery in Asia is noticeable, funneling capital into start-ups that require standardized blot protocols to support regulatory submissions. As clinical pipelines diversify, validated western blot methods remain a foundational analytical step, bolstering long-term equipment and consumable sales.
Adoption of Automated & Microfluidic WB Platforms
Microfluidic western blot instruments can evaluate multiple proteins simultaneously while consuming roughly 1% of the antibody volumes used by conventional setups.[3]These devices reduce total assay time from several hours to 10–60 minutes and deliver quantitative data with lower variability. Fully integrated centrifugal microfluidic systems now isolate and analyze exosomes within 45 minutes. Laboratories pursuing error-free workflows adopt automated sample loading and AI-enabled image analysis, supporting reproducibility mandates. While new platforms partially cannibalize legacy hardware, they expand the total addressable Western blot market by converting throughput-limited users.
Restraints Impact Analysis*
| Restraint | % Impact on CAGR Forecast | Geographic Relevance | Impact Timeline |
|---|---|---|---|
| Rapid Uptake of Alternative Immunoassay & Alpha Technologies | -1.40% | Global, faster adoption in developed markets | Medium term (2-4 years) |
| High Capital & Operating Cost of Western Blot Instruments & Antibodies | -0.80% | Global, more pronounced in emerging markets | Long term (≥ 4 years) |
| Antibody Batch-To-Batch Variability Undermining Reproducibility | -0.60% | Global, acute in academic & resource-limited settings | Short term (≤ 2 years) |
| Laboratory Decarbonization Targets Favoring Low-Reagent Assays | -0.30% | Europe, North America, select APAC countries | Medium term (2-4 years) |
| Source: Mordor Intelligence | |||
Rapid Uptake of Alternative Immunoassay & Alpha Technologies
Parallel-reaction-monitoring mass spectrometry now offers antibody-free detection with enhanced sensitivity, directly challenging conventional immunoblotting. Multiplex platforms such as MSD, Luminex, and AlphaLISA permit simultaneous cytokine measurements with femtogram-level detection. These systems shorten assay time, simplify quantity, and align with high-throughput screening needs. Laboratories focused on speed and multiplexing migrate certain workflows away from western blotting, pressuring manufacturers to innovate with microfluidic chips and integrated imaging. While western blotting retains validation roles, the alternative technologies limit expansion in routine quantitation segments of the western blot market.
High Capital & Operating Cost of Western Blot Instruments & Antibodies
Advanced imaging platforms and capillary-based blots can exceed USD 120,000 initial cost, dampening purchase intent in smaller or emerging-market laboratories. Antibody catalogs have grown from 10,000 to over 6 million products in 15 years, but pricing and batch variability remain concerns. NIH grants awarded for ChemDoc MP systems illustrate the funding needed even for academic users. Non-animal-derived antibody formats promise unlimited supply and improved consistency yet still require awareness campaigns and upfront investment. Maintenance contracts, reagent replenishment, and operator training inflate lifetime ownership costs, leading cost-sensitive labs to postpone upgrades or adopt alternative assays.
*Our forecasts treat driver/restraint impacts as directional, not additive. The impact forecasts reflect baseline growth, mix effects, and variable interactions.
Segment Analysis
By Product: Automation Broadens Capability and Efficiency
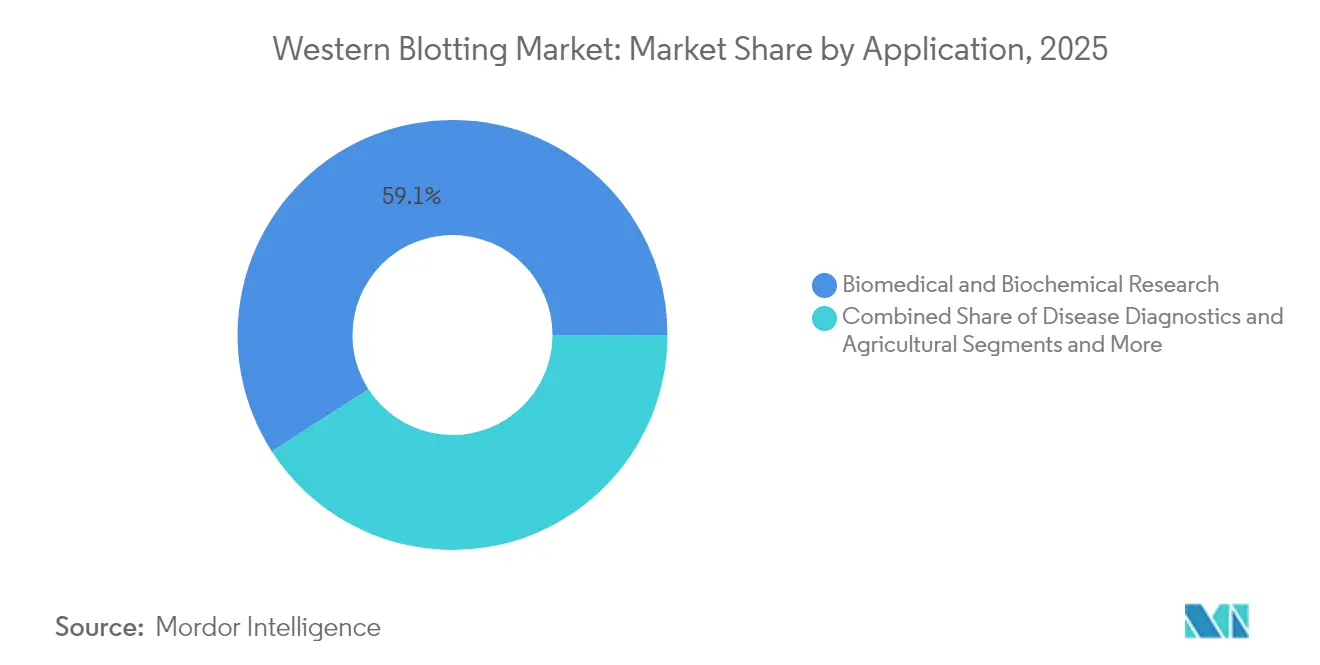
Consumables generated 64.78% of revenue in 2025, reflecting recurring sales of membranes, antibodies, buffers, and chemiluminescent substrates. This broad installed base secures stable cash flow for suppliers in the Western blot market. Automated and microfluidic instruments, while representing a smaller absolute revenue pool, are expanding at 7.68% CAGR to 2031 as users prioritize speed and low reagent footprints. Kit-based solutions further streamline workflows, lowering user variability and facilitating regulatory documentation. The segment’s resilience resides in unavoidable consumable replacement cycles, regardless of platform sophistication.
Microfluidic devices reduce antibody usage to 1% of conventional volumes, trimming per-assay costs and easing supply constraints. Imaging systems now include embedded AI algorithms that assess band intensity, reducing interpretation subjectivity. Traditional wet-transfer equipment still serves academic labs where capital budgets limit the adoption of high-end automation. Gel and capillary electrophoresis modules continue to bridge sample preparation with downstream blotting, supporting overall western blot market continuity.

By Application: Diagnostics Gains Momentum beside Research Dominance
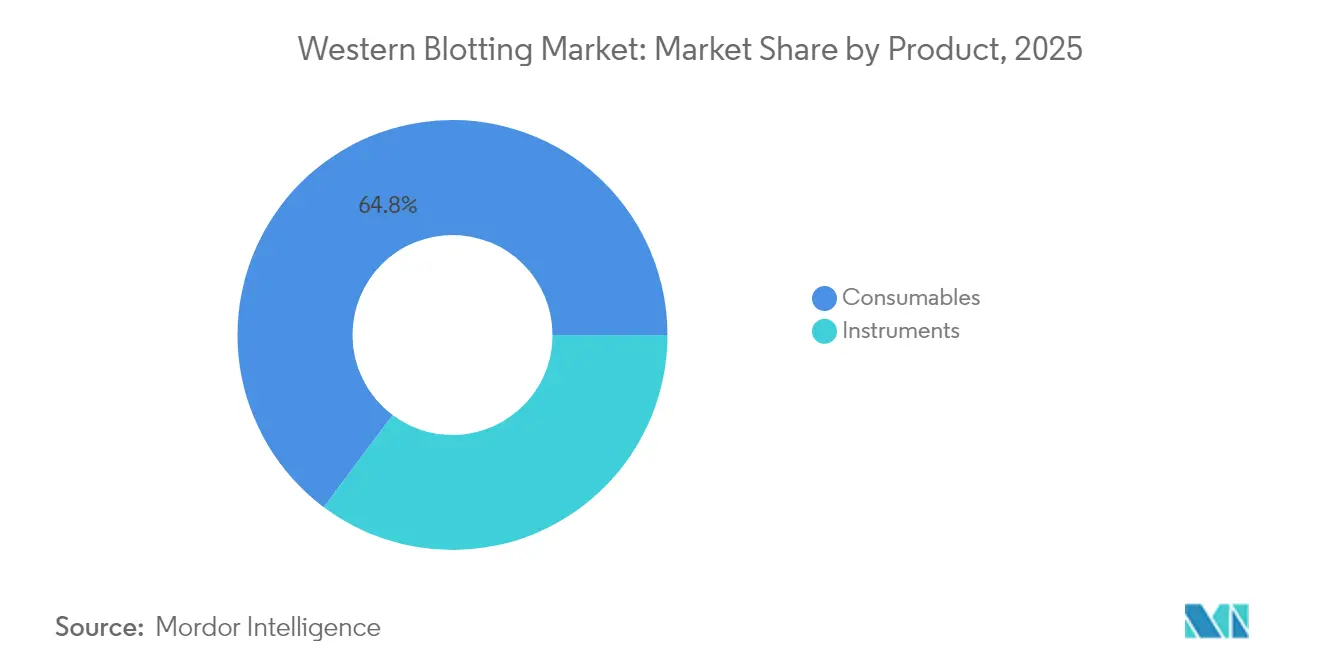
Biomedical and biochemical research contributed 59.12% of demand in 2025 and remains critical for hypothesis testing, antibody screening, and pathway elucidation. The western blot market size for diagnostic applications, however, is anticipated to climb 7.12% CAGR through 2031 as hospitals adopt validated blot assays for therapeutic monitoring and rare-disease confirmation. Oncology, neurology, and infectious-disease labs prefer blotting for post-translational modification analysis, safeguarding its clinical relevance.
Regulatory focus on evidence-based biomarker validation prompts diagnostic labs to purchase fully validated kits, reducing assay-development timelines. Single-cell analysis advances expand the research scope, feeding incremental reagent demand and sustaining the Western blot market share. Agricultural and food-testing applications, although smaller, use blots to monitor allergen presence and genetically modified organism expression, thus broadening the method’s footprint.
By End-User: Academic Core Meets Clinical Uptake
Academic and research institutes controlled 47.25% of revenue in 2025, supported by public funding and long-standing curricular reliance on Western blot protocols. These centers maintain diverse instrument fleets and create consistent consumable pull-through. Hospitals and diagnostic laboratories exhibit a 6.93% CAGR as personalized medicine programs call for high-confidence protein conformation, pushing the western blot market size upward within clinical settings.
Pharmaceutical and biotechnology companies rely on western blotting for product characterization, stability studies, and regulatory submissions, allocating capital toward high-throughput, 21 CFR Part 11-ready instrumentation. Contract research and testing laboratories supplement capacity for smaller firms, amplifying consumables turnover and expanding geographical reach. The mixture of academic teaching demand and regulated-industry compliance needs secures a balanced growth pathway for the western blot market.
Geography Analysis
North America generated 41.62% of worldwide revenue in 2025, underpinned by mature research infrastructure, substantial biopharmaceutical R&D outlays, and rigorous regulatory oversight that values validated protein methods. The United States accounts for most sales, while Canada and Mexico contribute incremental gains through growing biotech clusters and clinical-trial activity. Government grants, venture capital flow, and an advanced supplier ecosystem foster early adoption of automated blot platforms, sustaining regional leadership.
Europe follows with well-established biotechnology hubs in Germany, the United Kingdom, France, and Switzerland. European regulators now demand reproducible analytics, reinforcing preferences for validated antibody sources and standard operating procedures. Switzerland’s biotech network of more than 1,500 companies and 60,000 jobs illustrates how concentrated innovation feeds equipment demand. Markets such as Italy and Spain add volume via pharmaceutical manufacturing and university research, though budget constraints influence instrument penetration rates.
Asia Pacific is the fastest-growing territory, projected at an 8.28% CAGR through 2031. China’s significant venture investments and state-sponsored life-sciences parks drive substantial procurement of blotting consumables and automated imaging systems. India accelerates adoption through government initiatives supporting translational research and domestic biologics production. Japan and South Korea leverage strong pharmaceutical bases and regulatory alignment with global standards to sustain replacement cycles. Australia and Southeast Asian countries, while smaller, are channeling grant funding toward proteomics facilities, strengthening regional participation in the western blot market. Collaborative models linking academia, government, and industry bolster infrastructure, ensuring long-term growth momentum.
Regulatory Landscape
Western blot systems and reagents used in clinical testing fall under broader in vitro diagnostic (IVD) oversight. In the European Union, products placed for IVD use are governed by Regulation (EU) 2017/746 (IVDR), which raises performance and documentation expectations versus prior directives and is further clarified through Medical Device Coordination Group guidance (including MDCG 2024-11 on IVDR qualification). In the United States, manufacturers marketing western blot-related IVD devices follow FDA medical-device requirements such as establishment registration and device listing, and align method-validation practices with regulator expectations for analytical robustness.
Standards activity in 2026 also adds compliance anchors for laboratories and suppliers supporting regulated workflows. ISO published multiple laboratory-focused IVD standards in 2026, including ISO 18704:2026 (molecular IVD pre-examination processes), ISO 22367:2026 (medical laboratory risk management), and ISO 15194:2026 (certified reference materials for IVD), all of which reinforce traceability, risk controls, and documentation practices that feed into kit and instrument selection. Trade-policy developments further add supply-side uncertainty, with the USTR proposing Section 301 tariff actions on June 2, 2026 that referenced additional duties tied to forced-labor import enforcement, drawing attention to sourcing, landed cost, and alternative manufacturing footprints for US-facing supply.
Value Chain Analysis
The western blotting value chain starts with raw materials and critical inputs, including membrane substrates, buffers and chemicals, enzymes and labels, plastics and other consumables, and antibody reagents. These inputs then move into manufacturing and assembly across instruments (electrophoresis and transfer hardware, imaging optics and sensors, software) and consumables (membranes, reagents, kits, and validated antibody components), followed by quality control and documentation. Distribution happens through direct sales to large biopharma and academic accounts, and through laboratory distributors and e-commerce channels for routine replenishment. For imaging systems and automated or microfluidic platforms, aftermarket service, calibration, and software updates form an additional downstream layer.
Margin and risk concentrate in higher-value steps such as formulation, casting, slitting, packaging, and system integration, where performance consistency and documentation influence purchasing decisions. Common bottlenecks include availability of specialized optical components for imagers, clean-room capacity for certain consumables, and sourcing of custom or highly validated monoclonal antibodies, which can extend lead times for integrated systems and constrain scaling in high-throughput labs. Where applicable, compliance requirements such as ISO 13485-aligned quality systems and CE/IVDR technical documentation operate as non-tariff barriers that favor established suppliers and tighter bill-of-material control. In biopharma, consolidated procurement through framework agreements increases the emphasis on multi-source qualification and long-term supply assurance for high-volume consumables.
Competitive Landscape
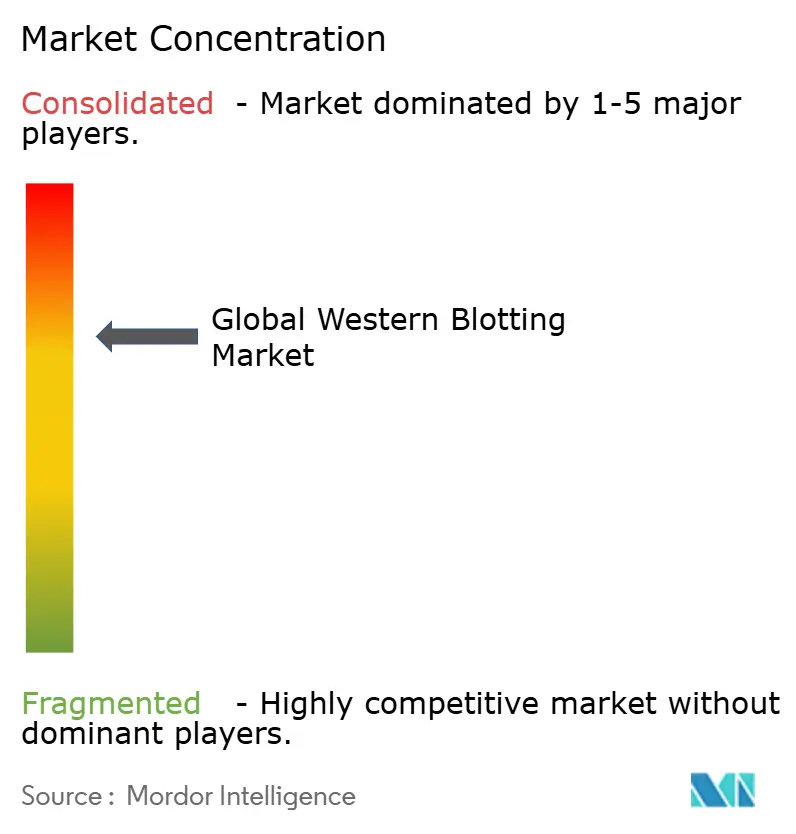
The western blot market shows moderate concentration, with a core set of global companies complemented by regional specialists and emerging innovators. Established suppliers compete on workflow integration, offering end-to-end platforms that span sample preparation to data analysis. Automation, AI-enabled imaging, and compliance-ready software are key differentiators. The August 2024 release of Bio-Rad’s ChemiDoc Go illustrates continued investment in compact, high-resolution imaging that targets both research and clinical labs.
Mergers and acquisitions accelerate technology consolidation. Thermo Fisher’s Olink acquisition expanded its proteomics footprint, creating bundled offerings that combine proximity-extension assays with blot verification. Roche’s plan to launch 75 new assays by 2029 signals a pipeline focus on high-value diagnostic solutions that may incorporate western blot readouts. Meanwhile, new entrants developing non-animal-derived antibodies challenge incumbents by promising batch-to-batch consistency and animal-welfare benefits.
Innovation hotspots include single-cell microfluidic blotting and exosome-specific transfer systems, areas where start-ups pilot disruptive platforms that shrink assay time and reagent cost. Mass-spectrometry vendors and multiplex immunoassay providers intensify competitive pressure, compelling western blot companies to emphasize validation pedigree and visual confirmation strengths. Overall, sustained R&D investment, strategic partnerships, and a pivot toward data-rich, automated workflows characterize competitive maneuvering within the western blot market.
Global Western Blotting Industry Leaders
-
Thermo Fisher Scientific, Inc.
-
Bio-Rad Laboratories, Inc.
-
PerkinElmer, Inc.
-
Merck & Co., Inc.,
-
Danaher Corporation (Cytiva)
- *Disclaimer: Major Players sorted in no particular order
Market Opportunities and Future Outlook
Opportunities are widening where western blotting is being redesigned for reproducibility, quantification, and higher throughput, rather than purely qualitative confirmation. Microfluidic and single-cell formats create application headroom constrained by sample volume and turnaround time, while also reducing antibody consumption, which is a major driver of operating cost and variability in conventional workflows. At the same time, digitized workflows that combine imaging, analysis, and audit trails support regulated and quality-control environments that require stronger data integrity and standardized reporting.
Method standardization and analysis automation also drive demand signals for suppliers that can bundle compatible reagents, labeling chemistries, and software. Technical publications and editorial guidance have increased attention on total protein normalization approaches, including stain-free total protein normalization, shifting purchasing toward systems and consumables that simplify standardized normalization. Research demonstrations of AI-assisted interpretation, including deep-learning tools reported to achieve high accuracy in interpreting diagnostic western blot images, further support roadmaps focused on reducing manual subjectivity in band calling and quantitation. These shifts favor providers that can deliver end-to-end, validated workflows covering sample handling, transfer, detection, normalization, and compliant digital outputs.
Recent Industry Developments
- May 2026: Thermo Fisher Scientific acknowledged that some Western blot images in its online catalog may have been adjusted for presentation and stated it initiated a review process, including making raw, unedited versions available upon request. The update underscores rising expectations for data integrity and traceability in antibody validation workflows, shaping how labs assess reagent credibility and how suppliers document performance claims.
- January 2025: Roche Diagnostics announced plans to launch 75 novel assays by 2029, including formats aligned with western blot testing applications. The program highlights continued menu expansion in diagnostics and raises the importance of standardized, reproducible protein confirmation methods and validated consumables that can support assay development and verification workflows.
- August 2024: Bio-Rad Laboratories introduced the ChemiDoc Go Imaging System for gels and western blots, expanding its benchtop imaging portfolio. By emphasizing compact digital imaging and protein quantitation workflows, the launch supports the shift away from manual documentation toward integrated, software-supported data capture in research and clinical-adjacent laboratories.
Research Methodology Framework and Report Scope
Market Definition and Coverage
For this methodology, the western blotting market includes revenues from tools and consumables used to separate proteins, transfer them to membranes, and detect targets using immunoblotting steps in lab workflows.
Scope exclusions: Service outsourcing fees and revenues from stand-alone research antibodies that are not used for blotting are excluded.
Segmentation Overview
- By Product
- Instruments
- Gel & Capillary Electrophoresis Systems
- Traditional Wet / Semi-dry / Dry Blotting Systems
- Automated & Microfluidic Platforms
- Imagers
- Consumables
- Reagent and Buffers
- Kits
- Instruments
- By Application
- Biomedical & Biochemical Research
- Disease Diagnostics
- Agricultural & Food Safety Testing
- By End-User
- Academic & Research Institutes
- Biopharma & Biotechnology Companies
- Hospitals & Diagnostic Laboratories
- CROs & Contract Testing Labs
- Geography
- North America
- United States
- Canada
- Mexico
- Europe
- Germany
- United Kingdom
- France
- Italy
- Spain
- Rest of Europe
- Asia Pacific
- China
- Japan
- India
- South Korea
- Australia
- Rest of Asia Pacific
- Middle East and Africa
- GCC
- South Africa
- Rest of Middle East and Africa
- South America
- Brazil
- Argentina
- Rest of South America
- North America
Data Sources, Market Sizing, and Validation
Desk Research
Desk work started with public science and health references so we could lock down what gets counted as a western blotting workflow and what does not. We used sources such as PubMed-indexed papers, ClinicalTrials.gov study records, the NIH RePORTER database for funded research activity, the World Bank for macro indicators that affect lab spending, and UN Comtrade to sense-check cross border movements for relevant lab supplies.
Along with those, we reviewed company annual reports, product catalogs, investor presentations, and reputable press coverage to understand portfolio mix between instruments and consumables and to track typical replacement and reorder behavior. Where needed, paid subscriptions for company financials and news intelligence, patent databases, and shipment-level import/export data were used to fill gaps and cross-check directional movements. This list is not exhaustive, and many other public sources were also referenced for data collection, validation, and clarification during the study.
Primary Interviews and Surveys
Primary work was used to confirm what labs actually buy for western blotting and how usage is shifting across research, diagnostics, and quality control settings. We spoke with a mix of suppliers, distributors, lab managers, and procurement aligned roles across APAC, EMEA, and the Americas so assumptions on volumes, pricing behavior, and upgrade cycles could be checked and then tightened.
Distribution of primary research fieldwork respondents
| Company type | Respondent position | Region |
|---|---|---|
| Top tier: 36% | CXOs: 16% | APAC: 50% |
| Mid tier: 45% | Functional/Unit leaders: 37% | EMEA: 30% |
| Smaller Players: 19% | Managers: 47% | Americas: 20% |
Market-Sizing & Forecasting
Sizing is built using a top-down model where research intensity and lab throughput indicators are translated into a realistic demand pool for western blotting runs and the related spend per workflow. The model is then corroborated through selective bottom-up approximations using channel checks, sampled average selling prices multiplied by expected unit volumes, and small roll ups of supplier and distributor signals to correct for over or under counting.
Inputs used in the model include reported life science research funding trends, the number and mix of protein related studies and trials, typical reagent and membrane consumption per run, instrument replacement and upgrade cycles, and observed price movements for key consumables and imaging systems. When a region has limited disclosed data, the gap is handled through proxy ratios such as funding per researcher and lab density, and then adjusted using interview feedback on local purchasing behavior.
For forecasting, scenario analysis is used with a base case that reflects expected research budgets and steady adoption of improved imaging and workflow kits, followed by sensitivity cases for pricing and volume changes. Assumptions on volumes and price progression are reviewed with interviewees and then kept consistent across regions through the same set of variables, which helps keep the forecast repeatable.
Data Validation & Update Cycle
Validation is done by comparing the modeled totals against independent signals such as research funding direction, activity levels in protein focused studies, and observable demand patterns for commonly used consumables, and then differences are investigated before sign-off. Outliers are flagged through variance checks across regions, product groups, and year to year movements, and the underlying drivers are reviewed in a second analyst pass so arithmetic and assumptions are aligned.
Reports are refreshed annually, and interim updates are triggered when material events shift pricing, supply, or lab purchasing behavior. Before delivery, the dataset and calculations are rechecked and a final market pass is completed so clients receive the latest updated view.
Mordor Intelligence's Western Blotting Market Estimate Compared With Other Published Estimates
Published market numbers for western blotting can look different even when they are talking about the same lab technique, because the counted revenue items and the time period choices are not always aligned. In our checks, the main reasons usually come down to what is included in the workflow basket, how prices are converted and trended across years, and how strongly the totals are validated with real world buying behavior.
Key gap drivers for this market are usually whether estimates bundle adjacent lab categories that touch protein analysis, how instruments versus consumables are balanced, and whether services are counted as part of the market spend. Another frequent driver is the pricing logic, since some approaches apply a flat ASP uplift across all products, even though consumables and imaging systems do not move in lockstep, and currency timing can also shift the USD total if not handled consistently.
Benchmark comparison
| Source | Market Size | Gaps in Research Methodology |
|---|---|---|
| Mordor Intelligence | USD 1.79 B (2026) | |
| Global Research Publisher A | USD 1.97 B (2024) | Uses a different base year and does not clearly separate instrument and consumable boundaries tied strictly to western blotting workflows, which can pull in adjacent protein analysis spend. |
| Global Advisory B | USD 1.23 B (2024) | Runs on a narrower revenue capture and a longer forecast window, and the public summary does not spell out exclusions like services or non-blotting antibodies, which can compress the stated current size. |
Research funding direction, protein study activity, and channel feedback on reorder rates are the evidence checks that keep Mordor Intelligence's estimate tied to western blotting specific instruments and consumables rather than broader protein analysis spend. Once year alignment and scope boundaries are made consistent, the remaining spread is mainly explained by how each source trends pricing and treats add-on categories that sit next to the blotting workflow.
Key Questions Answered in the Report
What is the current size of the western blot market?
The market is valued at USD 1.79 billion in 2026 and is projected to reach USD 2.39 billion by 2031 at a 5.92% CAGR.
Which product category leads revenue in the western blot market?
Consumables dominate with 64.78% revenue share in 2025 owing to repeat purchases of membranes, antibodies, and buffers.
Why are automated and microfluidic systems growing so quickly?
They reduce reagent consumption, shorten assay time to as little as 10 minutes, and improve data reproducibility, driving an 7.68% CAGR through 2031.
Which region is expanding fastest for western blot adoption?
Asia Pacific shows the highest growth at an 8.28% CAGR, propelled by biotechnology investments in China, India, Japan, and South Korea.
How are regulatory changes influencing the western blot market?
Updated FDA and USP guidelines emphasize analytical reproducibility, favoring validated western blot platforms that include compliance-ready software and documentation.
What major competitive trends are shaping the western blot market?
Key trends include platform automation, AI-based antibody validation, strategic acquisitions like Thermo Fisher’s Olink deal, and emerging non-animal-derived antibody technologies.