
Market Overview
| Study Period | 2022 - 2031 |
|---|---|
| Forecast Data Period | 2026 - 2031 |
| Historical Data Period | 2022 - 2024 |
| Growth Rate | 1.98 % |
| Market Concentration | Medium |
Major Players *Disclaimer: Major Players sorted in no particular order Image © Mordor Intelligence. Reuse requires attribution under CC BY 4.0. | |
West Africa Renewable Energy Market Analysis by Mordor Intelligence
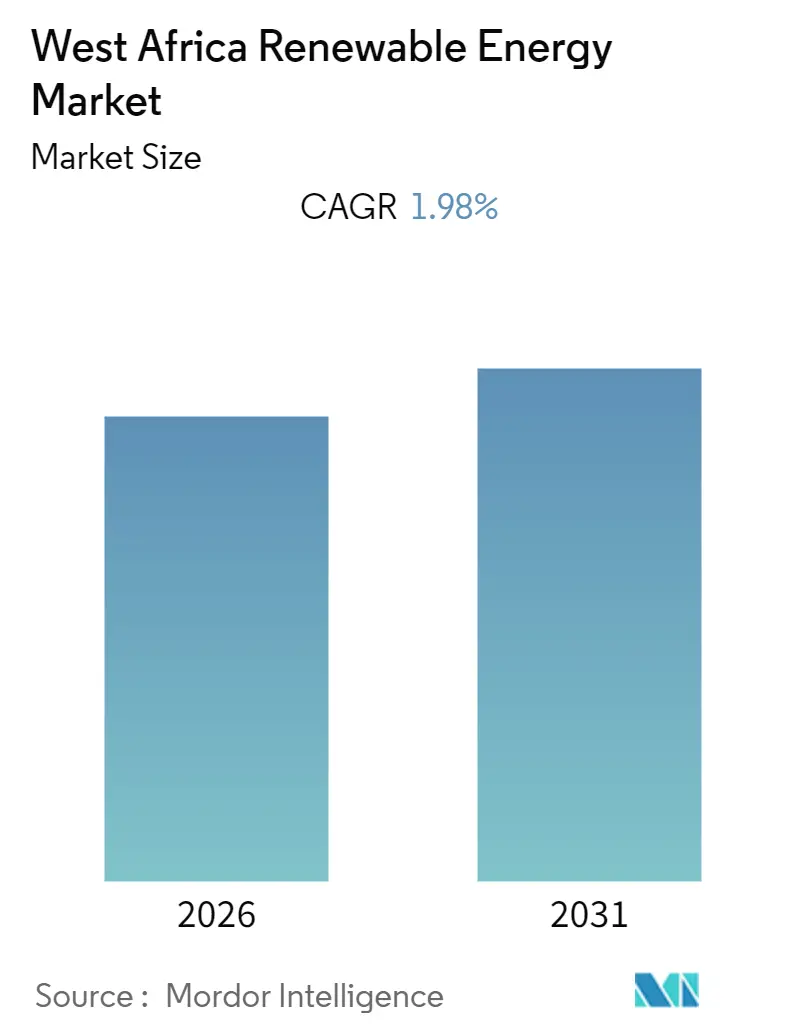
The West Africa Renewable Energy Market size is expected to register a CAGR of 1.98% during the forecast period.
COVID-19 negatively impacted the market in 2020. Currently, the market has reached pre-pandemic levels.
- Over the long term, factors such as increased environmental awareness and regulations and decreased cost per kilowatt of electricity generated are expected to boost the market.
- On the other hand, the high price of renewable energy relative to fossil fuels is expected to restrain the market.
- However, new models of solar cells made of a thin film technology that uses narrow coatings of cadmium telluride in solar cells, which have higher efficiency and lower cost, may prove to be an opportunity in the sector.
- Nigeria is expected to have the largest share of renewable energy in the region due to the government's focus on decreasing dependence on imported fossil fuels.
Note: Market size and forecast figures in this report are generated using Mordor Intelligence’s proprietary estimation framework, updated with the latest available data and insights as of 2026.
West Africa Renewable Energy Market Trends and Insights
Hydropower Segment to Dominate the Market
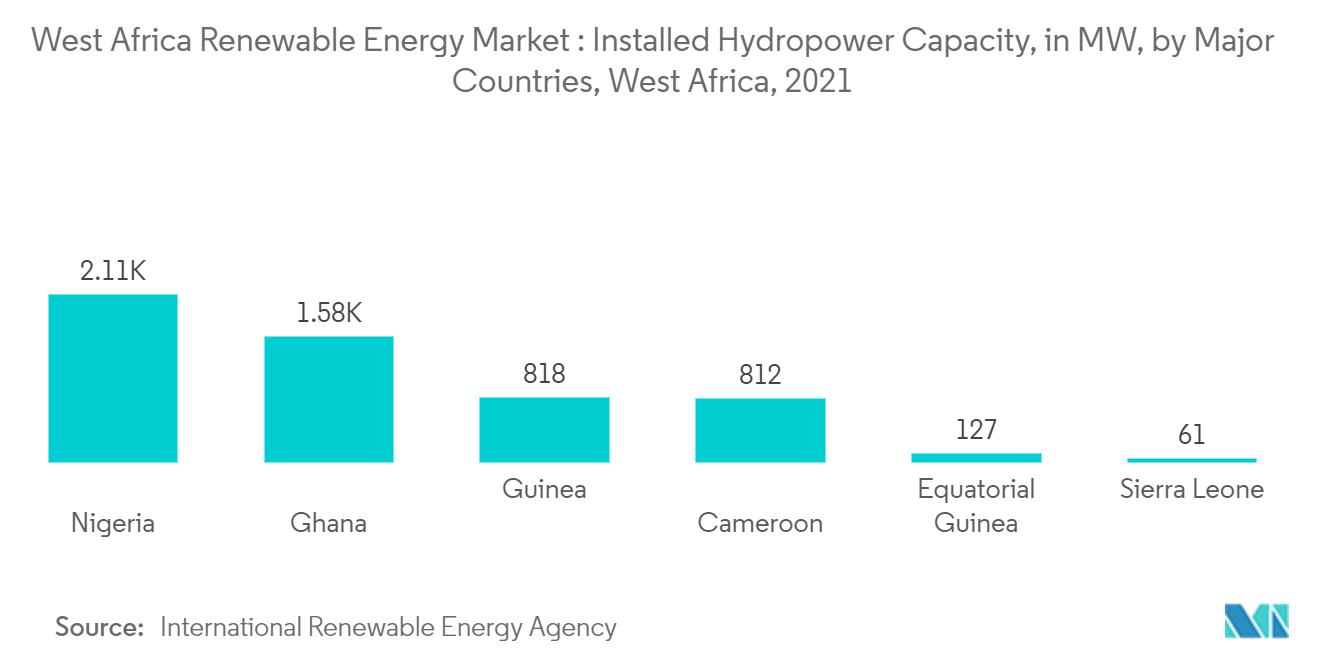
- The hydropower segment is expected to dominate the market as dams have been built across West Africa. Most of the renewable hydro capacity has been constructed in Nigeria and Ghana.
- The hydropower segment includes different-sized reservoir dams that can be used to provide renewable energy. Hydropower is the most used renewable energy in West Africa.
- In November 2022, the Nigerian government approved the construction of a 1,650 MW hydropower plant at USD 3 billion. The project would be funded under a public-private partnership arrangement and located in the north-central state of Benue, Laolu Akande.
- In September 2021, the Souapiti hydropower plant in Guinea began commercial operation. The facility will produce 1,900 GWh of clean energy per year and increase production of the downstream Kaléta hydro scheme to 1,000 GWh/per year.
- Hydropower (including mixed plants) constitute almost 94.2%of the total renewable energy generated in the region, with nearly 5,513 MW of power being produced, in 2021.
- Therefore, vast reservoirs of dams providing renewable energy are expected to continue to dominate the market due to their large size relative to other renewable energy and an increase in investments.
Nigeria to Dominate the Market
- Nigeria is expected to have the largest share of renewable energy among the nations in the forecast period due to its significant consumption of electricity and government focus on decreasing dependence on imported fossil fuel.
- Nigeria is the most populous nation in West Africa. The country's high demand for electricity due to the high population is expected to promote growth in renewable energy. However, the high cost of renewable energy causes constraints to its growth.
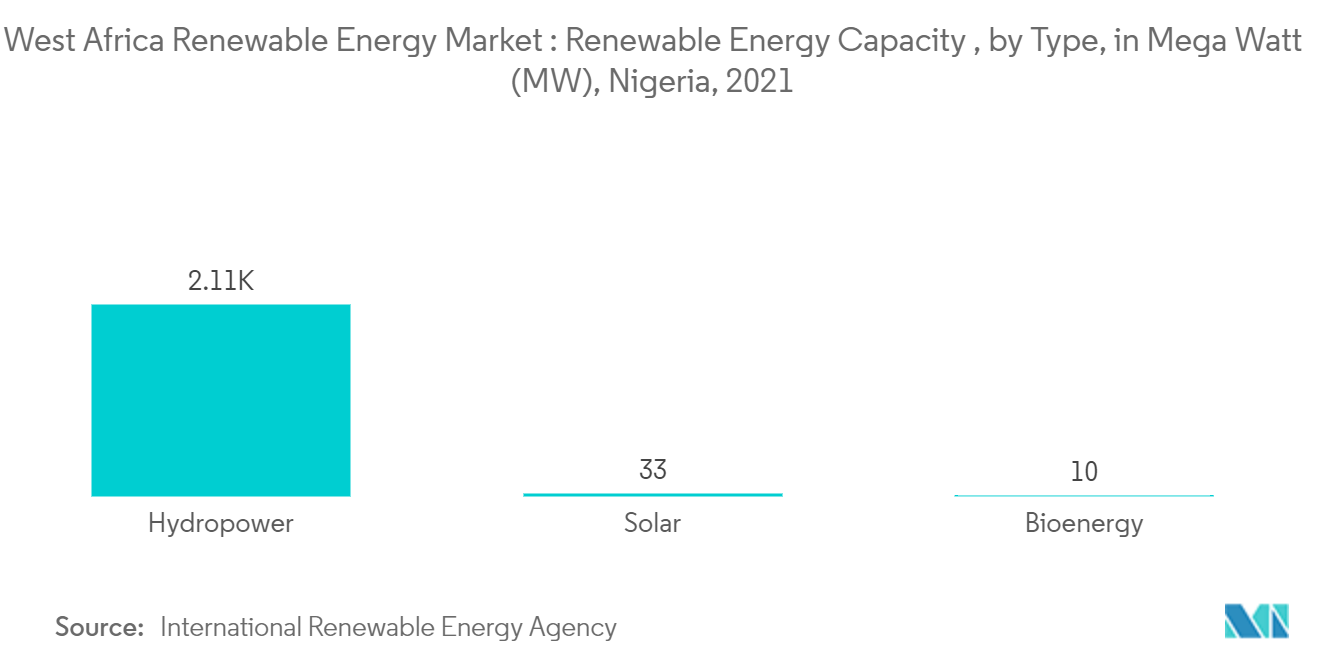
- Most of the installed renewable capacity in the country comes from Hydropower projects. In 2021, Hydropower constituted 2111 MW of installed capacity, which is approximately 98% of all the renewable energy in the country. However, this scenario is expected to change during the forecast period owing to increasing investment in solar energy.
- In September 2022, Sterling & Wilson Renewable Energy bagged a USD 1.5-billion order from the government of Nigeria, along with its consortium partner Sun Africa, for setting up solar PV power plants aggregating 961 MW at five locations along with battery energy storage systems with a total installed capacity of 455 MW.
- Hence, Nigeria is expected to dominate the market due to its large size and increased renewable energy installed capacity in the forecast period.
Regulatory Landscape
Regional regulation for renewable electricity trade and interconnection is anchored by the ECOWAS Regional Electricity Regulatory Authority (ERERA), which oversees cross-border market rules linked to the ECOWAS Regional Electricity Market framework. A key recent step was ERERA's approval of the Regional Transmission Tariff Methodology (RTTM), effective 19 March 2026, which standardizes transmission cost allocation for regional exchanges and improves bankability for projects relying on cross-border offtake.
On policy harmonization for renewables, the ECOWAS Centre for Renewable Energy and Energy Efficiency (ECREEE) supports member states with instruments such as guidance on PPAs, feed-in tariffs, and net-metering approaches. At the national level, integrated resource planning and least-cost planning efforts are being formalized, with Nigeria advancing IRP-related processes in 2026 and Liberia committing to finalize an integrated least-cost power system master plan by June 2026. Together, these steps help tighten procurement and planning discipline for both utility-scale and distributed renewable additions.
Value Chain Analysis
The West Africa renewable energy value chain runs from project development and permitting through equipment sourcing (modules, inverters, batteries, hydro equipment and balance-of-plant), EPC and civil works, and grid or mini-grid interconnection, before moving into long-term operations and maintenance. The market continues to mix utility-scale assets, especially hydropower, with expanding distributed delivery models for rural and C&I users, where developers, telecom and industrial offtakers, and mini-grid operators shape day-to-day execution alongside regulators and utilities.
Investment signals also point to capability building alongside imported components. Nigeria has progressed manufacturing-enabling infrastructure such as NASENI's Renewable Energy Industrial Park in Nasarawa (covering solar, wind, and small hydro equipment), while the Rural Electrification Agency signed a joint development agreement with SUNCECO to expand domestic manufacturing capacity for solar modules and battery storage. In Côte d'Ivoire, local IPP execution is reflected in the commissioning of PFO Energies' 52.4 MW Ferke solar plant, and corporate demand is helping pull deployment forward, including MTN Nigeria's partnership to roll out solar plus storage across critical network sites. These dynamics reinforce the EPC, integration, and O&M layer of the regional value chain.
Competitive Landscape
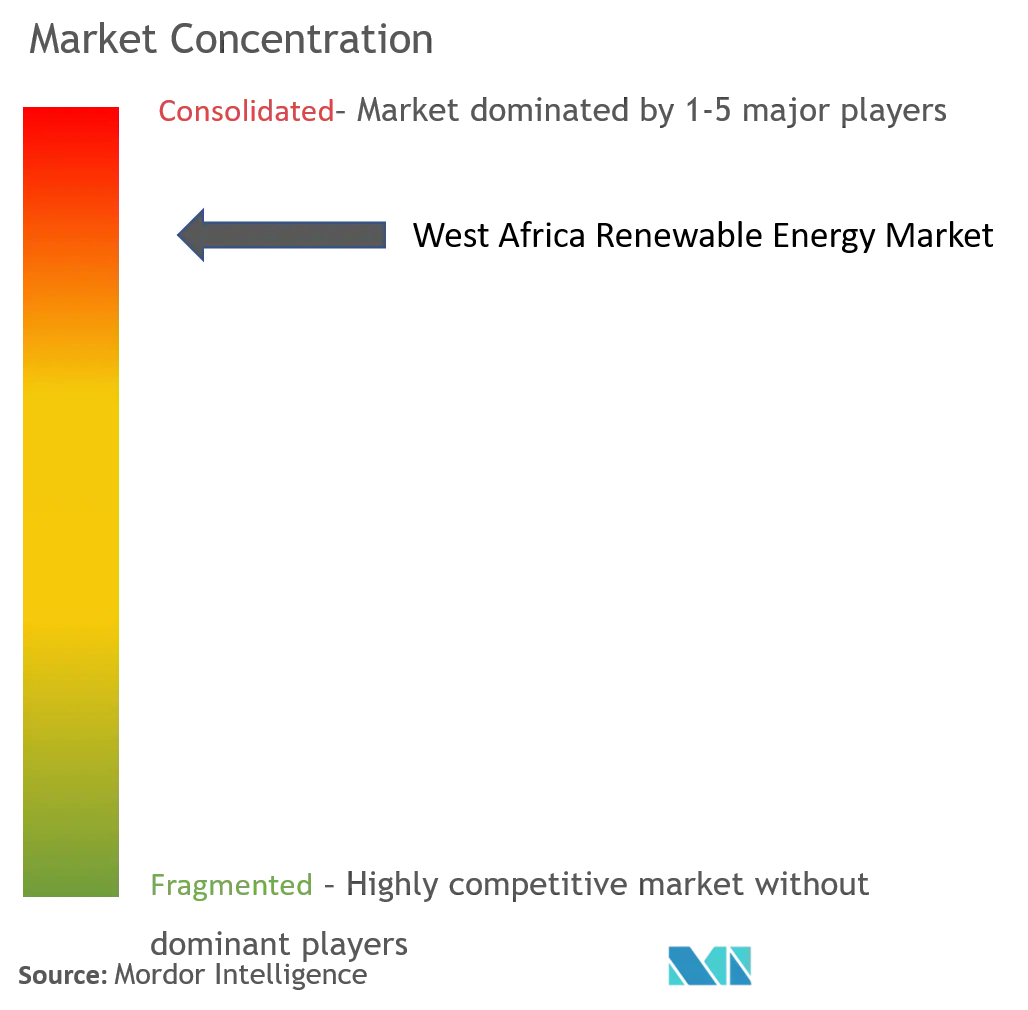
West Africa Renewable Energy Market is moderately consolidated. Some of the key players in this market are (not in particular order) Power Construction Corporation of China Ltd, Energicity Corp, Wärtsilä Oyj Abp, China Civil Engineering Construction Corporation, and REDAVIA GmbH.
West Africa Renewable Energy Industry Leaders
-
REDAVIA GmbH
-
China Civil Engineering Construction Corporation
-
Wärtsilä Oyj Abp
-
Energicity Corp
-
Power Construction Corporation of China
- *Disclaimer: Major Players sorted in no particular order
Market Opportunities and Future Outlook
Decentralized electrification and commercial and industrial (C&I) hybridization are key areas of opportunity, supported by regional and national policy signals and financing programs. ECOWAS institutions have elevated mini-grids and off-grid renewables as a priority rural electrification pathway, and Nigeria is implementing the World Bank-backed Distributed Access through Renewable Energy Scale-up (DARES) program (USD 750 million) to catalyze larger private investment. That funding framework creates addressable opportunities for mini-grid developers, solar-home and productive-use providers, and battery storage integrators.
Grid-connected solar procurement and industrial enclave power supply also add near-term deal flow. Ghana's National Energy Compact outlines solar auctions in two 200 MW tranches for grid-connected PV, and LMI Holdings is developing the Dawa Industrial Enclave solar park (1,000 MW), with an IFC-approved facility supporting an initial phase targeted for October 2026. In practice, these initiatives expand opportunity across development, EPC, grid integration services, and storage, especially where auction design and interconnection readiness raise the need for battery energy storage and hybrid plant controls.
Recent Industry Developments
- June 2026: Energicity updated its portfolio disclosure, reporting 2.2 MW of installed capacity and operations across three countries. While this did not reflect a single-project award, it points to continued rollout and operationalization of mini-grid assets, reinforcing the role of regulated tariffs and licenses in scaling rural electrification delivery models.
- September 2025: Wärtsilä signed a five-year operation and maintenance agreement with Boto SA for a 23 MW captive power plant at the Boto Gold Project in eastern Senegal. The contract supports longer-term service activity with industrial power users, where hybridization and fuel-flexible solutions alongside renewables are increasingly assessed for reliability and cost control.
- July 2024: Energicity was granted a composite micro-utility license by the Liberia Electricity Regulatory Commission (LERC) to generate and distribute electricity in Gbarpolu County for a 25-year period. The license supports multi-site deployment and tariff-based revenue models that underpin mini-grid investment and expansion in underserved communities.
Research Methodology Framework and Report Scope
Market Definition and Coverage
For this methodology, the market covers renewable power generation in West Africa, measured through installed capacity additions and the operating base across renewable technologies used to supply electricity.
Scope exclusions: We exclude fossil fuel power, transmission and distribution buildout, and energy efficiency spending, even when these are packaged with renewable project announcements.
Segmentation Overview
- Type
- Hydro
- Solar
- Wind
- Others
- Geography
- Nigeria
- Ghana
- Others
Data Sources, Market Sizing, and Validation
Desk Research
Desk work starts by building a country level view of demand and supply conditions that shape renewable build, then mapping these conditions to what is feasible for each technology.
We rely on public energy and macro series, such as IRENA statistics, World Bank development indicators, IMF macro tables, African Development Bank publications, and ECOWAS or regional power pool planning materials.
To keep inputs consistent, we also review utility and regulator releases, project documents from development finance institutions, and disclosed project pipelines in reputable press. On the supply side, company filings and investor presentations help cross-check commissioning timelines, ownership changes, and asset level context. Paid subscriptions for company financials, news, and patent databases are used selectively to validate facts quickly. These desk sources are illustrative only, and many other references were used for data collection, validation, and clarification.
Primary Interviews and Surveys
Primary work is used to confirm what is actually getting built and connected, since published pipelines can be optimistic. We speak with developers, EPC and O&M participants, lenders and advisers, utilities, and large power consumers across West Africa, then reconcile differences in timing, pricing, and the technology mix before finalizing assumptions.
Distribution of primary research fieldwork respondents
| Company type | Respondent position |
|---|---|
| Top tier: 31% | CXOs: 18% |
| Mid tier: 49% | Functional/Unit leaders: 31% |
| Smaller Players: 20% | Managers: 51% |
Market-Sizing & Forecasting
The core model is a top-down build that reconstructs the market through installed renewable capacity by country and technology, then applies expected commissioning and retirement patterns to reach annual totals. Once the first totals are formed, we corroborate them with selective bottom-up checks, such as sampled project pipelines by size class, developer roll-ups in key countries, and typical cost per MW ranges to sanity-check the implied build pace.
Inputs that matter in this market include grid connection readiness, tender and auction awards, financing closure rates, hydrology and rainfall variability for hydro output expectations, solar and wind resource quality, and policy signals like feed-in mechanisms or net metering rules. Where project data is incomplete, gaps are handled by using conservative commissioning probabilities by project stage and cross-checking against reported changes in generation mix.
Forecasting is run using scenario analysis, where base, faster, and slower build cases are shaped by permitting timelines, financing conditions, and grid absorption, then aligned with what experts see as plausible country targets and execution capacity.
Data Validation & Update Cycle
Model outputs are checked against independent signals such as announced commissioning, utility capacity statements, and published national targets, then variances are investigated country by country. When an outlier appears, analysts re-check underlying inputs, and respondents may be re-contacted to confirm whether a project moved, stalled, or changed size.
A multi-step review is followed before sign-off so that unit conversions, country totals, and technology splits are internally consistent. Reports are refreshed annually, with interim updates when material policy changes, large project cancellations, or major grid events occur. Before delivery, an analyst performs a final pass so clients receive the most current view available.
Mordor Intelligence's West Africa Renewable Energy Market Size Measured Against Other Published Estimates
Published market sizes for this topic often differ because the unit of measure is not always the same, and because country coverage and project timing assumptions are handled differently. Some studies also blend power capacity with broader investment needs, which creates a larger number even when the region being discussed is similar.
The main gap comes from mixing investment requirement figures with capacity based sizing, where Mordor Intelligence keeps the scope tied to renewable power installed capacity in West Africa rather than counting grid spending or total energy transition outlays as part of the market size.
Benchmark comparison
| Source | Market Size | Gaps in Research Methodology |
|---|---|---|
| Mordor Intelligence | USD 0.00 B (2025) | |
| Regional Consultancy A | USD 12.78 B (2026) | Uses revenue framing that can include broader renewable sector spending and longer pipeline conversion assumptions, so values look larger than a capacity-only market size. |
| Industry Association B | USD 67.00 B (2015) | Reports multi-year investment needs for renewable generation over a long window, which is not comparable to an annual market size for renewable energy deployment. |
The spread mainly reflects what gets counted and the unit being used, not just different math. When the definition stays focused on installed capacity and realistic commissioning timing, the result is easier to trace back to clear variables and to repeat year after year.
Key Questions Answered in the Report
What is the current West Africa Renewable Energy Market size?
The West Africa Renewable Energy Market is projected to register a CAGR of 1.98% during the forecast period (2026-2031)
Who are the key players in West Africa Renewable Energy Market?
REDAVIA GmbH, China Civil Engineering Construction Corporation, Wärtsilä Oyj Abp, Energicity Corp and Power Construction Corporation of China are the major companies operating in the West Africa Renewable Energy Market.
What years does this West Africa Renewable Energy Market cover?
The report covers the West Africa Renewable Energy Market historical market size for years: 2021, 2022, 2023 and 2024. The report also forecasts the West Africa Renewable Energy Market size for years: 2026, 2027, 2028, 2029, 2030 and 2031.