
Wellhead Equipment Market Size and Share
Market Overview
| Study Period | 2021 - 2031 |
|---|---|
| Market Size (2026) | USD 7.60 Billion |
| Market Size (2031) | USD 9.84 Billion |
| Growth Rate (2026 - 2031) | 5.30 % |
| Fastest Growing Market | Asia Pacific |
| Largest Market | Middle East and Africa |
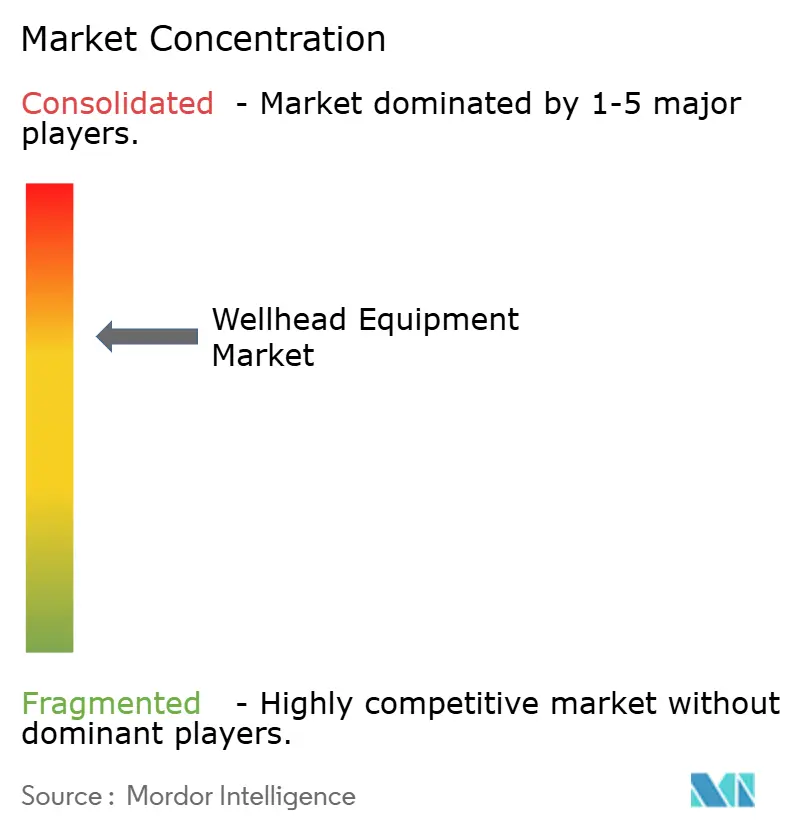
| Market Concentration | Medium |
Major Players *Disclaimer: Major Players sorted in no particular order Image © Mordor Intelligence. Reuse requires attribution under CC BY 4.0. | |
Wellhead Equipment Market Analysis by Mordor Intelligence
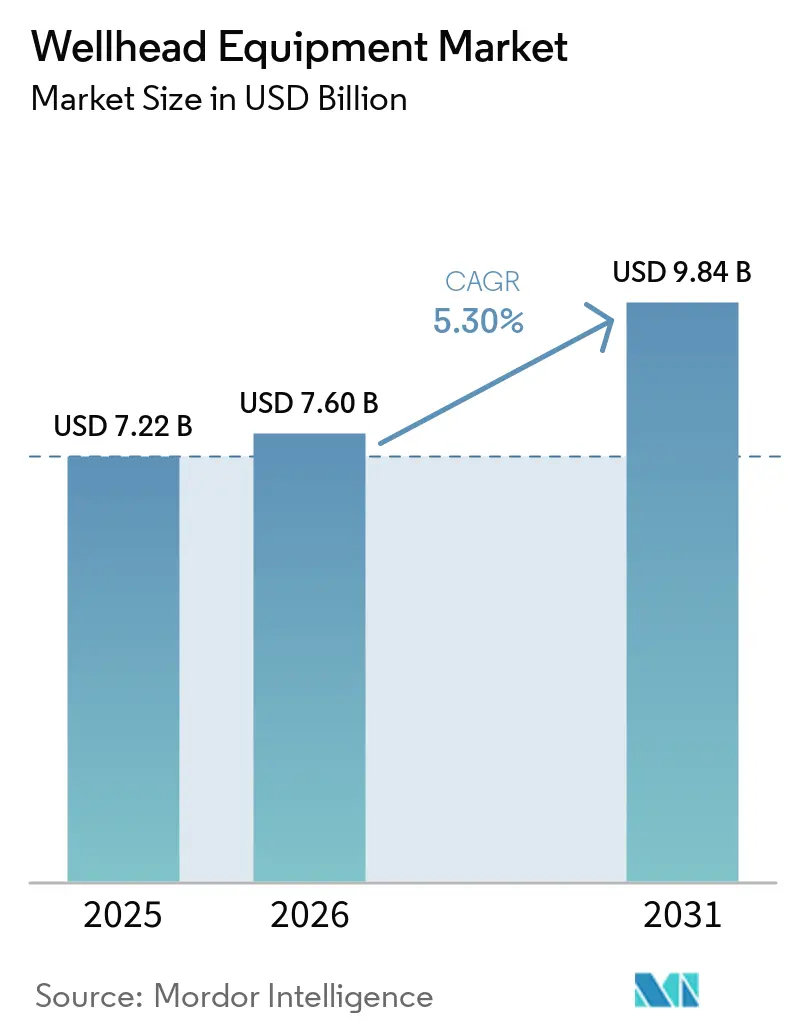
Wellhead Equipment market size in 2026 is estimated at USD 7.6 billion, growing from 2025 value of USD 7.22 billion with 2031 projections showing USD 9.84 billion, growing at 5.30% CAGR over 2026-2031.
Solid demand stems from surging unconventional drilling, rapid offshore project sanctions, and smart pressure-control systems rollout that help operators comply with tightening methane-emission rules. Mature-field replacement programs, particularly across North Sea and Gulf of Mexico assets, further lift equipment orders as operators phase out aging wellheads for higher-integrity designs. The pivot toward geothermal and carbon-capture wells adds a new source of multiyear growth, while digital-twin platforms enable predictive maintenance contracts that smooth revenue cycles for suppliers. Intensifying competition—highlighted by SLB’s July 2025 completion of the ChampionX acquisition—continues to reshape vendor portfolios toward integrated surface-pressure solutions.
Key Report Takeaways
- By component, Christmas Trees & Valves held 28.12% of the wellhead equipment market share in 2025 and are advancing at an 7.72% CAGR through 2031.
- By location, onshore accounted for 70.30% of the wellhead equipment market size in 2025, while offshore is projected to expand at an 8.06% CAGR to 2031.
- By pressure rating, below-5,000 psi systems dominated with 45.40% share of the wellhead equipment market size in 2025; above-10,000 psi solutions record the highest forecast CAGR at 8.78%.
- By well type, oil wells captured 57.60% of the wellhead equipment market size in 2025, whereas CCS/H₂ storage heads are poised for 9.6% CAGR growth.
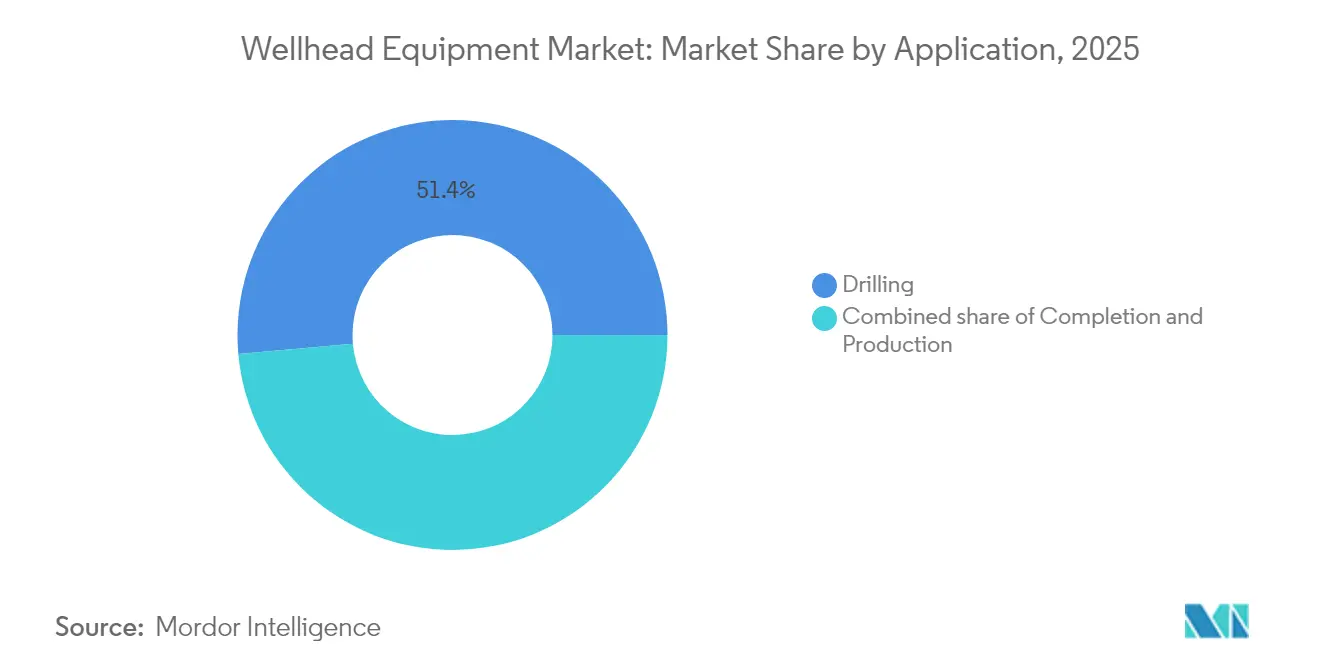
- By application stage, drilling commanded a 51.40% share of the wellhead equipment market size in 2025, and production exhibits the fastest 8.55% CAGR through 2031.
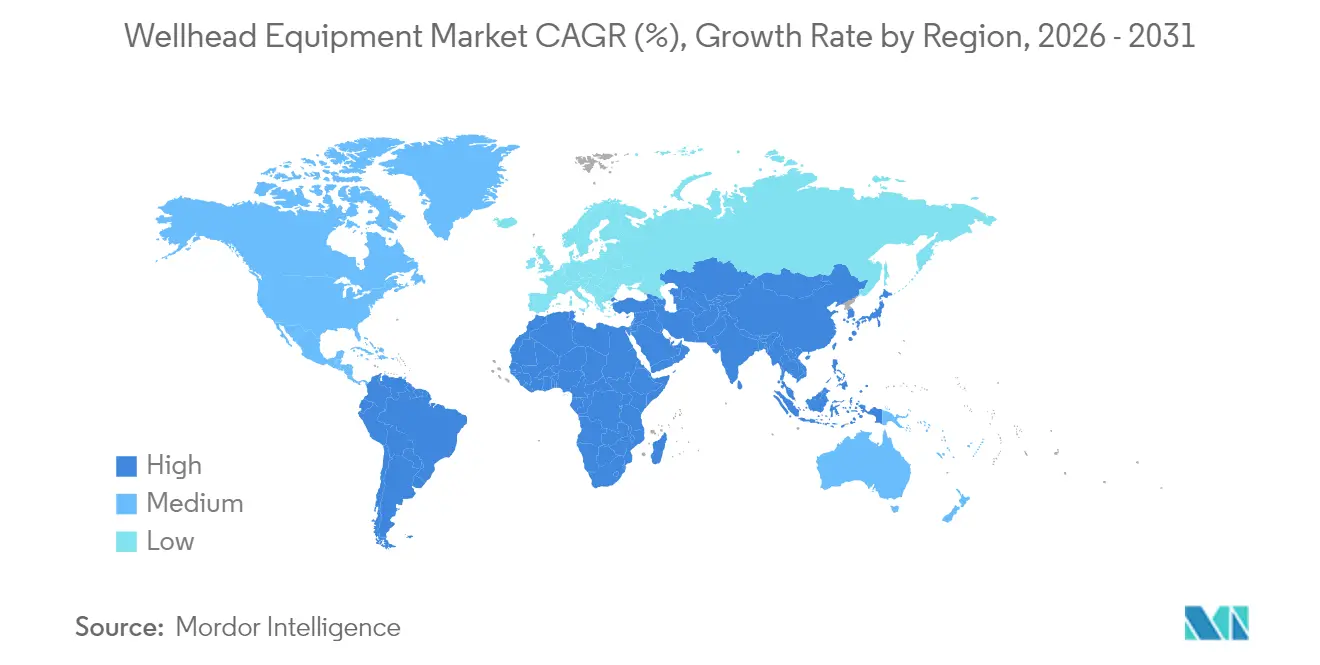
- By geography, the Middle East and Africa contributed 34.60% of global revenue in 2025, yet Asia-Pacific is expected to post the strongest 7.33% CAGR to 2031.
Note: Market size and forecast figures in this report are generated using Mordor Intelligence’s proprietary estimation framework, updated with the latest available data and insights as of 2026.
Market Trends and Insights
Drivers Impact Analysis of Wellhead Equipment Market*
| Driver | (~) % Impact on CAGR Forecast | Geographic Relevance | Impact Timeline |
|---|---|---|---|
| Surging shale & tight-oil well count | +1.20% | North America, Argentina Vaca Muerta | Medium term (2–4 years) |
| Deep-water & HP/HT project pipeline expansion | +1.80% | Global offshore, Brazil pre-salt, West Africa | Long term (≥ 4 years) |
| Ageing wellhead replacement cycle | +0.90% | North America, Europe North Sea | Short term (≤ 2 years) |
| Geothermal & CCS wells requiring new heads | +0.70% | Global, focus on EU and North America | Long term (≥ 4 years) |
| Methane-leak regulations driving retrofits | +0.60% | Global, led by North America and EU | Medium term (2–4 years) |
| Digital-twin-enabled “smart” wellheads | +0.50% | Global, early uptake in North America | Medium term (2–4 years) |
| Source: Mordor Intelligence | |||
Surging Shale & Tight-Oil Well Count
Unconventional drilling continues to ramp up equipment demand as record fracture-stage counts rise in formations such as Argentina’s Vaca Muerta, where 14,722 stages were completed in 2024, a 17.6% year-on-year increase. Multi-well pad strategies intensify the volume of heads required per rig move, while pressure ratings above 10,000 psi and advanced seal systems push average selling prices higher. North American service companies export technology and crews to Latin America, accelerating the adoption of standardized, quick-connect tree designs that shorten rig time. Suppliers that bundle heads with frac iron and field monitoring platforms capture a larger share of the wallet. Despite price volatility in shale basins, replacing legacy designs with corrosion-resistant alloys remains steady, safeguarding baseline demand.
Deep-Water & HP/HT Project Pipeline Expansion
Orders for 20,000-psi subsea trees and fatigue-resistant wellhead housings are rising as operators progress Johan Sverdrup Phase 3, BP’s Greenfield 20K, and Petrobras pre-salt developments.(1)Source: TechnipFMC, “TechnipFMC Awarded Johan Sverdrup Phase 3,” technipfmc.com These projects operate in water depths beyond 2,000 m and bottom-hole temperatures above 350°F, driving stringent metallurgy specifications. Extended manufacturing lead times create multi-year revenue visibility for qualified vendors, while integrated digital-sensor arrays embedded in subsea heads enable real-time integrity tracking. The complexity of HP/HT completions boosts aftermarket service intensity, with OEMs retaining high-margin inspection and re-certification contracts. As deepwater breakevens fall, sanctioned West Africa and the Eastern Mediterranean projects enlarge the global install base for premium wellhead assemblies.
Ageing Wellhead Replacement Cycle in OECD Fields
North Sea and Gulf of Mexico producers are replacing 1970s-era heads to meet contemporary leak-rate thresholds set by regulators.(2)Source: Bureau of Safety and Environmental Enforcement, “Wellhead Safety Notice,” bsee.gov Operators favour modular retrofit kits that minimize platform downtime. Norway’s rig scarcity tightens scheduling, pushing companies to pre-order complete head-and-tree packages. Updated designs integrate metal-to-metal sealing and remote greasing points to cut intervention costs. Replacement programs often coincide with well life-extension projects that boost recovery factors, anchoring tubing-hanger upgrades and secondary seals inventories. Vendors offering turnkey swap-out services, including hydraulic line tie-ins and digital pressure-testing logs, gain stickier client relationships.
Geothermal & CCS Wells Requiring High-Integrity Heads
SuperHot Rock EGS pilots expose wellheads to temperatures surpassing 400 °C, forcing OEMs to adopt nickel-based alloys and elastomer-free seals. CCUS sites inject supercritical CO₂ that forms carbonic acid, accelerating corrosion in conventional chrome steels. Equipment suppliers leverage oil-and-gas pressure-control know-how to create dual-barrier designs certified under ISO 27914. National labs in the United States and Europe test hydrogen-ready sealing stacks, granting early-mover advantage to vendors with proprietary metal gaskets. Governments channel grants toward geothermal demonstration programs, generating firm purchase orders even as oil prices fluctuate.
Restraints Impact Analysis of Wellhead Equipment Market*
| Restraint | (~) % Impact on CAGR Forecast | Geographic Relevance | Impact Timeline |
|---|---|---|---|
| Crude-price volatility curbing E&P capex | –0.8% | Global, concentrated in North America | Short term (≤ 2 years) |
| Energy-transition-led capital reallocation | –0.6% | Global, led by Europe and North America | Long term (≥ 4 years) |
| Hydrogen embrittlement risks | –0.4% | Global, focused on hydrogen projects | Medium term (2–4 years) |
| Shortage of certified wellhead technicians | –0.3% | Global, acute in North America and Middle East | Medium term (2–4 years) |
| Source: Mordor Intelligence | |||
Crude-Price Volatility Curbing E&P Capex
US upstream capex fell 4% to USD 61.7 billion in 2024 and is expected to slide further to USD 60.1 billion in 2025, delaying new-well programs and trimming head orders.(3)Source: RBN Energy, “US E&P Capex Outlook,” rbnenergy.com Tight budgets favour quick-payout tie-backs over greenfield drilling, reducing the immediate pool of hardware demand. Vendors respond by offering flexible delivery schedules and dynamic pricing tied to Brent benchmarks. While Middle East national companies sustain drilling momentum, North American independents intermittently idle rigs, causing lumpy quarterly bookings for OEMs.
Energy-Transition-Led Capital Re-allocation
European majors deploy rising investment shares toward renewables and hydrogen, diverting funds from long-cycle offshore projects. The reallocations slow the approval of conventional wells, compressing the future pipeline of head installations. However, crossover plays—geothermal, CCUS, and blue hydrogen—offer offsetting demand for pressure-control expertise. Equipment suppliers diversify by launching product lines specifically marketed as “energy-transition ready,” smoothing exposure to declining oil-only spending.
*Our forecasts treat driver/restraint impacts as directional, not additive. The impact forecasts reflect baseline growth, mix effects, and variable interactions.
Wellhead Equipment Market Segment Analysis
By Component:
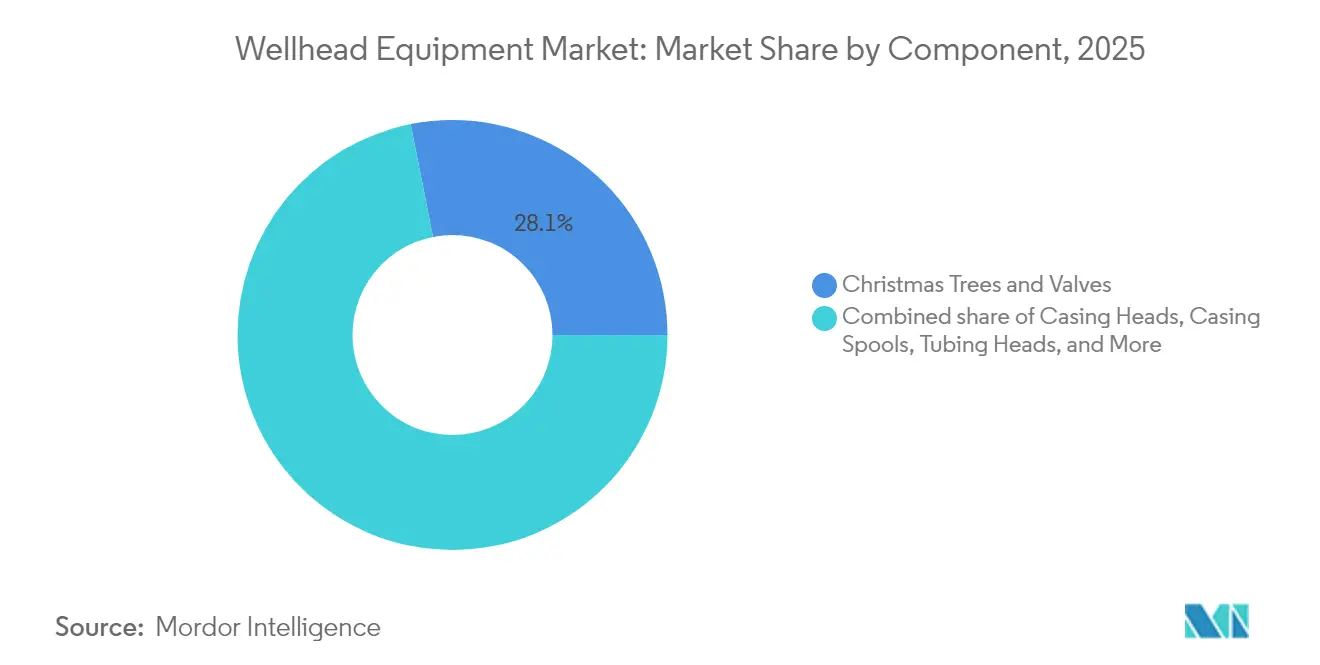
Christmas Trees & Valves Lead Market TransformationChristmas Trees & Valves generated 28.12% of revenue in 2025, cementing their position as the largest wellhead component group within the wellhead equipment. Rising completion complexity in shale and deepwater projects drives premium demand for high-spec trees with integrated flow meters and electric chokes. The wellhead equipment market size attached to these intelligent assemblies is projected to grow at 7.72% CAGR through 2031 as operators prioritize production optimization. Casing heads and spools maintain steady offtake, anchored by greenfield drilling and life-extension work in OECD basins. Secondary seals and casing hangers enjoy an aftermarket uplift as methane regulations impose tighter leak-rate thresholds.
Integrating digital modules within Christmas Trees supports remote troubleshooting, reducing intervention costs and prolonging seal life. Service models evolve toward subscription-based analytics, wherein suppliers monitor vibration and temperature data to predict gasket wear. Tubing hanger sales rise in concert with multi-zone completions that lift stage counts per well. Other specialized valves—including retrievable subsurface safety valves—benefit from higher offshore safety requirements, adding diversity to supplier revenue streams.


By Location:
Offshore Growth Outpaces Onshore DominanceOnshore fields accounted for 70.30% of global revenue in 2025, reflecting the density of active land rigs and the scale of shale drilling programs. Onshore wellhead equipment market share is expected to narrow slightly by 2031 as offshore sanctioning accelerates. Offshore demand, supported by Brazil’s pre-salt, West Africa gas and Norwegian ultra-deepwater tie-backs, is set to grow at 8.06% CAGR, outpacing total market expansion. Shelf developments in the Middle East add a mid-water growth layer using standardized heads rated between 5,000 and 10,000 psi.
Higher technical complexity of offshore wells elevates average selling prices and boosts aftermarket service intensity. Vendors that deliver single-vendor trees, control pods, and running tools secure lifecycle contracts spanning 20 years. Subsea tie-back trends increase the count of trees per host platform, while remote intervention capabilities reduce helicopter trips and improve safety. Onshore suppliers respond by advancing quick-latch head systems that cut rig NPT and lower cost per frac stage.
By Pressure Rating:
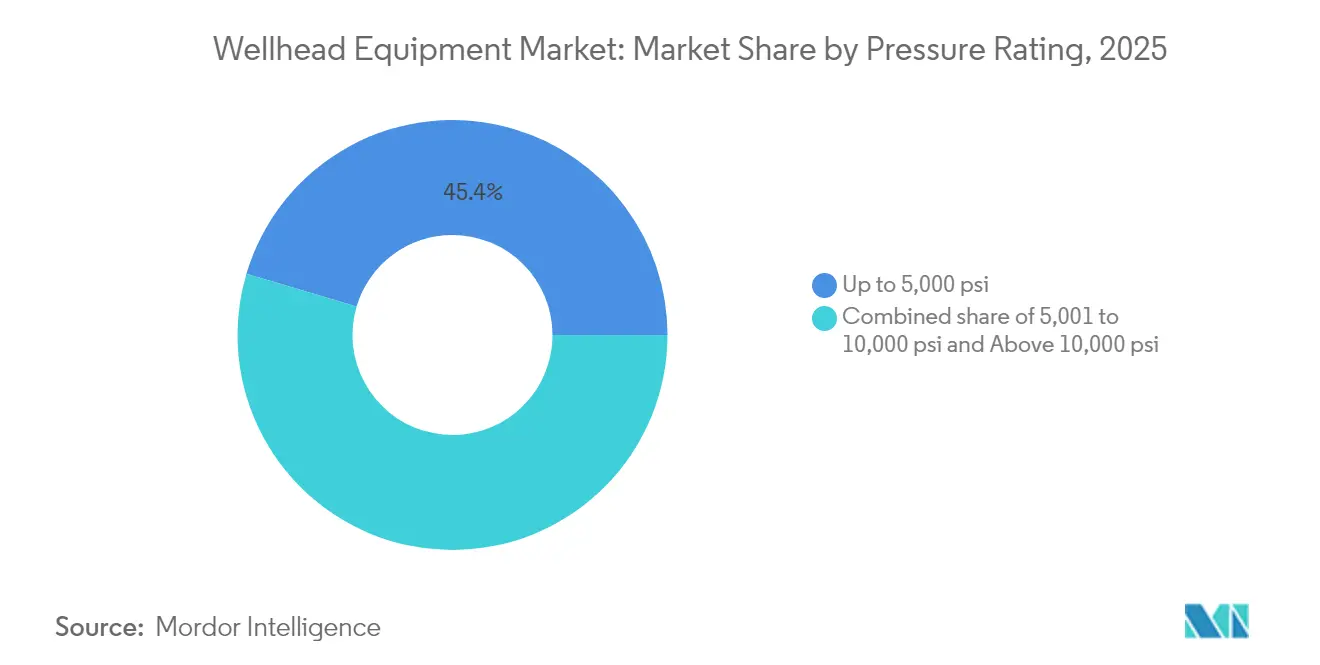
High-Pressure Applications Drive InnovationSystems rated below 5,000 psi held a 45.40% share in 2025, serving conventional land wells across the Middle East, Russia, and Asia. Yet the premium tier of above-10,000 psi heads is forecast to post a 8.78% CAGR, capturing rising HP/HT activity in US Gulf deepwater and international shale basins. Operators demand forged-steel bodies, cladded flanges, and metal-to-metal seals that withstand cyclic loadings at extreme temperatures. The wellhead equipment market size for the 5,001–10,000 psi band remains sizable, underpinned by shelf and deepwater projects in West Africa and Southeast Asia.
Regulatory updates within API 6A strengthen testing protocols, compelling OEMs to invest in higher-capacity pressure loops and advanced NDT. The technology race centres on corrosion-resistant alloys and additive-manufactured choke components that trim weight without sacrificing strength. High-pressure heads command price premiums that offset lower unit volumes, sustaining revenue growth for specialized fabricators.
By Well Type:
Oil Wells Maintain Leadership Despite CCS EmergenceOil wells produced 57.60% of global sales in 2025, reaffirming the centrality of crude production to the wellhead equipment market. Natural-gas wells, especially in North American shale and Qatari expansion projects, rank second in volume but face modest growth as LNG markets balance. However, small in base, geothermal wells and CCS/H₂ storage applications exhibit double-digit momentum, supported by global decarbonization policies. As governments finance carbon-capture hubs, the wellhead equipment market size for CCS-ready heads is projected to rise with a 9.6% CAGR through 2031.
Thermal resilience and CO₂ compatibility differentiate the emerging product lines. Vendors repurpose oil-and-gas expertise to validate metal-seated valves that resist superheated brine in geothermal contexts. Hydrogen-service heads undergo fracture-toughness tests at low temperatures to meet embrittlement standards. Cross-training of field crews accelerates adoption, while blended procurement across well types allows operators to leverage existing supplier relationships.
By Application:
Production Stage Gains MomentumDrilling absorbed 51.40% of revenue in 2025 because every new bore requires a surface pressure-control assembly. Completion heads, tailored for multi-stage fracs and zonal isolation, follow in-demand hierarchy and integrate sensors for downhole pressure verification. Production applications are forecast to see the highest 8.55% CAGR as operators focus on maximizing existing reservoir output. Remote-controlled choke systems and electric submersible pump feed-through heads increase uptake of production-stage hardware.
The shift toward production optimization drives long-term service contracts that bundle hardware with digital monitoring. Completion intensity in tight reservoirs raises the count of sleeve-ready tubing hangers and retrievable packer heads per well. Digital work instructions cut rig time during installation, offsetting higher component complexity. Over time, lifecycle service revenues may eclipse original equipment sales for leading suppliers.
Geography Analysis
MEA Wellhead Equipment Market
The Middle East and Africa generated 34.60% of worldwide revenue in 2025, bolstered by Saudi Aramco and ADNOC drilling programs prioritizing onshore and offshore capacity additions. The region benefits from low break-even costs and state budgets that shield capex from short-term price swings. Nevertheless, geopolitical risks and rig-rate fluctuations occasionally disrupt project sequencing, leading to contract suspensions such as Aramco’s partial stand-down in late 2024. Local-content policies motivate OEMs to establish regional manufacturing hubs and apprenticeship pipelines.
APAC Wellhead Equipment Market
Asia-Pacific is projected to be the fastest-growing region at 7.33% CAGR, driven by China’s breakthrough ultra-deep drilling to depths beyond 8,000 m and India’s offshore block awards in the Bay of Bengal. Chinese suppliers scale up high-pressure tree production, challenging incumbent multinationals on price while meeting domestic content rules. Southeast Asian NOCs commit to gas monetization projects to backfill declining fields, raising demand for 10,000 psi heads. Australia progresses LNG backfill wells requiring HP/HT trees, and emerging geothermal pilots in Indonesia and the Philippines create additional specialty orders.
The Americas and Europe Wellhead Equipment Market
North America remains technologically influential despite capex discipline, as shale players continually refine pad-drilling logistics and remote wellhead automation. OEMs pilot electric-actuated valves to eliminate site pneumatics, aligning with methane-reduction goals. Europe focuses on North Sea life-extension, where decommissioning deferrals spur investments in new heads to ensure integrity. Norway’s rig shortage pushes operators to lock in hardware far ahead of spud dates. South America’s growth leans on Argentina’s Vaca Muerta, where record fracture-stage counts lift demand for quick-turnaround casing heads, and Brazil’s pre-salt, which favours 20,000-psi subsea trees. Like Brazil’s BNDES credit lines, regional financing structures incentivize local assembly, fostering joint ventures between global OEMs and domestic yards.

Regulatory Landscape
Wellhead equipment is governed by offshore safety rules and globally referenced equipment standards that shape design, qualification, and documentation. In the United States Outer Continental Shelf, the Bureau of Safety and Environmental Enforcement (BSEE) requirements under 30 CFR 250, Subpart G govern well operations and equipment, including expectations that wellhead assemblies have a rated working pressure exceeding anticipated wellhead pressure; operators also use BSEE inspection checklists (B-PINCs) as an operational compliance anchor.
Standards updates continue to tighten conformance obligations for OEMs and their supply chains. API Specification 6A (Twenty-First Edition) issued Addendum 4 in November 2024, including qualification requirements that tie closure bolting to API 20E or API 20F, reinforcing material traceability and manufacturing controls for wellhead and tree equipment. In Europe, the European Commission updated harmonised standards supporting the Pressure Equipment Directive (2014/68/EU) via an Implementing Decision effective in early 2026, bringing current references for items such as flanges, industrial valves, and overpressure protection devices into closer alignment with procurement specifications used for pressure-containing components in wellhead packages.
Competitive Landscape
Market consolidation intensified when SLB closed its USD 7.7 billion purchase of ChampionX in July 2025, integrating downhole chemical, surface-pressure, and digital-wellhead portfolios. Baker Hughes formed a strategic venture with Cactus Wellhead in June 2025, combining global service reach with quick-connect land tree technology to target 20,000-psi applications. TechnipFMC deepened its subsea franchise by booking multiple awards for Johan Sverdrup Phase 3 and BP’s Greenfield 20K, underscoring a pipeline of deepwater orders.
Medium-sized specialists such as Dril-Quip and Cactus build share by focusing on niche innovations—conductor-sharing subsea wellheads and rapid-latch hanger systems—that shorten rig time. Regional entrants in China, led by Jereh Group, supply price-competitive heads for domestic shale, while licensing international patents for higher-spec offshore designs. Digital service differentiation becomes a key battleground as OEMs embed analytics, cybersecurity, and emissions-monitoring capabilities into hardware. Vendors with integrated data platforms secure multi-year SaaS subscriptions that improve margins and customer stickiness. Portfolio pivot toward geothermal and CCUS continues; NOV reports early contracts supplying 400 °C-rated heads for an EGS pilot in Utah.
Wellhead Equipment Industry Leaders
Baker Hughes Company
Weatherford International plc
Weir Group PLC
Schlumberger Limited
NOV Inc.
- *Disclaimer: Major Players sorted in no particular order
Wellhead Equipment Market Companies Covered in this Report
- Baker Hughes Co.
- Schlumberger Ltd.
- TechnipFMC plc
- Weatherford International plc
- NOV Inc.
- Weir Group plc
- Oil States International Inc.
- Forum Energy Technologies Inc.
- Cactus Inc.
- Great Lakes Wellhead Inc.
- Aker Solutions ASA
- Dril-Quip Inc.
- Cameron (Subsidiary of SLB)
- Hunting plc
- Jereh Group
- Delta Corporation
- Dongying Haixin Petroleum
- Saigao Group
- Vigor Drilling Equipment Co.
- Yulin Machinery Corp.

Market Opportunities and Future Outlook
Opportunity is consolidating around premium, qualified tree and wellhead systems as high-pressure subsea projects expand and standardized delivery models move into repeatable contracting. The shift toward 20,000 psi subsea production systems for Paleogene reservoirs is being carried through named projects and contract awards, including bp developments in the Gulf of Mexico and iEPCI-style contracting. TechnipFMC received an iEPCI award from bp for the Tiber 20K project (January 2026), and SLB OneSubsea won an EPC contract for Eni’s Baleine Phase 3 offshore Cote d'Ivoire (July 2026) covering 13 wells.
Demand is also shifting toward simpler, intervention-ready product designs that reduce stack complexity while still meeting stringent material and sour-service requirements. In February 2026, Expro launched Solus, a single shear and seal ball valve positioned to replace traditional two-valve subsea well access arrangements and specified as compliant with API Std 17G and NACE MR0175, supporting fewer components and faster subsea operations. At the same time, national and IOC contracting is reinforcing in-country value and localized assembly for surface equipment and related wellhead packages, including SLB securing five-year contracts with Petroleum Development Oman in January 2026 covering low- and high-pressure wellheads and thermal wellhead systems with assembly localized in Oman. Together, standardization, localization, and lifecycle serviceability support differentiated offerings that bundle hardware with inspection, recertification, and digital integrity workflows across drilling, completion, and production stages.
Recent Industry Developments in Wellhead Equipment Market
- July 2026: Superior Energy Services closed its acquisition of Sonic Holdings, LLC, adding drilling wellheads, production equipment, and electric feed-through (EFT) technologies to its portfolio. The deal expands capabilities that support well construction and production-stage interfaces, strengthening offerings where operators value integrated equipment and field support.
- May 2026: Baker Hughes announced an extension and expansion of its integrated well construction contract with Petrobras for deepwater development in Brazil's Santos Basin. The scope reinforces demand for coordinated well construction packages that align drilling and completion workflows with deepwater project execution.
- January 2026: Baker Hughes completed the contribution of its Surface Pressure Control product line, including wellhead and production tree equipment, into a joint venture with a subsidiary of Cactus, Inc., while retaining a 35% stake. The closing reshapes competitive positioning in surface pressure control by combining Baker Hughes' installed-base and service reach with Cactus' land wellhead technology focus.


Wellhead Equipment Market Report Scope and Research Methodology
Market Definition and Coverage
This market covers the value of wellhead equipment used at the surface or seabed interface of oil, gas, geothermal, and storage wells to control pressure, suspend casing and tubing, and connect the well to drilling, completion, and production systems.
Scope exclusions: We exclude upstream drilling and completion services, routine maintenance labor, and non-wellhead surface facilities that sit beyond the wellhead and tree connection point.
Segments Covered in This Report
- By Component
- Casing Heads
- Casing Spools
- Tubing Heads
- Casing Hangers
- Secondary Seals
- Tubing Hangers
- Christmas Trees and Valves
- Other Components
- By Location
- Onshore
- Offshore (Shelf, Deep-, Ultra-deep)
- By Pressure Rating
- Up to 5 000 psi
- 5,001 to 10,000 psi
- Above 10 000 psi (HP/HT)
- By Well Type
- Oil
- Gas
- Geothermal
- CCS/H₂ Storage
- By Application
- Drilling
- Completion
- Production
- By Geography
- North America
- United States
- Canada
- Mexico
- Europe
- Germany
- United Kingdom
- France
- Italy
- Spain
- Russia
- Rest of Europe
- Asia Pacific
- China
- India
- Japan
- South Korea
- ASEAN Countries
- Australia
- Rest of Asia-Pacific
- South America
- Brazil
- Argentina
- Chile
- Rest of South America
- Middle East and Africa
- Saudi Arabia
- United Arab Emirates
- South Africa
- Egypt
- Rest of Middle East and Africa
- North America
Data Sources, Market Sizing, and Validation
Desk Research
Desk work starts with building the demand context for wells and pressure regimes, then mapping how those translate into equipment needs. We rely on public sources such as the US EIA, IEA, OPEC, and national regulators for upstream activity, along with rig counts and well counts from widely cited public dashboards and exchange disclosures where available. For offshore and complex wells, directional trends are cross-checked using sources such as BOEM, national petroleum ministries, and selected peer-reviewed papers on HP-HT integrity and well containment.
On the supply side, we use company annual reports, investor presentations, press releases, and tender award notices to understand product mix, pricing direction, and order timing. Patent databases are also referenced to see where new sealing and pressure-control designs are being filed, which helps test the realism of technology adoption assumptions. When needed, a paid subscription focused on company financials and a shipment-level import/export database are used to sanity check revenue ranges and trade flows for critical components. The specific desk sources listed above are illustrative, and other public documents were also reviewed for data collection, clarification, and validation.
Primary Interviews and Surveys
Primary interviews and surveys are used to pressure-test the model assumptions that are not directly observable from public statistics, especially average wellhead content per well, pressure-rating mix, and typical replacement cycles across mature basins. We spoke with a mix of equipment manufacturers, distributors, EPC and service-side stakeholders, and upstream operators across major producing regions so that regional well designs and procurement practices could be reflected consistently in the final numbers.
Distribution of primary research fieldwork respondents
| Company type | Respondent position | Region |
|---|---|---|
| Top tier: 37% | CXOs: 16% | APAC: 40% |
| Mid tier: 47% | Functional/Unit leaders: 25% | EMEA: 33% |
| Smaller Players: 16% | Managers: 59% | Americas: 27% |
Market-Sizing & Forecasting
Sizing begins with a top-down build that reconstructs demand from upstream activity indicators, then ties that demand to equipment intensity by location and pressure class. For example, new well counts, offshore project starts, and the share of HP-HT wells are converted into expected wellhead system volumes, then translated into value using blended pricing by pressure rating and installation environment. To avoid over-counting, the same well is not valued twice across drilling, completion, and production, and the equipment is attributed to the stage where it is primarily installed or upgraded.
Bottom-up checks are then used to keep the totals realistic, including sampled supplier revenue splits for wellhead lines, channel checks on order books, and ASP x volume sanity checks for common components such as casing spools, tubing heads, hangers, and secondary seals. Inputs that most often move the model include rig count and footage trends, onshore versus offshore well mix, deepwater share, pressure-rating distribution (including above 10,000 psi), and localized inflation in steel and machining-heavy parts. Forecasting uses scenario analysis supported by expert consensus on upstream capex cycles, project sanction timing, and expected pricing progression, and gaps are handled by applying regional proxy ratios when local well counts or pressure splits are not reported consistently.
Data Validation & Update Cycle
Model outputs are validated through multiple passes that look for variance versus independent signals, including upstream spending trends, announced drilling programs, and major offshore project timelines. If a region shows an abnormal jump, the assumptions are reopened, and follow-up calls are triggered to confirm whether the change is from price, mix shift, or a true volume step-up. Before sign-off, the calculations and logic are reviewed by another analyst to catch unit mismatches, double counting, or inconsistent currency timing.
The report is refreshed annually, and interim updates are made when material events occur, such as sharp oil price moves, large project deferrals, or notable changes in well containment regulations. Right before delivery, we run a final update pass so the numbers reflect the latest public releases and the most recent validation inputs from the field.
Mordor Intelligence's Wellhead Equipment Market Size Compared With Other Published Estimates
Published market sizes for wellhead equipment can look far apart even when they discuss the same upstream industry, because the counted items and the year anchors are not always aligned. The biggest drivers are usually what gets grouped under the term wellhead, how services are treated, and how fast pricing is assumed to move across pressure ratings.
Some estimates fold in broader pressure-control and lifecycle spending, including installation and operational activities, which can push the total upward. In Mordor Intelligence, the value is kept tied to defined wellhead equipment components and their use across onshore, offshore, and HP-HT conditions, and adjacent service spending is not treated as equipment revenue unless it is clearly sold as part of the equipment package.
Benchmark comparison
| Source | Market Size | Gaps in Research Methodology |
|---|---|---|
| Mordor Intelligence | USD 7.60 B (2026) | |
| Global Consultancy A | USD 7.34 B (2025) | Uses a different base year and can apply broader spending capture that references installation and operational activities, which may not separate equipment-only revenue cleanly across regions. |
| Industry Publisher B | USD 5.72 B (2025) | May apply a narrower equipment definition and a more conservative pricing progression, and the treatment of related services and component scope can vary by product taxonomy. |
The spread in the table is mostly explained by scope choices and timing, since a 2025 anchor and a 2026 anchor can already reflect different activity and pricing conditions. By keeping the inputs traceable to well counts, offshore mix, and pressure-rating splits, the model remains repeatable and easier to reconcile when new upstream signals or pricing updates come in.


Key Questions Answered in the Report
What is the current size of the wellhead equipment market?
The wellhead equipment market size stood at USD 7.6 billion in 2026 and is projected to reach USD 9.84 billion by 2031.
Which component segment is growing the fastest?
Christmas Trees and Valves lead growth, expanding at an 7.72% CAGR through 2031 due to rising completion complexity and demand for smart surface-control systems.
Why is Asia-Pacific the fastest-growing regional market?
Breakthrough ultra-deep drilling in China and offshore block awards in India drive a 7.33% CAGR, supported by evolving local manufacturing ecosystems.
How are methane regulations affecting equipment demand?
Stricter leak-detection rules in the US, EU and Canada are triggering retrofit programs for upgraded seals and IoT-based monitoring heads, lifting aftermarket revenue.
What role do digital twins play in modern wellheads?
Digital-twin-enabled wellheads stream real-time data, support predictive maintenance and allow remote pressure adjustments, lowering operating costs and boosting uptime.
How will energy transition trends influence the market?
While some capital migrates to renewables, geothermal and CCS projects create new demand for high-integrity heads, enabling suppliers to diversify beyond oil and gas.
Page last updated on:


 Your data is secure and never sold or shared.


