
Well Cementing Services Market Size and Share
Market Overview
| Study Period | 2021 - 2031 |
|---|---|
| Market Size (2026) | USD 11.6 Billion |
| Market Size (2031) | USD 14.98 Billion |
| Growth Rate (2026 - 2031) | 5.25 % |
| Fastest Growing Market | Middle East and Africa |
| Largest Market | North America |
| Market Concentration | Medium |
Major Players *Disclaimer: Major Players sorted in no particular order Image © Mordor Intelligence. Reuse requires attribution under CC BY 4.0. | |
Well Cementing Services Market Analysis by Mordor Intelligence
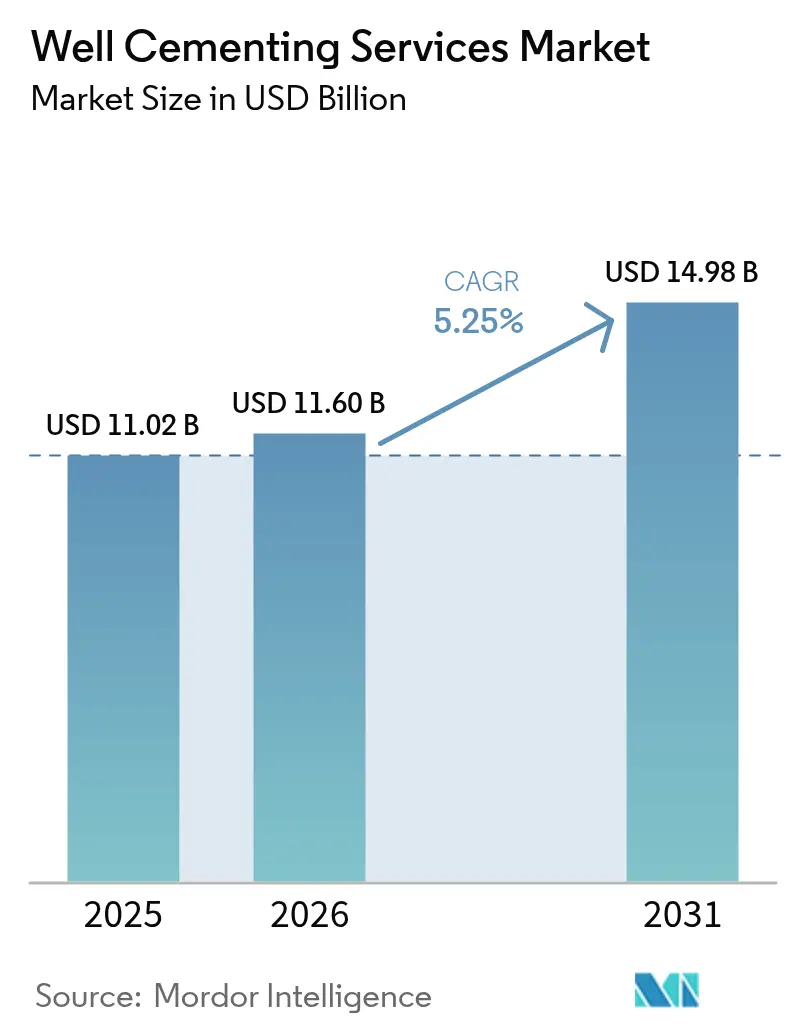
The Well Cementing Services Market size was valued at USD 11.02 billion in 2025 and estimated to grow from USD 11.6 billion in 2026 to reach USD 14.98 billion by 2031, at a CAGR of 5.25% during the forecast period (2026-2031).
Demand strength reflects sustained unconventional drilling, the restart of deep-water projects, and mandated well-integrity rules that elevate specialty cement usage. Automated cementing fleets, digital twins, and real-time downhole sensing enhance placement accuracy and reduce non-productive time, providing service providers with a cost-efficiency story that resonates with operators focused on capital discipline. Refracturing programs across North American shale and early CO₂-storage well buildouts diversify revenue streams, while rising offshore activity in Brazil, the Gulf of Mexico, and West Africa broadens geographic exposure. Pricing pressure remains a watch point, yet vertical integration and technology-centric differentiation offset margin risk for the largest suppliers.
Key Report Takeaways
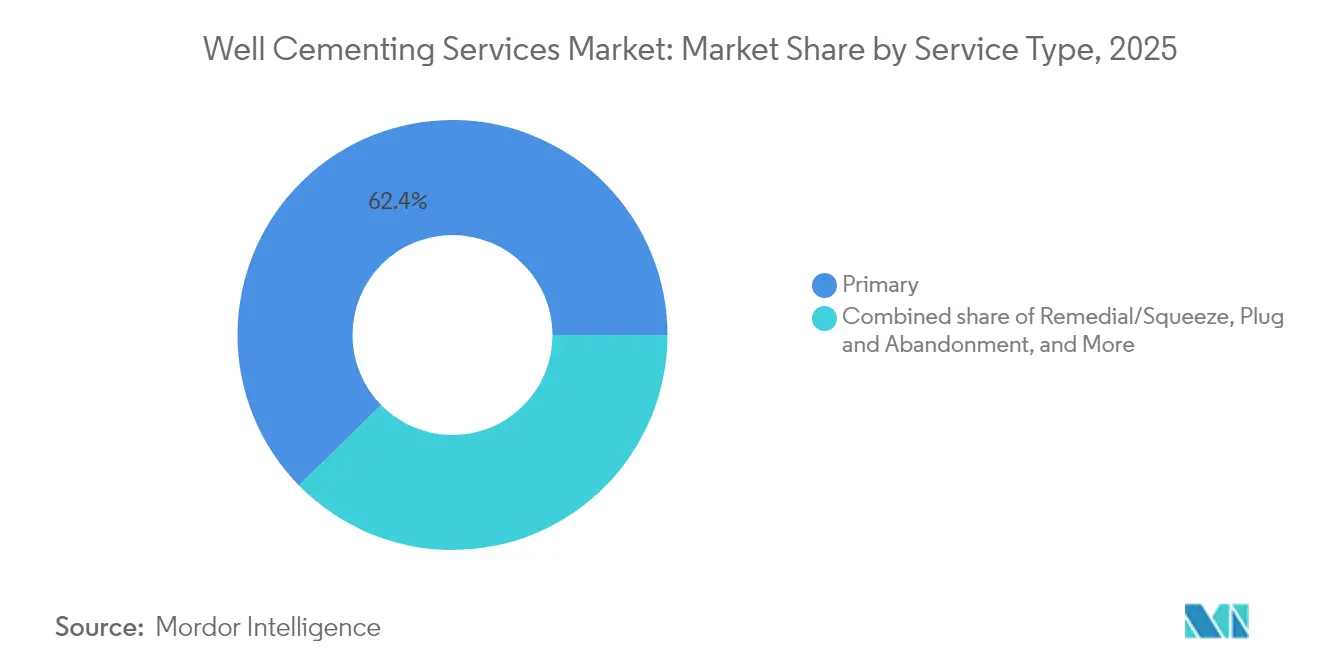
- By service type, primary cementing held 62.35% of the well cementing services market share in 2025; remedial and squeeze cementing is projected to expand at a 6.52% CAGR to 2031.
- By well type, horizontal wells accounted for 43.12% of the well cementing services market size in 2025 and are projected to advance at a 5.66% CAGR through 2031.
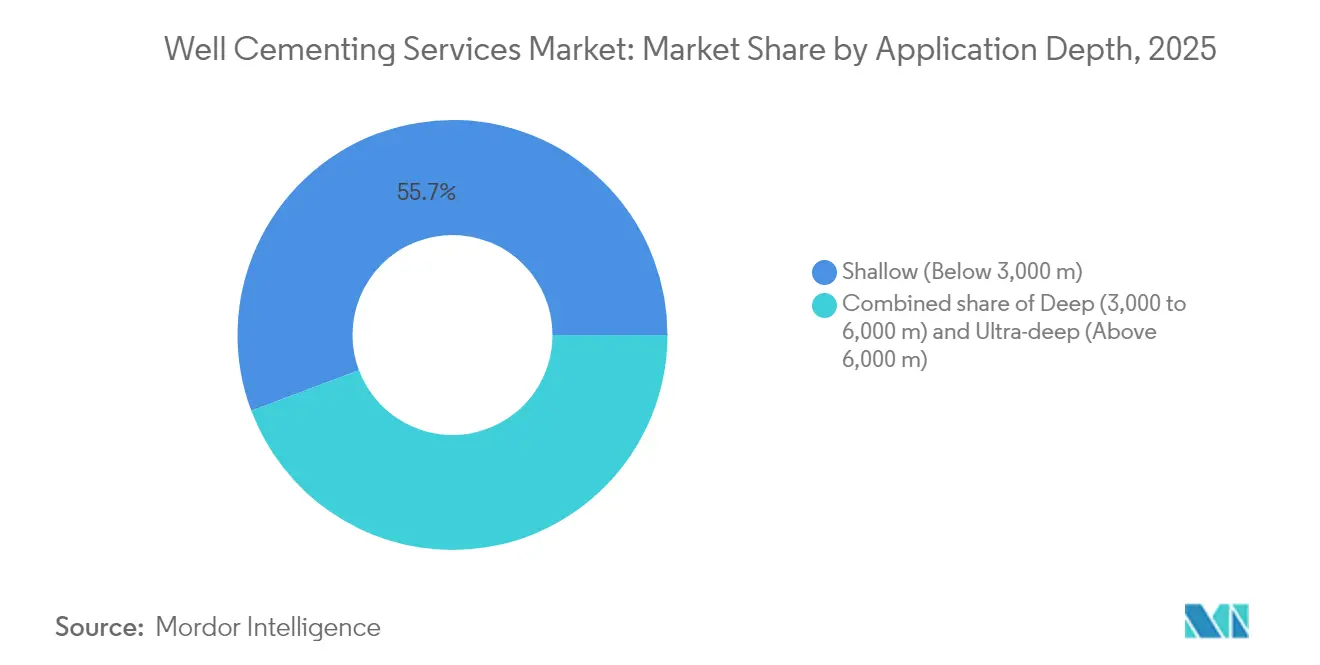
- By application depth, ultra-deep wells represent the fastest trajectory with an 8.26% CAGR through 2031, while shallow wells remained the largest revenue contributor at 55.74% in 2025.
- By location of deployment, the offshore segment is forecast to rise at a 7.58% CAGR to 2031, whereas onshore operations commanded 68.72% of 2025 revenue.
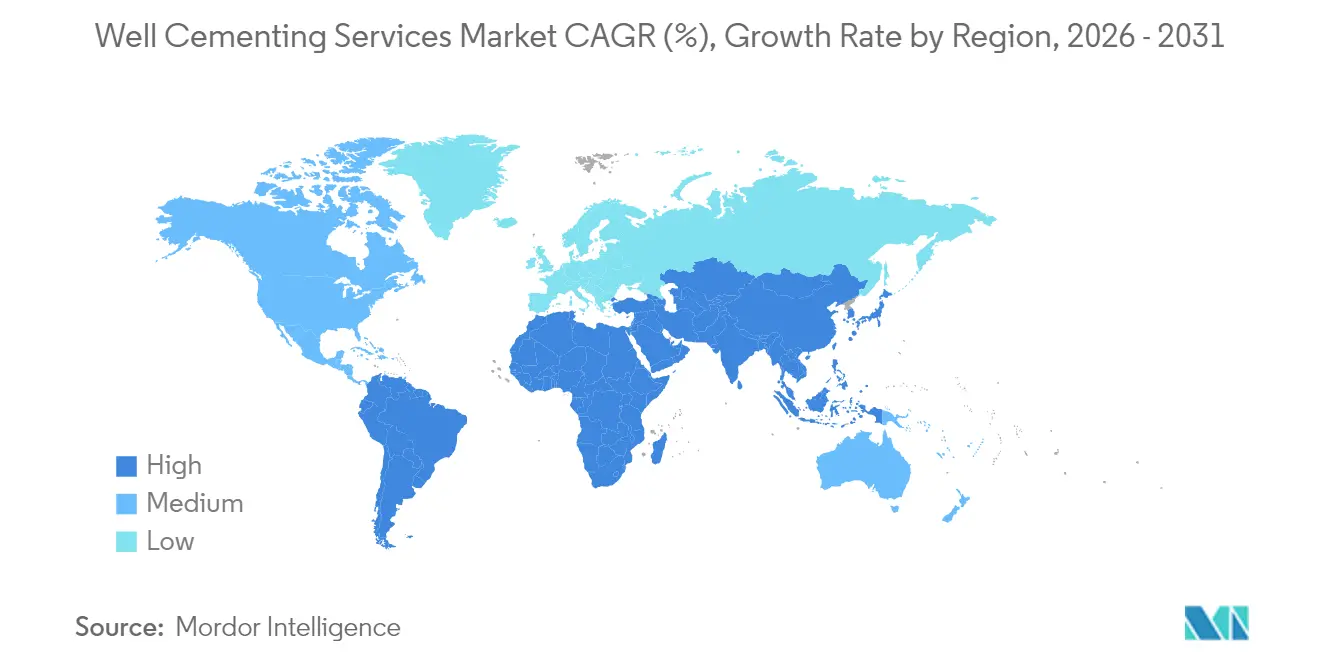
- By geography, the Middle East and Africa region is set to post the fastest 7.24% CAGR through 2031, while North America led with 36.95% revenue share in 2025.
Note: Market size and forecast figures in this report are generated using Mordor Intelligence’s proprietary estimation framework, updated with the latest available data and insights as of 2026.
Global Well Cementing Services Market Trends and Insights
Drivers Impact Analysis*
| Driver | (~) % Impact on CAGR Forecast | Geographic Relevance | Impact Timeline |
|---|---|---|---|
| Surging unconventional well completions | 1.20% | North America core, spill-over to Argentina | Medium term (2-4 years) |
| Revival of offshore deep-water FIDs 2025-2028 | 0.80% | Gulf of Mexico, Brazil, West Africa | Medium term (2-4 years) |
| Mandatory well-integrity regulations | 0.60% | Asia-Pacific & Middle East | Long term (≥4 years) |
| Accelerated refrac programs | 0.70% | Eagle Ford, Permian Basin | Short term (≤2 years) |
| Fully-automated cementing units | 0.40% | Early adoption in North America & Europe | Long term (≥4 years) |
| CO₂-storage injection-well build-out | 0.50% | North America & Europe | Long term (≥4 years) |
| Source: Mordor Intelligence | |||
Surging Unconventional Well Completions Drive Market Expansion
Horizontal shale and tight-formation drilling dominate North American activity and now shape overseas programs in Argentina’s Vaca Muerta. Extended-reach laterals require fiber-reinforced slurries that tolerate cyclic fracturing loads and mitigate lost circulation. Field pilots of foamed cement in low-pressure gradients demonstrated superior flow characteristics and lower formation damage compared to conventional systems.[1]ACS Omega Journal, “Performance of Foamed Cement in Shale Formations,” pubs.acs.org Larger-diameter casing programs elevate pump-rate demand, a shift that suppliers accommodate with high-horsepower automated units. The technological envelope developed for shale is transferable to emerging unconventional plays, providing a repeatable expansion avenue for the well-cementing services market.
Revival of Offshore Deep-Water Projects Accelerates Service Demand
More than 100 deep-water wells under a USD 800 million integrated contract between SLB and Petrobras illustrate the upcoming workload in Brazil’s Campos, Santos, and Espírito Santo basins. Ultra-deep jobs operate at temperatures of up to 525 °F and pressures exceeding 18,000 psi, necessitating shrink-on-heat spacer systems to prevent trapped annulus pressure.[2]OnePetro Library, “Heat-Activated Shrink Spacer for Deepwater Cementing,” onepetro.org Managed-pressure drilling enables cement placement in narrow pore-pressure margins, while digital twins cut commissioning time by validating designs before rig deployment. This technology mix underpins incremental revenue for the well-cementing services market as offshore final investment decisions move forward.
Mandatory Well Integrity Regulations Reshape Regional Markets
Asia-Pacific and Middle East regulators mandate dual-barrier designs, regular pressure test records, and certified high-temperature slurries that exceed API 5CT and 10th edition cement testing criteria.[3]American Petroleum Institute, “Specification 5CT 10th Edition,” api.org Digital well-integrity management systems incorporating analytics and artificial intelligence automate barrier verification and maintenance scheduling. Over 20,000 idle offshore wells identified for abandonment require compliant cement plugs, creating sustained remedial demand. These mandates lock in baseline activity for the well-cementing services market even when drilling cycles soften.
Accelerated Refracturing Programs Boost Remedial Cementing
Eagle Ford refracs delivered triple-digit returns for operators who deploy cemented liners to isolate depleted clusters and reopen new stages. Economic screening suggests that U.S. refracs could increase daily production by 1.28 million barrels of oil and 10.8 billion cubic feet of gas, with costs running 60-70% of those for new wells. Coiled-tubing conveyed diversion agents and high-rate pumps reduce trip time and cost. As asset maturity increases, remedial cementing’s share of the well cementing services market grows faster than that of primary work.
Restraints Impact Analysis*
| Restraint | (~) % Impact on CAGR Forecast | Geographic Relevance | Impact Timeline |
|---|---|---|---|
| Service-price deflation cycles post-2026 | -0.90% | Global, acute in North America | Medium term (2-4 years) |
| Stringent ESG capital-allocation hurdles | -0.70% | Europe & North America | Long term (≥4 years) |
| Loss-circulation in ultra-deep HP/HT wells | -0.40% | Deep-water regions | Long term (≥4 years) |
| Geothermal-cement R&D diverting budgets | -0.30% | Geothermal-active regions | Medium term (2-4 years) |
| Source: Mordor Intelligence | |||
Prolonged Service-Price Deflation Cycles Challenge Profitability
Operator consolidation means fewer tenders and tougher bargaining leverage, pushing day rates down just as suppliers absorb higher R&D and raw material costs. U.S. exploration and production capital plans fell to USD 61.7-65.4 billion in 2024 from USD 66 billion in 2023.[4]Oil & Gas Journal, “US E&P Spending Outlook 2024,” ogj.com SLB’s ChampionX buy targets USD 400 million annual synergies to offset this margin squeeze. Pricing relief will hinge on rig-count recovery, but that may lag as larger producers prioritize dividends over volume growth.
Stringent ESG Capital Allocation Constrains Investment Decisions
Supermajors now allocate larger shares of capex to lower-carbon ventures. ExxonMobil maintains a total spending range of USD 23-25 billion, with a preference for CCUS and hydrogen assets. Upstream drilling, which drives the well cementing services market, faces tougher hurdle rates, especially in Europe, where regulatory scrutiny is intense. Yet, CCUS well construction partially compensates for lost hydrocarbon work, highlighting the advantages of technology overlap.
*Our forecasts treat driver/restraint impacts as directional, not additive. The impact forecasts reflect baseline growth, mix effects, and variable interactions.
Segment Analysis
By Service Type: Primary Cementing Dominates Despite Remedial Growth
Primary cementing generated the largest revenue in 2025 as every new well requires an initial barrier. In absolute terms, this segment underpins two-thirds of the well-cementing services market. Remedial work, however, posts the faster 6.52% CAGR as mature fields worldwide tackle annular pressure and water-shutoff challenges.
Technology differentiation now centers on CO₂-resistant additives, stage-cementing tools certified under API 19AC, and real-time density control. Halliburton’s Fidelis stage cementer, rated to 350°F, illustrates product evolution for multistage unconventional completions. These innovations enable service companies to capture value beyond basic pump time, thereby sustaining pricing power amid competitive bids in the well cementing services market.


By Well Type: Horizontal Wells Lead Growth Trajectory
Horizontal wells captured 43.12% of 2025 revenue thanks to prolific shale plays that use long laterals and high cluster counts. This configuration boosts top-line volumes because larger cement jobs are required to seal extended annuli, and centralization requirements intensify demand for hardware. Vertical wells remain common in conventional projects and CO₂ injection schemes; however, growth is tilting toward horizontals that deliver higher recovery.
Advances, such as Baker Hughes' XtremeSet formulation, tailored for HP/HT horizontals, improve strength retention at 20,000 psi. Uniform placement along a 10,000-ft lateral now benefits from rotating scratcher subs and real-time fluid modeling. These capabilities deepen service intensity, expanding the value pool for the well-cementing services market.
By Application Depth: Shallow Wells Dominate, Ultra-Deep Shows Promise
Shallow wells, those below 3,000 m, still account for over half of segment revenue because they encompass most shale, tight-oil, and conventional onshore wells worldwide. Standard Class G cements meet technical needs, enabling efficient mass production. Deep wells between 3,000 and 6,000 m, widespread in offshore basins, require high-density, low-permeability blends with silica flour to combat strength retrogression.
The ultra-deep subset above 6,000 m is small in volume but posts the quickest 8.26% CAGR. Self-healing epoxies resist micro-annulus development under repeated pressure-temperature cycling, while thixotropic spacers prevent gas intrusion at extreme conditions. Suppliers who field-test these blends gain an early-mover edge in the well-cementing services market.
By Location of Deployment: Onshore Dominance with Offshore Acceleration
Onshore projects accounted for 68.72% of 2025 revenue, as dense rig fleets in the United States, Canada, and the Middle East executed high-volume campaigns. Grid-powered cementing units, such as Hummingbird, reduce fuel costs and emissions, meeting operator ESG targets while trimming operating expenses. The reach of automated bulk plants further improves job readiness and slurry consistency.
Offshore, the 7.58% CAGR reflects a backlog of Brazilian pre-salt, Nigerian deep-water, and Gulf of Mexico projects. All-electric subsea systems and integrated managed-pressure drilling packages now couple with cementing spreads to ensure barrier reliability in narrow operating windows. As these technologies standardize, offshore contribution to the well cementing services market will climb even in lower-price scenarios.
Geography Analysis
North America maintains clear leadership, powered by shale productivity gains, rapid rig mobilization, and an established supply chain of bulk blending plants and pressure-pumping assets. Horizontal laterals now surpass 10,000 feet in the Permian, increasing slurry volumes per well and expanding the revenue base for the well-cementing services market. Electrified field equipment aligns with rising sustainability mandates, helping operators lower their Scope 1 emissions.
The Middle East and Africa region benefits from tier-one carbonate reservoirs that require complex HP/HT cementing and from aggressive gas-capacity additions to support domestic power demand. Mandatory barrier-verification rules and heavy sour-gas chemistry spur the adoption of corrosion-resistant cements, raising average job value. Deep-water discoveries in Namibia, Senegal, and the eastern Mediterranean add frontier upside for the well cementing services market.
The Asia-Pacific region shows steady gains as Malaysia and Indonesia sanction new offshore developments, and as China and Australia test shale pilot wells. A regulatory push for full-life-cycle well-integrity management increases remedial demand, while high geothermal gradients in Indonesia accelerate high-temperature R&D investments. Europe concentrates its spending on plug-and-abandonment campaigns in the North Sea and on geothermal wells in Iceland and Germany, balancing lower hydrocarbon drilling. South America relies on Brazil’s pre-salt drilling cadence and Argentina’s Vaca Muerta growth to anchor regional momentum.

Regulatory Landscape
Well cementing services sit within well-integrity regimes that embed casing and cement program requirements into safety and environmental compliance. In the United States offshore market, the Bureau of Safety and Environmental Enforcement (BSEE) enforces well operations and equipment requirements under 30 CFR Part 250 (Subpart G). The Subpart G framework was updated in January 2026, with inspection and non-compliance guidance such as BSEE's B-PINCs update (January 2026) covering casing, cementing, and well-control elements. These requirements raise expectations for documentation, pressure testing, and barrier verification, which in turn increases demand for certified procedures, QA/QC, and specialty cement systems that can demonstrate performance in HP/HT conditions and narrow-margin operations.
Onshore requirements similarly embed minimum cementing standards into regulation, with U.S. federal onshore drilling on Federal and Indian leases governed by 43 CFR Part 3170 (Subpart 3172), including minimum casing and cementing rules intended to protect usable water and productive zones. State-level rules add additional anchors, and Ohio administrative code 1501:9-1-08 requires cement used in well construction to meet API 10A or ASTM C150/C150M standards, reinforcing standardized slurry material specifications for operators and service companies. Outside the U.S., regulators such as Australia's NOPSEMA emphasize well integrity management across the well life cycle, keeping barrier assurance and verification central to offshore operations and remedial work such as plug and abandonment.
Competitive Landscape
Halliburton, SLB, and Baker Hughes account for a combined majority of global revenue, leveraging integrated portfolios that include surface logging, drilling fluids, and production chemistry. Halliburton’s LOGIX platform enhances job repeatability through remote density control and predictive maintenance, providing operators with confidence in barrier compliance. SLB’s ChampionX integration adds production and artificial-lift synergies, unlocking cross-selling at minimal capital intensity.
Pricing power remains under pressure from operator consolidation; however, technology-led service differentiation helps protect margins. Baker Hughes secured a multi-year Brazilian plug-and-abandonment contract covering cementing, wireline, and intervention services valued at hundreds of millions of dollars. Smaller specialists thrive in niche areas such as expandable casing or lightweight cement additives, but face hurdles scaling automation investments.
Digitalization is the primary competitive battleground. Generative AI engines analyze historical cement job data to recommend optimal slurry blends, while digital twins simulate fluid dynamics in real-time. Early adopters lower design iterations, thereby shrinking well construction costs and strengthening the long-term appeal of the well-cementing services market.
Well Cementing Services Industry Leaders
Schlumberger Ltd
Halliburton Company
Baker Hughes Company
China Oilfield Services
Weatherford International plc
- *Disclaimer: Major Players sorted in no particular order


Market Opportunities and Future Outlook
CCUS and long-life well integrity programs are creating incremental demand for CO2-resistant barrier systems and verification-led cementing workflows, particularly where conventional Portland systems struggle with corrosion risk and sustained annulus pressure. In May 2026, Halliburton deployed its WellLock resin, a polymer-based barrier, in a UAE CO2 injection well, pointing to commercial movement toward non-Portland barriers for corrosive, high-pressure CO2 environments. Operators and NOCs are also validating self-healing and regenerative approaches for zonal isolation, including Kuwait Petroleum Corporation's February 2026 implementation of a self-regenerating cement system validated with ultrasonic bond metrics. This supports a services opportunity around diagnostics, placement assurance, and remediation of micro-annulus and leak pathways.
Lower-carbon cementing and digitized execution are also creating room for service differentiation as operators tighten emissions targets and focus on repeatable delivery. Halliburton reported North Sea deployment of its NeoCem E+ lower-carbon cementing system across more than 135 jobs, citing a 45% to 65% CO2 reduction per volume pumped (June 2026). At the execution layer, automated and intelligent cementing equipment is moving toward tighter density and pressure control and broader digital-twin style monitoring, which creates opportunities for suppliers that combine electric-drive spreads, real-time downhole sensing, and remote cementing control centers to reduce non-productive time and support barrier compliance in both offshore deep-water campaigns and high-volume onshore unconventional programs.
Recent Industry Developments
- June 2026: Halliburton reported field results for its NeoCem E+ lower-carbon cementing system in the North Sea, citing deployment across more than 135 jobs and a 45% to 65% reduction in CO2 emissions per volume pumped. The scale of deployment indicates operator willingness to qualify alternative cement blends at the program level, not only in pilots. This supports a shift toward differentiated, emissions-measured cementing offerings in offshore basins.
- July 2025: SLB won a Northern Endurance Partnership contract to construct six carbon storage wells in the UK North Sea, including cementing and fluids scope. The award links cementing demand to carbon storage well development where long-term barrier integrity and CO2 exposure resistance are central design constraints. It also reinforces integrated contracting models that bundle cementing with adjacent well construction services.
- May 2024: Halliburton launched SentinelCem Pro, a single-sack lightweight cement system positioned for lost-circulation applications. Productization of lightweight, loss-mitigation systems targets an operational risk that drives remedial work, sidetracks, and non-productive time. The launch expands service companies' toolkits for shallow loss zones and unconventional surface casing programs.


Research Methodology Framework and Report Scope
Market Definition and Coverage
This market covers revenues earned from well cementing services used during oil and gas well construction and life-of-well work, where cement slurry is placed to secure casing and isolate zones for safety and production.
Scope exclusions: It excludes sales of cement and additives as standalone products when they are not delivered as part of a cementing service job.
Segmentation Overview
- By Service Type
- Primary
- Remedial/Squeeze
- Plug and Abandonment
- Liner-Tie/Stage Cementing
- By Well Type
- Vertical
- Directional
- Horizontal
- By Application Depth
- Shallow (Below 3,000 m)
- Deep (3,000 to 6,000 m)
- Ultra-deep (Above 6,000 m)
- By Location of Deployment
- Onshore
- Offshore
- By Geography
- North America
- United States
- Canada
- Mexico
- Europe
- Germany
- United Kingdom
- Norway
- Russia
- Rest of Europe
- Asia-Pacific
- China
- India
- South Korea
- ASEAN Countries
- Rest of Asia-Pacific
- South America
- Brazil
- Argentina
- Colombia
- Rest of South America
- Middle East and Africa
- Saudi Arabia
- United Arab Emirates
- Qatar
- South Africa
- Nigeria
- Rest of Middle East and Africa
- North America
Data Sources, Market Sizing, and Validation
Desk Research
Desk research was used to build the initial demand and activity picture, then to anchor the model to observable upstream signals. We reviewed public drilling and well activity statistics from national energy agencies and regulators, and supplemented the regional investment cycle view with OPEC publications. In parallel, we used sources such as EIA datasets, IEA outlooks, and World Bank macro indicators to align assumptions on energy demand, price direction, and capital spending.
To translate activity into service revenue, we cross-checked trade association notes, operator presentations, and company filings that discuss service intensity, and the mix between offshore and onshore work. Where needed, we referenced paid subscriptions for company financials and intelligence, patent databases, and import-export shipment-level views to sanity-check equipment and material flows tied to cementing operations. These sources are illustrative only, and other public references were also used for data collection, validation, and research clarification.
Primary Interviews and Surveys
Primary work focused on validating how a typical cementing job is structured by basin type, and how pricing and utilization shift when drilling programs accelerate or slow down. We interviewed a mix of service providers, field engineering teams, procurement stakeholders, and upstream operators across major producing regions, so our assumptions on service intensity, offshore share, and remedial work frequency could be adjusted to match reported operating conditions.
Distribution of primary research fieldwork respondents
| Company type | Respondent position | Region |
|---|---|---|
| Top tier: 32% | CXOs: 18% | APAC: 45% |
| Mid tier: 47% | Functional/Unit leaders: 35% | EMEA: 29% |
| Smaller Players: 21% | Managers: 47% | Americas: 26% |
Market-Sizing & Forecasting
Sizing starts with a top-down build where drilling and completion activity, combined with onshore and offshore well counts, is converted into a cementing service demand pool by applying cementing intensity factors. Because the job profile varies, we set separate assumptions for primary versus remedial work, then adjust for typical well depth bands and the share of complex wells that require higher service time.
Key inputs used in the model include active rig counts, wells drilled and completed, offshore project pipeline timing, the mix of primary and remedial cementing, and indicative day-rate or job-price movements observed during field discussions. Where public series were not specific enough, we used regional proxies such as drilling footage, well starts, and operator capex signals, followed by a reasonableness check against the activity context.
Forecasts are generated using scenario analysis supported by a light multivariate regression, where upstream spending, oil and gas price expectations, and activity indicators guide the yearly trajectory. Results are then corroborated with selective bottom-up approximations, such as sampled job pricing times estimated job counts, plus channel checks on utilization. These checks are used to tune the final totals rather than replace the activity-led model.
Data Validation & Update Cycle
Validation is done in several passes so the totals remain consistent with operating conditions reported across basins. We compare outputs against independent signals like drilling momentum, offshore award timing, and the observed direction of pricing, then investigate large variances before sign-off. If a number appears inconsistent, we revisit assumptions behind intensity, mix, and regional weighting, and a small set of respondents may be re-contacted for clarification.
The report is refreshed annually, and interim updates are made when material events occur, such as sharp changes in oil prices, major offshore sanction waves, or regulatory shifts that affect well integrity work. Before delivery, the latest public data is rechecked so clients receive an updated view aligned with the most recent market signals.
Mordor Intelligence's Well Cementing Services Market Size Versus Other Published Estimates
Published estimates for well cementing services can differ even when they cover the same topic, mainly because the market is sometimes stretched into adjacent oilfield services, or into cement and additive product revenues. Differences also come from how firms treat offshore complexity, what they assume for job pricing moves, and whether the base year reflects an unusually strong or weak drilling cycle.
In practice, the biggest gaps usually come from scope and conversion logic. Some figures appear to mix well cementing services with broader completion bundles, or they apply one average price across regions without adjusting for deepwater and high-pressure work. The spread also widens when currency timing, inflation pass-through, and refresh cadence are not aligned to updated rig and well activity. This is why the service-only cut and the activity-to-revenue mapping remain central in the market sizing approach built by Mordor Intelligence.
Benchmark comparison
| Source | Market Size | Gaps in Research Methodology |
|---|---|---|
| Mordor Intelligence | USD 11.02 B (2025) | |
| Global Consultancy A | USD 12.50 B (2025) | Often presented with broader inclusions like cementing solutions and material types, which can pull product-linked value into what is labeled as services, and can also weight deep and ultra-deep work more heavily in the average job value. |
| Industry Publisher B | USD 10.47 B (2025) | Typically framed as a wider well cementing market with product outlook and cement composition splits, so some service categories are treated differently, and the activity conversion can lean on higher-level assumptions rather than well and offshore project timing checks. |
The table shows that even for the same year, numbers move mainly when the scope drifts into products or wider well services, or when offshore complexity is priced with a different intensity assumption. By keeping the demand pool tied to drilling and completion activity and then cross-checking with job-level reality checks, the estimate stays traceable to clear inputs that can be revisited as market conditions change.


Key Questions Answered in the Report
What is the current value of the well cementing services market?
The well cementing services market size reached USD 11.6 billion in 2026 and is projected to rise to USD 14.98 billion by 2031.
Which region leads global revenue?
North America led with 36.95% revenue share in 2025, driven by high unconventional drilling density.
What segment is growing the fastest?
Ultra-deep well cementing posts the fastest 8.26% CAGR thanks to frontier exploration and geothermal projects.
How are ESG pressures affecting demand?
Stricter ESG capital allocation slows some hydrocarbon drilling but lifts demand for CCUS and high-integrity cement systems that limit environmental risk.
What role does automation play in cementing services?
Automated units like Halliburton’s LOGIX™ and Baker Hughes’ Hummingbird™ improve slurry accuracy, cut crew exposure, and support cost-efficient operations.
How consolidated is the competitive landscape?
Three integrated providers control more than 65% of global revenue, but niche specialists remain influential in high-end additives and regional markets.
Page last updated on:


 Your data is secure and never sold or shared.


