
Web Performance Market Size and Share
Market Overview
| Study Period | 2020 - 2031 |
|---|---|
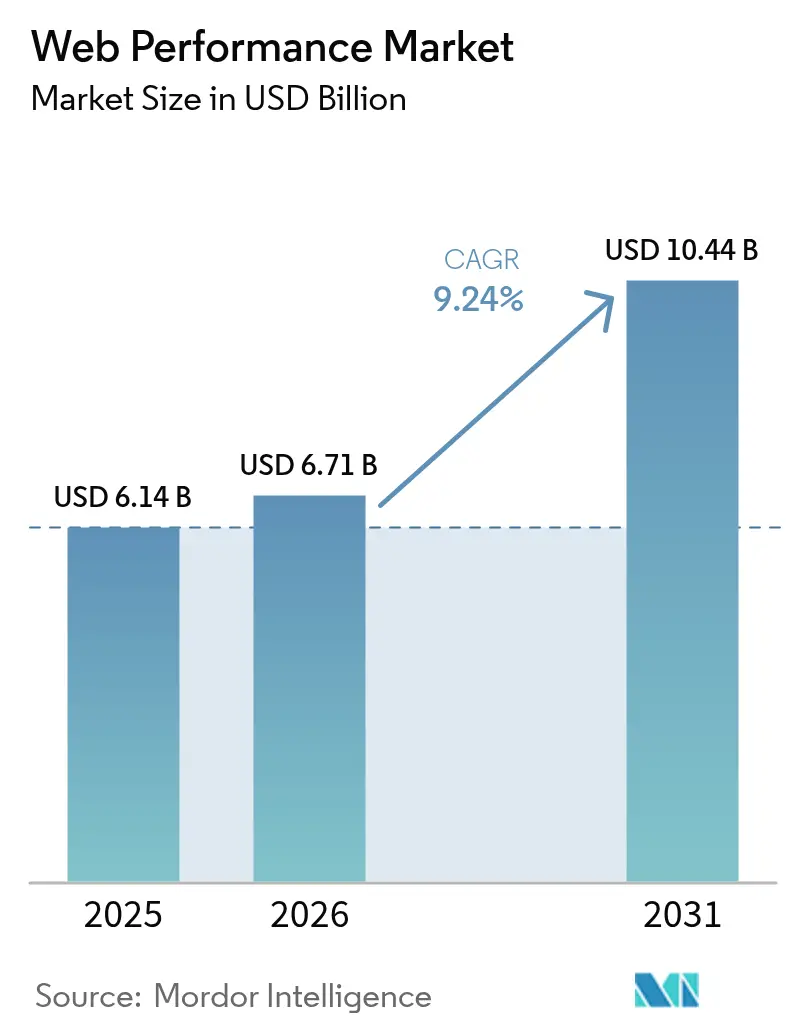
| Market Size (2026) | USD 6.71 Billion |
| Market Size (2031) | USD 10.44 Billion |
| Growth Rate (2026 - 2031) | 9.24% CAGR |
| Fastest Growing Market | Asia Pacific |
| Largest Market | North America |
| Market Concentration | Medium |
Major Players *Disclaimer: Major Players sorted in no particular order Image © Mordor Intelligence. Reuse requires attribution under CC BY 4.0. | |
Web Performance Market Analysis by Mordor Intelligence
Web performance market size in 2026 is estimated at USD 6.71 billion, growing from 2025 value of USD 6.14 billion with 2031 projections showing USD 10.44 billion, growing at 9.24% CAGR over 2026-2031. Intensifying algorithm updates by search engines, accelerating cloud-native migrations, and the race for sub-second latency at the edge are pushing organizations to treat speed as a board-level metric. Retailers alone uncovered USD 2.7 billion in revenue upside after tuning site speed during the 2024 holiday peak, cementing the link between performance and profit[1]Blue Triangle Labs, “Revenue at Risk from Web Performance,” bluetriangle.com. Consolidation among vendors, such as Akamai’s acquisition of Edgio assets and Cloudflare’s purchase of Baselime, is reshaping competitive dynamics by bundling observability, security, and delivery on a single bill. Demand for real-time insights is also expanding as developers adopt distributed tracing, edge analytics, and AI-powered anomaly detection to control user experience quality across hybrid and multi-cloud estates.
Key Report Takeaways
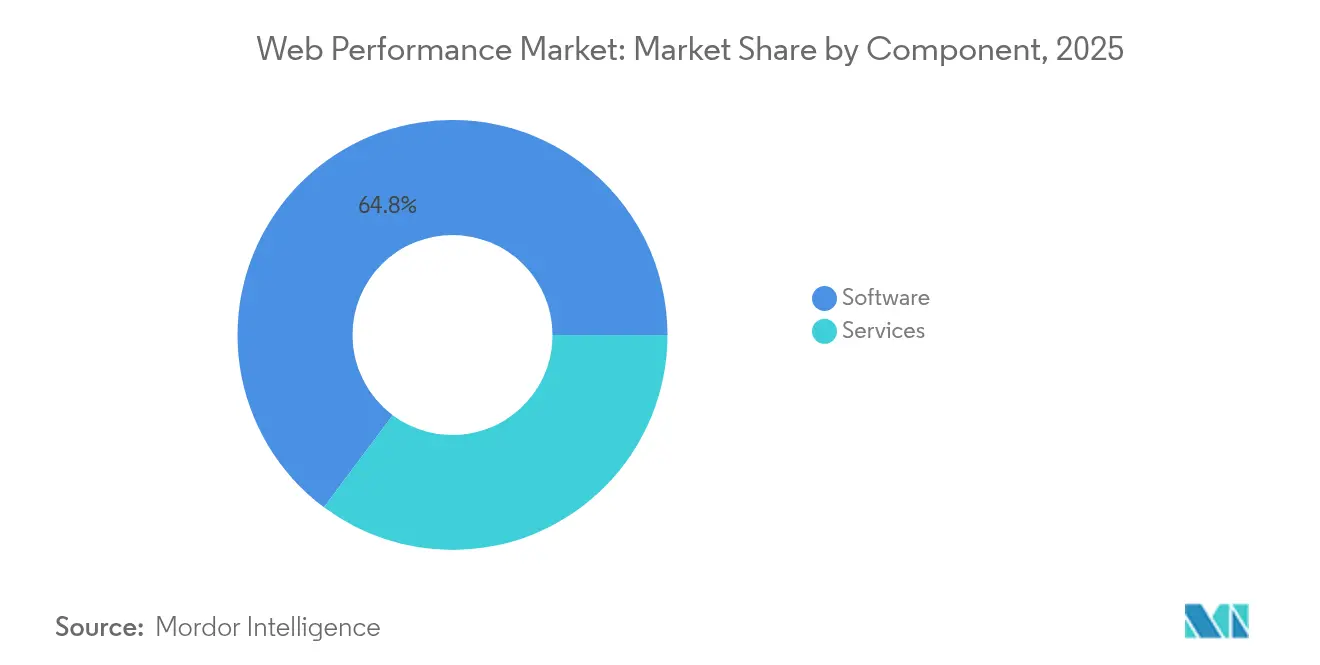
- By component, software commanded 64.80% of the web performance market share in 2025, while services are projected to post the fastest 10.52% CAGR to 2031.
- By deployment type, on-premises held 67.30% revenue share in 2025; cloud deployments are forecast to expand at an 10.84% CAGR through 2031.
- By monitoring type, synthetic monitoring led with 56.90% share in 2025; Digital Experience Management is expected to grow the quickest at a 10.03% CAGR to 2031.
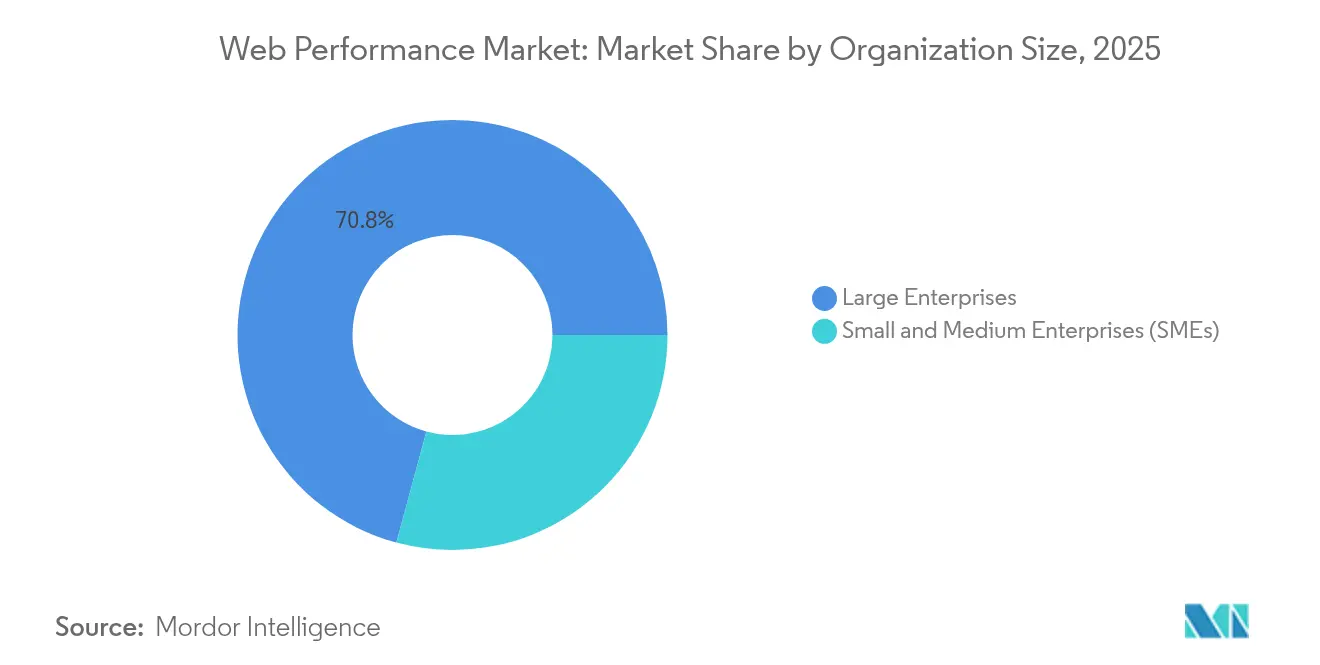
- By organization size, large enterprises accounted for 70.80% share in 2025, whereas SMEs exhibit the highest 10.34% CAGR through 2031.
- By end-user industry, IT and Telecom dominated with 33.20% share in 2025; retail and e-commerce are slated to progress at a 9.48% CAGR through 2031.
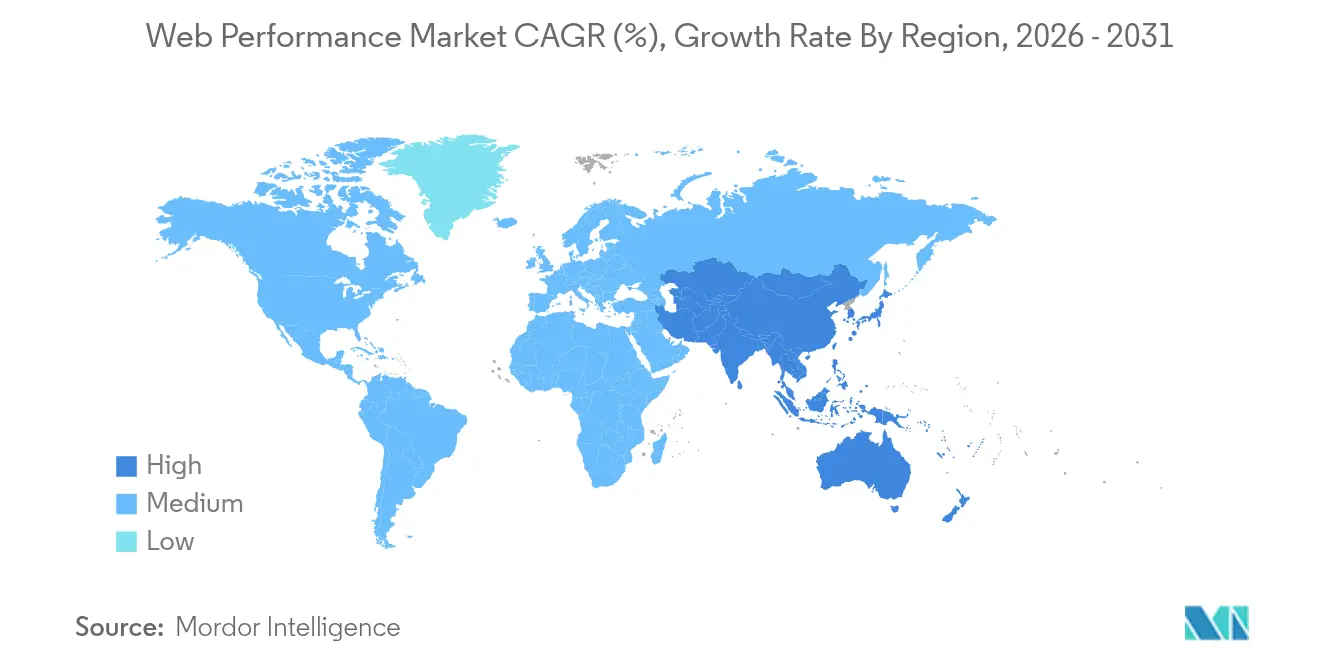
- By geography, North America captured 38.90% of revenue in 2025; Asia-Pacific is projected to rise at a 9.63% CAGR to 2031.
Note: Market size and forecast figures in this report are generated using Mordor Intelligence’s proprietary estimation framework, updated with the latest available data and insights as of 2026.
Global Web Performance Market Trends and Insights
Drivers Impact Analysis*
| Driver | (~) % Impact on CAGR Forecast | Geographic Relevance | Impact Timeline |
|---|---|---|---|
| E-commerce traffic spike and rich-media adoption | +2.1% | Global, with concentration in North America and APAC | Medium term (2-4 years) |
| Core Web Vitals algorithm pressure | +1.8% | Global, with early adoption in North America and EU | Short term (≤ 2 years) |
| Migration to cloud-native architectures | +1.5% | Global, led by North America, expanding to APAC | Long term (≥ 4 years) |
| Mobile-first user experience expectations | +1.3% | Global, with highest impact in APAC and emerging markets | Medium term (2-4 years) |
| Edge and serverless rollout for sub-second latency | +1.0% | North America and EU core, expanding to APAC | Long term (≥ 4 years) |
| Sustainability-linked FinOps performance budgets | +0.7% | EU and North America, with regulatory spillover to APAC | Long term (≥ 4 years) |
| Source: Mordor Intelligence | |||
E-commerce Traffic Spike and Rich-Media Adoption
Peak shopping days now saturate infrastructure with traffic surges that reveal latent performance defects. During Black Friday 2024, global online revenue increased 8.5% yet many retailers saw conversion dips when page loads exceeded latency budgets[2]Northbeam Analytics, “Black Friday 2024 E-commerce Report,” northbeam.io. Average page weight climbed 35% in 2024 as 3D product viewers and high-resolution imagery became baseline merchandising tools. Farfetch observed that each 100 ms of Largest Contentful Paint delay suppressed conversion by 1.3%, whereas cutting Time to Interactive lifted conversions 2.8%. Such quantified revenue impact converts performance from a technical hygiene task into a PandL lever. Consequently, virtual waiting rooms, traffic shaping, and auto-scaling are deployed alongside granular monitoring that grades user experience under stress rather than simple uptime.
Core Web Vitals Algorithm Pressure
Google replaced First Input Delay with Interaction to Next Paint (INP) in March 2024, obliging sites to keep worst-case interaction latency below 200 ms to remain competitive in rankings. The metric’s breadth forces instrumentation of real user interactions across varied journeys, prompting enterprises to upgrade from basic synthetics to platforms that stitch RUM, traces, and analytics. Safari and Firefox’s 2025 support of INP and LCP will end the Chrome bias, exposing responsiveness gaps previously hidden in cross-browser averages. Banks and insurers have reacted swiftly because UX scores link directly to customer acquisition cost. Proactive synthetics that model slow-network scenarios are now budgeted as compliance tools rather than optional optimizations.
Migration to Cloud-Native Architectures
Microservices, containers, and serverless functions fragment application topologies, making node-level polling ineffective. Enterprises adopting Kubernetes gained 74% operational efficiency yet wrestle with pod churn, mesh latency, and multi-provider drift that older agents cannot parse. Forty-three percent of financial institutions now run multi-cloud, necessitating telemetry federation across AWS, Azure, and GCP silos. GitOps pipelines embed performance gates so that code failing latency budgets is blocked before production. Distributed tracing and eBPF-based observability reveal hop-by-hop delays, while AI-driven baselining flags anomalies in near real time, anchoring performance accountability in daily engineering rituals.
Mobile-First User Experience Expectations
Mobile abandonment spikes when a page exceeds 3 seconds, costing brands immediate revenue. Device fragmentation plus variable cellular conditions complicate lab testing, compelling growth of global RUM networks that capture authentic 4G, 5G, and Wi-Fi performance. Progressive Web Apps blur app-web boundaries, requiring unified visibility into service workers, push notifications, and offline caching. 5G rollouts raise baseline expectations toward instant load, yet enterprises must also safeguard users on legacy networks. Intelligent compression, lazy loading, and adaptive routes are guided by telemetry that correlates specific content types with dwell time and basket size to refine experience design.
Restraints Impact Analysis*
| Restraint | (~) % Impact on CAGR Forecast | Geographic Relevance | Impact Timeline |
|---|---|---|---|
| Enterprise-grade platform pricing | -1.2% | Global, with highest impact in emerging markets | Short term (≤ 2 years) |
| Legacy system integration complexity | -0.9% | North America and EU, with spillover to established APAC markets | Medium term (2-4 years) |
| Browser privacy curbs limiting RUM data | -0.8% | EU and North America, expanding globally | Long term (≥ 4 years) |
| Shortage of observability / SRE talent | -0.6% | Global, with acute shortages in APAC and emerging markets | Medium term (2-4 years) |
| Source: Mordor Intelligence | |||
Enterprise-Grade Platform Pricing
Observability bills can devour 15-20% of cloud spend once data-ingestion pricing models replace per-host licenses[3]Catchpoint Engineering, “2025 SRE Survey,” catchpoint.com. SMEs hesitate to commit to minimum volumes bundled with AI and security modules they may not need. Although OpenTelemetry pipelines reduce lock-in, DIY maintenance offsets licensing savings. Vendor consolidation further concentrates pricing power, prompting buyers to negotiate data-tier caps and adopt sampling to keep costs predictable. Community-hosted collectors and tiered retention policies are now part of FinOps toolkits as organizations align telemetry granularity with business value.
Legacy System Integration Complexity
Mainframes and proprietary middleware remain mission-critical in sectors such as banking, where modifications require exhaustive audits that stretch integration projects 6–18 months. Bridging COBOL transaction logs with cloud traces demands adapters that few engineers master, creating a hiring bottleneck. API gaps in legacy platforms limit real-time hooks, nudging teams toward batch analytics that miss transient spikes. Hybrid collectors that proxy metrics while sandboxing sensitive data are gaining traction but still lengthen go-live schedules compared with cloud-native greenfields. Hence, implementation complexity restrains the web performance market until tooling further abstracts away system-specific intricacies.
*Our forecasts treat driver/restraint impacts as directional, not additive. The impact forecasts reflect baseline growth, mix effects, and variable interactions.
Segment Analysis
By Component: Software Dominance Drives Platform Consolidation
The software segment accounted for 64.80% of the web performance market in 2025, underscoring enterprises’ preference for integrated toolchains that unify synthetics, RUM, and tracing into a single console. Services, however, are growing at a 10.52% CAGR as organizations outsource configuration, alert tuning, and dashboard maintenance in the face of talent shortages. This divergence illustrates how buyers increasingly view tooling and expertise as complementary rather than substitutable.
Demand for managed services accelerated when cloud migrations exposed skill gaps in container orchestration, edge analytics, and data pipeline governance. Providers offering 24×7 SRE coverage paired with optimization playbooks now bundle advisory engagements to maximize platform ROI. As a result, software vendors embed no-code onboarding wizards and AI-guided setup while simultaneously in-housing consulting arms, signaling a convergence that redefines value propositions across the web performance market.


By Deployment Type: Cloud Migration Accelerates Hybrid Adoption
On-premises instances retained 67.30% of web performance market share in 2025 because regulated industries keep telemetry close to sovereign data centers. Yet cloud deployments are scaling at an 10.84% CAGR, driven by feature velocity and OPEX flexibility. Hybrid topologies marry sensitive on-prem workloads with cloud analytics to comply with data-residency laws while unlocking machine-learning-powered insights.
Edge computing compounds this trend: telemetry captured at regional POPs flows into cloud AI engines that classify anomalies in seconds. Financial services and gaming companies thus pilot “observe-anywhere” architectures in which collectors migrate alongside workloads. The web performance market size for hybrid monitoring platforms is forecast to widen as vendor roadmaps emphasize seamless data plane portability rather than rigid dichotomies between on-prem and SaaS.
By Monitoring Type: Digital Experience Platforms Transform User Visibility
Synthetic testing delivered 56.90% revenue in 2025 by providing predictable baselines and SLA proof points. Digital Experience Management, though smaller, is climbing at a 10.03% CAGR because real-user context reveals commercial impact. Vendors now fuse synthetics with RUM feeds in a single graph, empowering product managers to tie millisecond gains to funnel conversion.
AI models trained on blended datasets flag “experience debt,” the cumulative lag that erodes loyalty over time. Retailers in APAC deploy DEM dashboards in war rooms during festival sales to correlate ad spend with UX in real time. The web performance market size for DEM suites benefiting from this convergence is projected to expand steadily through 2031, while traditional synthetics modernize with headless browsers and 5G profiles to remain relevant.
By Organization Size: SME Adoption Drives Market Democratization
Large enterprises controlled 70.80% of spending in 2025 because sprawling estates mandate deep observability. Yet SMEs are advancing at a 10.34% CAGR as cloud democratization drops barriers. Self-service SaaS tiers allow a two-developer startup to gain the same page-level insights once reserved for Fortune 500 budgets.
Platform vendors counter-position with pay-as-you-grow ingestion caps and prebuilt dashboards that surface business metrics, not just graphs. Bundling of performance with CDNs, CI/CD, and security also resonates with resource-constrained firms. The burgeoning SME cohort is expected to reshape value segmentation within the web performance industry, compelling incumbents to streamline interfaces and shorten time-to-value across price bands.
By End-User Industry: IT and Telecom Leadership Faces Retail Disruption
IT and Telecom led with 33.20% share in 2025 because network operators must monitor latency from core to last mile to sustain SLA commitments for 5G, VoIP, and edge workloads. Retail and e-commerce, however, show the fastest 9.48% CAGR as checkout speed becomes a direct revenue lever during flash-sale events. BFSI organizations hold substantial weight since regulatory scrutiny ties UX to digital adoption metrics.
Cross-pollination is emerging: retailers borrow zero-dwell observability from telcos, while banks implement conversion-centric KPIs common in e-commerce. Sustainability mandates further align sectors, using performance optimization to cut compute waste and emissions. Consequently, the web performance market will likely see verticalized feature packs, such as payment-gateway traces for BFSI or session-replay analytics optimized for shopping carts.
Geography Analysis
North America captured 38.90% of 2025 revenue thanks to mature cloud infrastructure, early AI-driven observability adoption, and stringent compliance frameworks that mandate proof of uptime and responsiveness. United States financial institutions integrate latency budgets into customer-experience OKRs, while Canadian healthcare portals embed RUM in patient portals to monitor telemedicine quality. Mexico’s manufacturing plants are beginning to instrument OT and IT convergence stacks, signaling wider regional uptake. Persistent SRE talent shortages pose execution risks, yet venture funding spurs continuous tooling innovation that sustains regional momentum.
Asia-Pacific is the fastest-growing territory with a 9.63% CAGR to 2031, propelled by mobile-first consumer behavior, large-scale data-center investments, and government digitalization programs. Chinese e-commerce giants trace every edge hop to maintain lightning-fast checkouts during Singles’ Day, whereas Indian IT outsourcers deploy multi-tenant dashboards for global clients. Japan and South Korea pioneer 5G-enabled low-latency observability, while Australia leverages hybrid cloud to bridge continental distances. The web performance market size in APAC benefits from local vendors offering language and compliance-aligned solutions that complement global platforms.
Europe registers steady expansion anchored in GDPR enforcement and sustainability directives. German manufacturers embed performance data in Industry 4.0 dashboards to predict production downtimes, and UK banks tie INP scores to digital branch ratings. France focuses on aerospace telemetry where millisecond delays ripple through supply chains. Emerging EU digital sovereignty policies foster regional cloud nodes, shaping procurement toward platforms that guarantee in-region data processing. The Middle East and Africa trail but accelerate as UAE smart-city projects and South African fintech rollouts demand reliable, low-latency digital services.

Regulatory Landscape
Web performance tooling is increasingly shaped by cybersecurity and cloud-assurance requirements that affect how telemetry is collected, stored, and accessed across regions. In the United States, NSPM-12 (June 2026) directs the Committee on National Security Systems (CNSS) to request and assess cloud configuration baselines from cloud service providers that handle federal data. This reinforces configuration hygiene and continuous control verification, which many web performance platforms are expected to support as part of enterprise governance.
Standards and codes are also tightening for operators of critical networks and digital services that underpin web delivery. The United Kingdom issued the Revised Telecommunications Security Code of Practice 2026 (version 1.1, July 2026) to guide compliance with the Telecommunications (Security) Act 2021 and related security measures regulations. The update increases emphasis on resilient, secure service operations, where performance monitoring and availability evidence are used in operational assurance. On the technical standardization side, ETSI opened consultation (April 2026) on interim draft EN 304 617 for browser cybersecurity requirements supporting the EU Cyber Resilience Act, aligning browser-layer security expectations with measurement and reporting practices that affect RUM, synthetic testing, and user-journey instrumentation.
Value Chain Analysis
The web performance value chain begins with standards and protocols that define what can be measured and how traffic is delivered, then moves through product engineering, deployment, and operational services. Standards bodies such as W3C provide key browser and server measurement interfaces (for example, Resource Timing and Performance Timeline candidate recommendations in 2025, and the Server Timing specification), while the IETF advances transport-layer capabilities such as WebTransport over HTTP/3 that influence latency and reliability characteristics. Vendors then build these building blocks into software platforms covering synthetic monitoring, real-user monitoring (RUM), digital experience management, and acceleration layers that commonly integrate with CDN and edge providers for last-mile performance.
On the downstream side, distribution channels include hyperscaler marketplaces, direct enterprise sales, and managed service partners that configure collectors, alert policies, and performance budgets for application teams and SREs. Core inputs include browser-side instrumentation, server timing headers, and trace and log pipelines (increasingly via OpenTelemetry), plus edge telemetry from POPs. Bottlenecks often appear in multi-region deployments, where propagation lag, cross-zone chatter, and API endpoint locality constraints degrade user experience even when uptime is high, driving demand for tools that connect user-centric metrics such as INP and LCP to backend causality across hybrid and multi-cloud estates.
Competitive Landscape
The web performance market is moderately consolidated, with leading platforms—Akamai, Dynatrace, Cloudflare, and New Relic—providing end-to-end visibility from browser to database. Recent deals illustrate the land-grab for unified observability: Akamai folded Edgio’s CDN capacity into its edge fabric, Cloudflare acquired Baselime to bolster serverless tracing, and Catchpoint added WebPageTest.org to extend community reach. These moves reflect customer appetite for single-vendor solutions that reduce integration toil.
Artificial intelligence is the new battleground. Dynatrace previews causal AI that auto-maps root causes, while New Relic infuses generative assistants that translate plain-English questions into metric queries. Niche challengers differentiate through open-source alignment; for example, Grafana Cloud packages OpenTelemetry pipelines with low-cost storage for price-sensitive adopters. Vertical specialists emerge as well—PacketZoom clones optimize mobile session continuity, and Edge Delta offers streaming analytics tightened for Kubernetes logs.
Partnership ecosystems expand reach: telcos embed monitoring probes into 5G gateways, and hyperscalers incorporate marketplace SKUs for one-click deployment. Vendors also chase sustainability budgets by quantifying carbon savings from optimized payload sizes, thus appealing to ESG-driven boards. Skills scarcity, however, remains a ceiling; platform success hinges on enabling less-specialized teams via low-code dashboards and AI recommendations that shorten mean time to resolution.
Web Performance Industry Leaders
Akamai Technologies, Inc.
IBM Corpration
Broadcom (AppNeta)
Amazon CloudWatch
Microsoft Azure Monitor
- *Disclaimer: Major Players sorted in no particular order


Market Opportunities and Future Outlook
A major opportunity area is the convergence of edge delivery and compute into a single platform where performance, availability, and workload execution are optimized together. Akamai launched AI Grid Intelligent Orchestration in March 2026, integrating NVIDIA AI infrastructure across 4,400 edge locations, which broadens web performance monitoring from page delivery to inference and API response paths running at the edge. Cloudflare also advanced edge efficiency through infrastructure changes, including migrating its global cache proxy to Pingora (May 2026), supporting a shift toward memory-safe, high-throughput architectures that can reduce latency and improve operational reliability for content and API delivery.
Measurement modernization is also opening white space for vendors that can operationalize new standards and ranking metrics across real-user journeys. INP becoming a primary Google Search ranking signal (March 18, 2026) elevates interaction responsiveness as a commercial KPI and supports adoption of tooling that connects frontend interaction delays to backend services, third-party scripts, and regional network conditions. On the standards track, W3C working drafts for Server Timing and Event Timing (March 2026) reinforce the pathway to richer, standardized performance signals, which favors platforms that can ingest emerging browser APIs and normalize data across browsers and devices. Feature moves such as Fastly introducing independent Domain Management (Q1 2026) also point to continued demand for operational patterns that keep routing changes and performance tuning from creating downtime, expanding the role of performance platforms in change management and multi-team workflows.
Recent Industry Developments
- April 2026: Broadcom expanded its collaboration with Google Cloud to integrate AppNeta network observability into Google Cloud Network Insights. The integration brings network performance visibility closer to where cloud workloads run, supporting end-to-end troubleshooting across hybrid paths that affect web and application experience.
- September 2025: Akamai launched its Managed Service for API Performance, built on its APIContext capabilities for API testing and optimization. This packaged service structure addresses skills gaps by externalizing continuous API performance management, aligning with buyers that treat API responsiveness as a revenue and experience metric.
- December 2024: Akamai completed its purchase of Edgio assets, adding CDN capacity and customer contracts into its edge fabric. The consolidation increases scale for global delivery footprints and supports bundling of delivery, security, and performance capabilities under a single vendor relationship.


Research Methodology Framework and Report Scope
Market Definition and Coverage
For this study, we define the web performance market as the revenue earned from software and related services used to monitor, test, optimize, and accelerate websites and browser-based applications, so pages load quickly and stay stable for end users.
Scope exclusions: We exclude stand-alone digital analytics tools that do not actively measure, optimize, or accelerate performance.
Segmentation Overview
- By Component
- Software
- Services
- By Deployment Type
- On-premises
- Cloud
- By Monitoring Type
- Synthetic Monitoring
- Real-User Monitoring (RUM)
- Digital Experience / DEM Platforms
- By Organization Size
- Large Enterprises
- Small and Medium Enterprises (SMEs)
- By End-User Industry
- BFSI
- IT and Telecom
- Retail and E-commerce
- Automotive
- Government
- Other End-user Industries
- Geography
- North America
- United States
- Canada
- Mexico
- Europe
- Germany
- United Kingdom
- France
- Italy
- Spain
- Russia
- Rest of Europe
- Asia-Pacific
- China
- Japan
- India
- South Korea
- Australia and New Zealand
- Rest of Asia-Pacific
- South America
- Brazil
- Argentina
- Rest of South America
- Middle East and Africa
- Middle East
- Saudi Arabia
- United Arab Emirates
- Turkey
- Rest of Middle East
- Africa
- South Africa
- Nigeria
- Rest of Africa
- Middle East
- North America
Data Sources, Market Sizing, and Validation
Desk Research
Desk research started with public definitions of web quality and speed signals, then moved into adoption and spend indicators that can be checked repeatedly. Sources referenced included guidance and datasets such as Google Web Vitals documentation, US NIST cybersecurity and performance related publications, OECD digital economy indicators, ITU connectivity statistics, and regulator or ministry digital infrastructure notes where available.
To anchor the commercial picture, we also reviewed company filings, earnings call transcripts, investor decks, product documentation, and credible press coverage of platform releases and pricing changes. Where it helped, a paid subscription for company financials and news was used to normalize revenue splits, and a patent database was used to sanity check where innovation is concentrated. The sources listed here are not exhaustive, and many other public and paid references were used for data collection, validation, and clarification.
Primary Interviews and Surveys
Primary work was done through expert interviews and structured surveys with solution providers, channel partners, and buyers who own site reliability, digital experience, and e-commerce outcomes. These interviews were used to confirm what is actually bought (tools versus services), how pricing is applied (usage, traffic, synthetic tests, or seat based), and how budgets shift across regions and enterprise sizes. For a global market view, coverage was balanced across major demand regions so assumptions could be challenged and then tightened before finalizing the model.
Distribution of primary research fieldwork respondents
| Company type | Respondent position | Region |
|---|---|---|
| Top tier: 36% | CXOs: 14% | APAC: 44% |
| Mid tier: 43% | Functional/Unit leaders: 29% | EMEA: 34% |
| Smaller Players: 21% | Managers: 57% | Americas: 22% |
Market-Sizing & Forecasting
Market sizing used a top-down and bottom-up mix. The demand pool was built from digital traffic growth and the share of web properties that actively invest in monitoring and acceleration, then translated into spend using typical price logic. We corroborated results with selective bottom-up approximations, such as sampling supplier revenue disclosure, channel checks, and a simple volume times ASP view for common commercial levers, then adjusted for obvious overstatements.
Key inputs in the model included page load and stability focus driven by Core Web Vitals adoption, growth in mobile browsing and commerce conversion sensitivity, cloud migration rates that change deployment choices, usage-driven pricing mechanics tied to traffic and synthetic test volumes, and the mix shift between self-serve software and managed services. Where bottom-up visibility was limited, gaps were handled by applying conservative ranges for attach rates and service penetration, then narrowed through a second pass using primary feedback.
For forecasting, scenario analysis was used, with a base case shaped by expected digital spend priorities and the pace of new performance standards adoption. Assumptions for ASP movement and service share were adjusted only after reconfirming them with practitioners who track renewal cycles and pricing changes in live deals.
Data Validation & Update Cycle
Validation was done through repeated cross-checks between the market model and independent signals, including enterprise digital experience priorities, cloud and web workload growth, and observable shifts in pricing and packaging. Outliers were reviewed at the country and region level, then reworked when implied spend per monitored site or per traffic unit fell outside realistic ranges.
Before sign-off, the work goes through a multi-step analyst review, where assumptions, calculations, and year-on-year movements are checked for internal consistency. If large variances appear versus public disclosures or interview feedback, we re-contact selected experts to re-test the specific driver. Reports are refreshed annually, with interim updates when major events change demand or pricing, and a final pre-delivery pass is completed so clients receive the latest updated view.
Mordor Intelligence's Web Performance Market Estimate Compared With Other Published Estimates
Published market sizes for web performance rarely match each other because the boundaries are set differently and because pricing is treated in different ways across tools and services. Currency timing, how usage-based pricing is annualized, and how managed services are separated from software subscriptions are usually the quiet factors that create the widest spread.
A refresh-led gap shows up when older exchange rates and legacy price cards are kept in place even though vendors update packaging and commit levels frequently, and when validation stops at a single indicator like website counts without checking real spend intensity. By rechecking usage-linked ASP movement, applying consistent currency timing for the base year, and rerunning variance checks close to publication, Mordor Intelligence keeps the estimate aligned to what buyers are actually paying in the current period.
Benchmark comparison
| Source | Market Size | Gaps in Research Methodology |
|---|---|---|
| Mordor Intelligence | USD 6.71 B (2026) | |
| Trade Publisher A | USD 5.09 B (2024) | Uses an earlier base year and a slower growth track, and the scope description is less explicit on how usage-based pricing and services are annualized into recurring revenue. |
| Industry Newswire B | USD 6.16 B (2024) | Often mixes adjacent categories such as CDN and APM under a broad umbrella, and the conversion to annual revenue can be sensitive to assumed traffic growth and service attach rates. |
Across the three figures, the main takeaway is that the spread is not only about growth expectations, it is also about what gets counted and how pricing is converted into yearly revenue. When scope rules, currency timing, and ASP progression are written down clearly and then stress-tested with interviews, the final number becomes easier to replicate and easier to defend in planning discussions.


Key Questions Answered in the Report
What is the current web performance market size in 2026?
The web performance market generated USD 6.71 billion in 2026.
How fast will the web performance market grow by 2031?
Revenue is projected to reach USD 10.44 billion by 2031, translating to a 9.24% CAGR.
Which region is expanding the fastest?
Asia-Pacific is forecast to record the quickest 9.63% CAGR, driven by mobile-first usage and large-scale cloud investments.
What segment led the web performance market share in 2025?
Software solutions dominated with 64.80% share, reflecting demand for integrated monitoring platforms.
Why are SMEs adopting performance monitoring rapidly?
Affordable SaaS tiers and pay-as-you-grow pricing lower entry barriers, enabling SMEs to improve customer experience without heavy upfront investment.
How do Core Web Vitals influence vendor demand?
Google’s shift to INP pushes enterprises to upgrade monitoring stacks, spurring uptake of solutions that capture interaction latency across real user sessions.
Page last updated on:






