
Web Filtering Market Size and Share
Market Overview
| Study Period | 2020 - 2031 |
|---|---|
| Market Size (2026) | USD 5.51 Billion |
| Market Size (2031) | USD 9.68 Billion |
| Growth Rate (2026 - 2031) | 11.91% CAGR |
| Fastest Growing Market | Asia Pacific |
| Largest Market | North America |
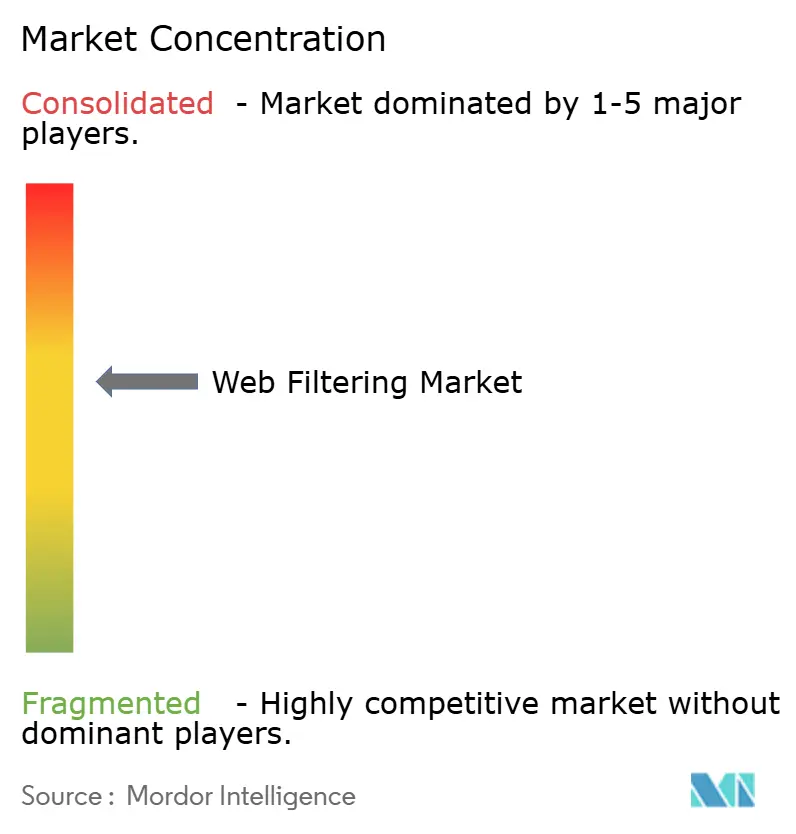
| Market Concentration | Medium |
Major Players *Disclaimer: Major Players sorted in no particular order Image © Mordor Intelligence. Reuse requires attribution under CC BY 4.0. | |
Web Filtering Market Analysis by Mordor Intelligence
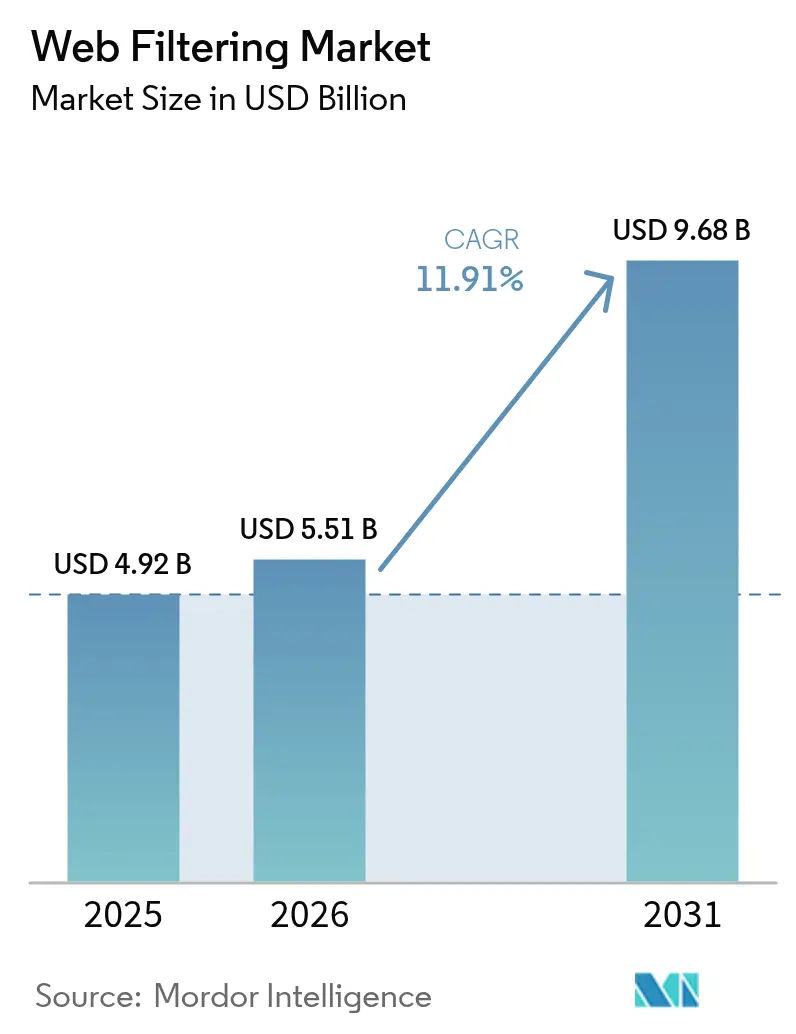
Web filtering market size in 2026 is estimated at USD 5.51 billion, growing from 2025 value of USD 4.92 billion with 2031 projections showing USD 9.68 billion, growing at 11.91% CAGR over 2026-2031. Cloud-native architectures, Secure Access Service Edge (SASE) convergence, and zero-trust mandates are accelerating refresh cycles across enterprises, while AI-powered content inspection improves protection against encrypted threats. Regulatory pressure—from the U.S. Executive Order 14144 to Indonesia’s Regulation 17/2025—is forcing organizations to deploy policy-rich platforms that satisfy complex compliance checks[1]Executive Office of the President, “Executive Order 14144—Strengthening and Promoting Innovation in the Nation’s Cybersecurity,” Federal Register, federalregister.gov. North America remains the largest regional contributor, yet Asia-Pacific delivers the fastest growth amid sweeping data-protection laws and surging cloud adoption. Platform consolidation is changing buying behavior as enterprises favor integrated stacks that fold secure web gateway (SWG), firewall-as-a-service, and zero-trust network access into a single subscription.
Key Report Takeaways
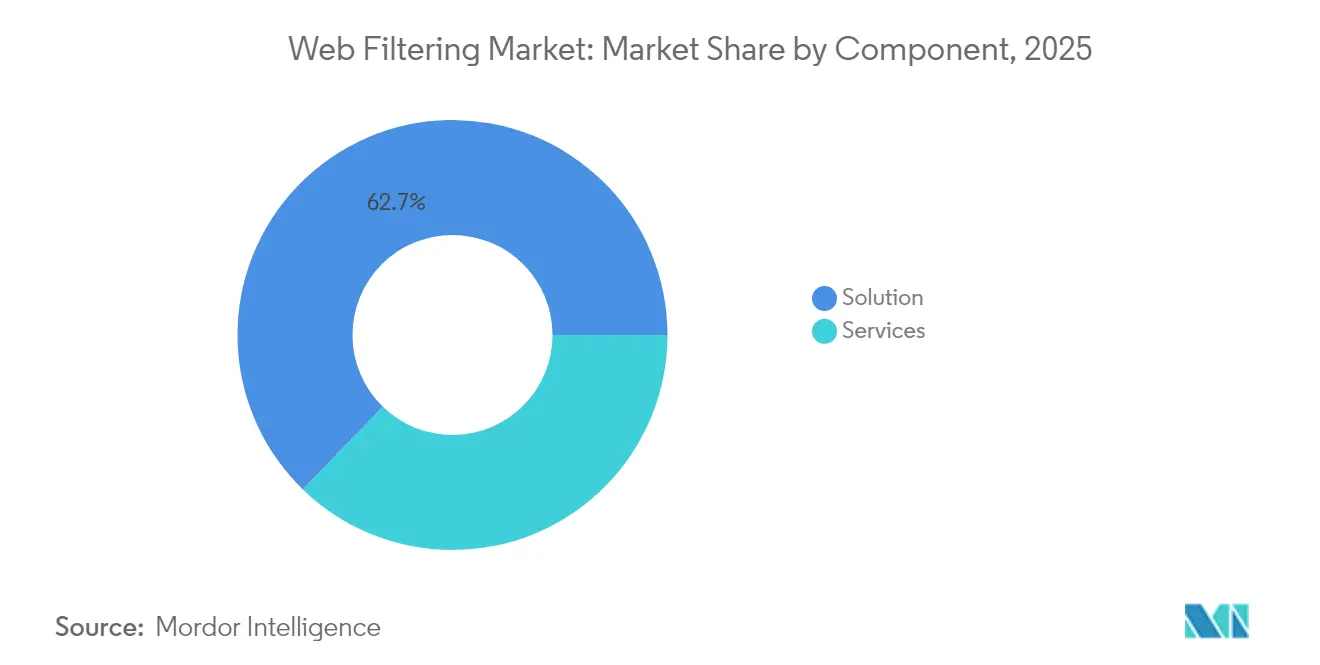
- By component, solutions led with 62.75% of web filtering market share in 2025, while services are forecast to grow at a 13.62% CAGR to 2031.
- By deployment mode, on-premises accounted for 68.90% share of the web filtering market size in 2025; cloud deployment is projected to expand at 13.98% CAGR through 2031.
- By filtering type, URL filtering captured 57.25% revenue share in 2025; keyword filtering is advancing at a 13.12% CAGR between 2026-2031.
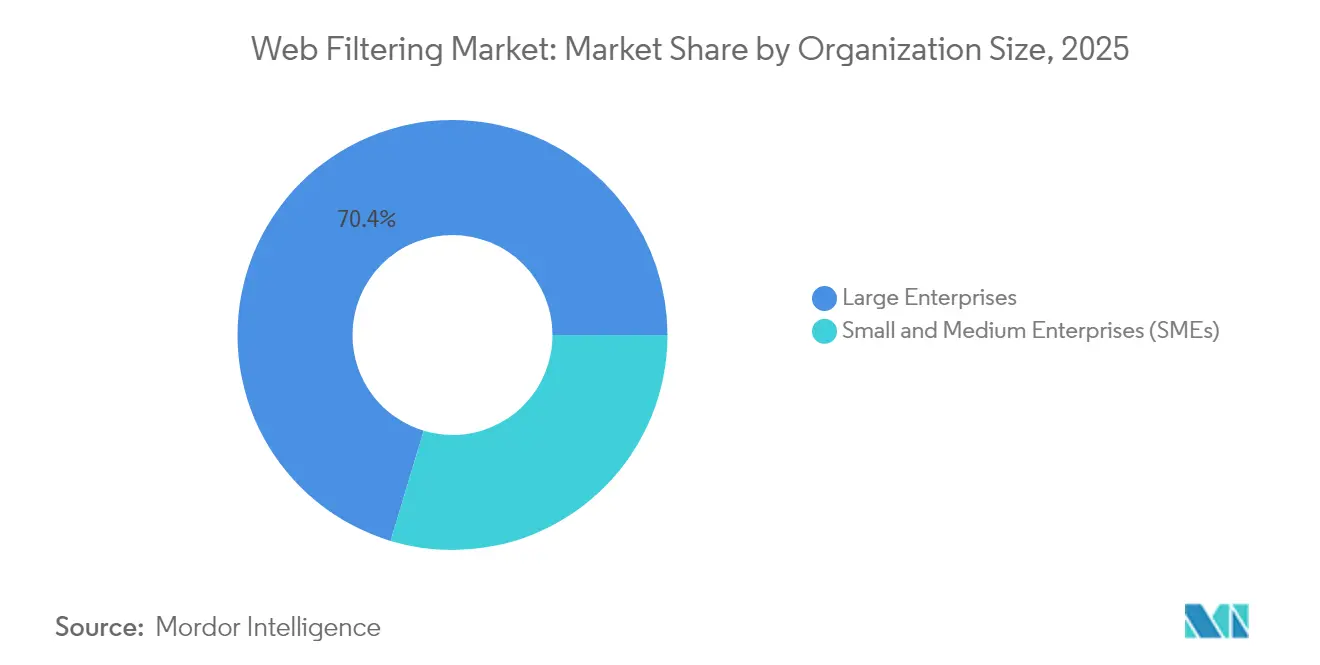
- By organization size, large enterprises held 70.35% share of the web filtering market size in 2025, whereas SMEs record the quickest CAGR at 13.41% to 2031.
- By industry vertical, BFSI commanded 45.10% of the web filtering market share in 2025, yet education is the fastest-growing vertical at 12.19% CAGR through 2031.
- By geography, North America led with 36.95% revenue share in 2025; Asia-Pacific is set to grow at 12.74% CAGR to 2031.
Note: Market size and forecast figures in this report are generated using Mordor Intelligence’s proprietary estimation framework, updated with the latest available data and insights as of 2026.
Global Web Filtering Market Trends and Insights
Drivers Impact Analysis*
| Driver | (~) % Impact on CAGR Forecast | Geographic Relevance | Impact Timeline |
|---|---|---|---|
| Strict government regulations and compliance | +2.1% | Global, strongest in North America and Europe | Medium term (2-4 years) |
| Surge in BYOD and hybrid work | +1.8% | Global, led by North America and Asia-Pacific | Short term (≤2 years) |
| Sophisticated web-borne malware | +1.5% | Global | Long term (≥4 years) |
| SASE convergence refreshing SWG cycles | +2.3% | North America and Europe, expanding Asia-Pacific | Medium term (2-4 years) |
| AI-driven real-time content classification | +1.4% | Global, early adoption in developed markets | Long term (≥4 years) |
| Remote Browser Isolation as zero-trust tool | +1.2% | North America and Europe | Medium term (2-4 years) |
| Source: Mordor Intelligence | |||
Strict Government Regulations and Compliance Pressure
Governments worldwide are embedding zero-trust and encrypted DNS requirements into law, making compliance a non-negotiable investment driver for the web filtering market. Indonesia now compels operators serving minors to deploy content controls under Regulation 17/2025, pushing demand for pre-packaged policy templates that speed onboarding. In the United States, K-12 schools remain tethered to Children’s Internet Protection Act (CIPA) funding, sustaining steady procurement in education-focused filtering. Data-protection rules such as India’s DPDPA compound the compliance stack, nudging buyers toward consolidated platforms that simplify audits. Because penalties for non-compliance stretch into multimillion-dollar fines, budget holders increasingly allocate growth dollars to proven filtering vendors rather than discretionary IT projects.
Surge in BYOD and Hybrid Work Adoption
The permanent blend of office and remote work makes device-agnostic enforcement a baseline capability for the web filtering market. Zscaler now inspects more than half a trillion daily transactions, underscoring the scale of policy application required when workers connect from anywhere. Cloud-hosted SWGs maintain policy uniformity in branch offices, homes, and public Wi-Fi locations—all while encrypting traffic end-to-end. U.S. federal guidance on encrypted DNS highlights the operational puzzle: retain visibility while respecting privacy. Consequently, enterprises replace perimeter appliances with edge nodes that pull identity, device posture, and threat telemetry into every verdict.
Escalating Sophistication of Web-Borne Malware
Threat actors now automate phishing pages, waterholes, and malvertising through AI, forcing continual signature updates and real-time analysis inside the web filtering market. Cisco’s AI-driven Domain Generation Algorithm defender lifts detection rates by 30% and accuracy by 50%, illustrating vendor escalation in analytic horsepower[2]Cisco Systems Inc., “AI-Powered Detection of Domain Generation Algorithms,” blogs.cisco.com. Encrypted Client Hello further obscures domain metadata, limiting legacy URL filters in education networks. Modern filters pivot to machine-learning classifiers that scrutinize script behavior, page entropy, and user intent within milliseconds. Buyers expect these engines to scale without latency spikes as traffic volumes swell with video streaming and generative-AI usage.
SASE Convergence Accelerating SWG Refresh Cycles
Organizations consolidating SD-WAN, firewall-as-a-service, and zero-trust access under a single cloud fabric present fresh spend for the web filtering market. Fortinet’s Unified SASE annual recurring revenue reached USD 1.15 billion in Q1 2025, proving that integrated stacks entice buyers seeking simpler license bundles. Gartner’s reclassification of SWG under the broader Security Service Edge banner prompted incumbent vendors to unify consoles, policy engines, and billing. This convergence rewards suppliers with elastic global PoPs, predictable performance SLAs, and automated threat feeds that shrink time-to-protection.
Restraints Impact Analysis*
| Restraint | (~) % Impact on CAGR Forecast | Geographic Relevance | Impact Timeline |
|---|---|---|---|
| Cyber-skills deficit for policy tuning | -1.3% | Global, deepest in emerging markets | Medium term (2-4 years) |
| Performance-latency concerns in cloud SWG | -0.9% | Global, acute in real-time trading and media streaming | Short term (≤2 years) |
| Encrypted DNS (DoH) circumvention | -1.1% | Global, divergent regulatory postures | Long term (≥4 years) |
| Vendor consolidation boosting price power | -0.8% | Global, concentrated in mature markets | Medium term (2-4 years) |
| Source: Mordor Intelligence | |||
Cyber-Skills Deficit for Complex Policy Tuning
Advanced filtering engines expose hundreds of toggles for machine-learning thresholds, app controls, and shadow-IT discovery, yet few security teams possess the know-how to calibrate them. Talent shortages are starker in emerging economies, where universities lag behind in cybersecurity curricula. Consequently, many buyers lean on managed service providers for 24x7 policy optimization, inflating total cost of ownership and dampening direct license growth. Vendors counter by shipping wizard-driven consoles and AI-recommended policy baselines that shorten ramp-up times. Skills gaps could widen as platforms add context-aware features reliant on identity and behavioral analytics.
Encrypted DNS (DoH) Circumventing Filters
DoH turns DNS lookups into HTTPS traffic, allowing users—or malware—to bypass on-premises resolvers silently. K-12 districts in the United Kingdom reported gaps after browsers enabled DoH by default, prompting new guidance on network-level interception. While privacy gains are undisputed, security teams must re-architect inspection points or deploy native DoH-aware gateways. Such retrofits drive extra capital spend and complicate maintenance for budget-constrained organizations, dampening short-term adoption in latency-sensitive environments.
*Our forecasts treat driver/restraint impacts as directional, not additive. The impact forecasts reflect baseline growth, mix effects, and variable interactions.
Segment Analysis
By Component: Services Growth Outpaces Solutions
Services generated a 13.62% CAGR from 2026-2031, outstripping software even though solutions still captured 62.75% revenue in 2025. The web filtering market records mounting demand for professional services that configure AI policy engines, integrate identity feeds, and run threat-hunting playbooks. Vendors like Zscaler support over 8,600 customers with managed offerings that absorb operational burdens. Growing complexity, coupled with the cyber-skills gap, cements services as a strategic revenue pillar.
Solutions continue to underwrite the bulk of the web filtering market because large enterprises pre-pay multiyear subscriptions for cloud gateways. Consumption-based billing now blurs lines between software and service, yet license value remains material. Menlo Security’s cloud-native Secure Enterprise Browser packages RBI and zero-trust controls into per-seat fees that mimic SaaS economics. Consequently, services revenues expand without cannibalizing core license flows, keeping total addressable opportunity robust.


By Deployment Mode: Cloud Migration Accelerates
On-prem appliances still held 68.90% of web filtering market size in 2025, reflecting historical capex cycles inside heavily regulated verticals. However, cloud deployment is the fastest-growing segment at 13.98% CAGR. The web filtering market benefits from enterprises peeling back branch boxes in favor of global point-of-presence (PoP) networks that scale elastically during traffic spikes. Cloudflare posted 27% top-line growth to USD 479.1 million in Q1 2025, partly on the back of nine-figure security contracts.
Latency myths are fading as PoP density climbs and vendors introduce smart-routing algorithms that steer sessions along optimal paths. Hybrid models—on-prem policy engines paired with cloud-fed intelligence—bridge migration for cautious buyers. Government agencies trial cloud gateways in sandboxed workloads, spurred by encrypted DNS mandates that demand modern inspection layers.
By Filtering Type: Keyword Filtering Gains Momentum
URL databases delivered 57.25% of 2025 revenue, but keyword filtering is projected to clock 13.12% CAGR, the quickest among all types. As attackers repurpose legitimate domains, keyword engines comb page text, metadata, and scripts to flag policy violations unseen by URL lists. That evolution keeps the web filtering market ahead of encrypted traffic growth because content inspection does not rely on domain visibility alone.
DNS filtering remains indispensable for zero-trust segmentation, supplying coarse blocklists that preempt known bad destinations. Meanwhile, AI-powered behavioral analytics fuse file-type and keyword logic to detect living-off-the-land exploits. Cisco’s DGA model exemplifies such cross-method synergies, yielding 50% higher accuracy. Education customers, juggling safety and academic freedom, now deploy nuanced keyword rules that weight context rather than raw terms.
By Organization Size: SME Adoption Accelerates
Large enterprises controlled 70.35% of 2025 spending thanks to hefty budgets and multi-layer security blueprints. Yet SMEs exhibit 13.41% CAGR as cloud delivery democratizes enterprise-grade protection. Affordable subscriptions permit small firms to harness the same policy engines processing cabinet-level U.S. agency traffic, shrinking the security maturity gap.
The web filtering market therefore sees volume expansion without trading down average selling prices, because per-user economics remain attractive. SMEs often select bundled SASE suites to sidestep integration chores, driving cross-sell momentum for leading platforms. Challenges persist around vertical-specific compliance, yet marketplaces of ready-made policy templates mitigate resource shortages.
By Industry Vertical: Education Sector Drives Growth
BFSI contributed 45.10% revenue in 2025 as compliance-heavy banks shield sensitive customer data from phishing and malvertising. However, education is the fastest-rising vertical at 12.19% CAGR. Georgia’s Senate Bill 351 obliges K-12 districts to filter social-media content by July 2026, spurring a wave of RFPs for classroom-compatible solutions. The web filtering market thus diversifies beyond corporate walls into public-sector budgets.
Higher-education institutions balance open research access with safeguarding students from malicious AI-generated pages, requiring granular identity-based policies. Suppliers roll out discounted licensing tiers and Chromebook agents engineered for bandwidth-constrained campuses. BFSI and healthcare continue as baseline revenue pillars, but incremental upside flows from government and telecom digital-trust initiatives that embed SWG into broader modernization projects.
Geography Analysis
North America retained 36.95% of global revenue in 2025 owing to mature regulatory mandates, zero-trust adoption, and incumbency of leading vendors. Budget turbulence from U.S. spending caps briefly delayed federal deals, yet Executive Order 14144 has reset urgency by codifying encrypted DNS timelines. Municipal school districts accelerate procurement to meet social-media filtering deadlines, expanding addressable spend.
Europe ranks next as GDPR, the Online Safety Act 2023, and diverse national privacy laws force service providers to deploy sophisticated inspection and data-loss prevention controls. Ofcom’s enforcement program obliges firms to submit illegal-content risk assessments, raising minimum baseline capability for SWG offerings. Digital-sovereignty demands drive interest in EU-hosted PoPs and local threat-intel feeds.
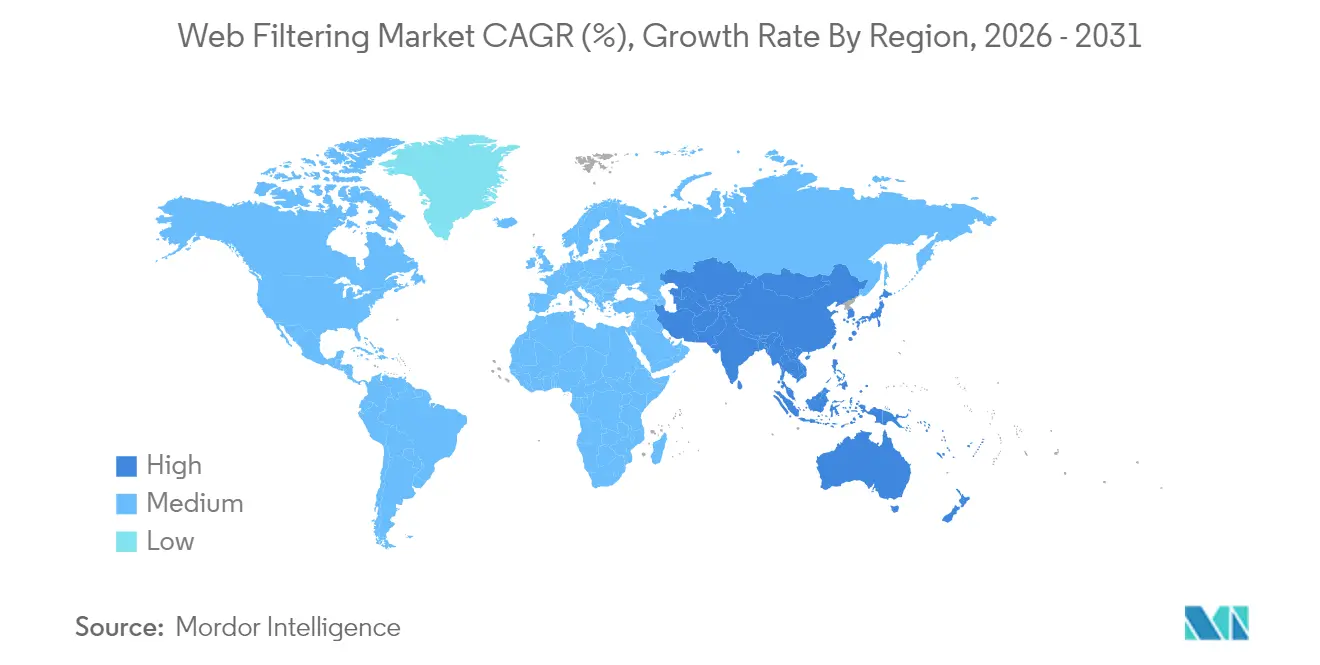
Asia-Pacific is the fastest-growing territory with 12.74% CAGR, propelled by India’s DPDPA, Indonesia’s child-protection regulation, and rapid cloud build-outs among digitally native businesses. Japan and South Korea craft smartphone security bills that will widen compliance scope to app stores, fortifying long-term demand. Fragmented maturity levels create openings for channel partners that bundle training, local language support, and regulatory guidance.

Regulatory Landscape
Web filtering deployments are shaped by overlapping cybersecurity and online-safety regimes that increasingly require demonstrable risk management, auditability, and protections for minors. In the European Union, the NIS2 transposition deadline in October 2024 and the related Commission Implementing Regulation (EU) 2024/2690 on cybersecurity risk-management requirements for certain digital services (including DNS-related services) raised the baseline for controls and evidence. That shift is pushing buyers toward platforms that can operationalize policy, logging, and reporting across distributed users and cloud gateways.
Outside Europe, policy momentum keeps expanding the compliance surface for acceptable-use and content controls. In the United States, NIST updated SP 800-53 with Release 5.2.0 in August 2025, reinforcing expectations for secure updates and resiliency and affecting how web filtering is engineered and managed in regulated environments. Malaysia passed its Online Safety Act in December 2024, and multiple jurisdictions continue to tighten restrictions on circumvention tools. For multinational organizations, the resulting trade-offs between security visibility, privacy obligations, and local content-access rules are adding complexity.
Value Chain Analysis
The web filtering value chain begins with core technology inputs such as URL/IP categorization databases, threat-intelligence and reputation scoring, and AI-driven content classification engines that operate across HTTP/HTTPS flows. These inputs are packaged into solutions (secure web gateways, DNS and URL filters, browser isolation, and secure enterprise browser components) and delivered via cloud points of presence, endpoint agents, or hybrid gateways that pair local enforcement with cloud lookups for real-time verdicts.
Distribution increasingly runs through integrators and embedded-channel partners, including managed security service providers, ISPs, networking and security OEMs, and education-focused resellers. They bundle policy templates, deployment services, and ongoing tuning. The launch of DNSFilter's OEM Partner Program in July 2026 points to embedding protective DNS and content filtering into third-party offerings under white-label models, which expands routes to market beyond direct enterprise subscriptions. It also elevates the role of APIs, SDKs, and continuously updated classification feeds.
Competitive Landscape
The web filtering market remains moderately fragmented. Zscaler, Palo Alto Networks, and Cloudflare extend platform breadth through AI-driven modules and global PoP expansion. Zscaler processed 0.5 trillion daily transactions and posted USD 678 million Q3 2025 revenue, reflecting scale advantages that feed its threat-intel algorithms[4]Zscaler Inc., “Third Quarter Fiscal 2025 Financial Results,” zscaler.com. Palo Alto Networks eyes USD 15 billion annual recurring revenue by 2030 via unified Next-Generation Security bundles that knit SWG, SD-WAN, and autonomous SOC features.
Strategic mergers and acquisitions reshape competitive positioning. Google closed the USD 32 billion Wiz acquisition in March 2025, injecting cloud-security DNA into Google Cloud services. Fortinet followed with Lacework, boosting workload-visibility and runtime threat detection inside its Unified SASE line. Check Point added Perimeter 81 for secure access as incumbents chase platform breadth.
Technology differentiation hinges on machine-learning fidelity, latency optimization, and breadth of compliance toolkits. Cisco’s AI-powered DGA module and Menlo Security’s Secure Enterprise Browser exemplify innovation paths meant to reduce false positives and contain zero-days at the browser layer. Education-centric vendors such as Securly capture niche share through purpose-built dashboards, while telecom operators white-label large-vendor stacks to upsell security over fiber and 5G footprints. Consolidation pressure may lift average selling prices, yet customer churn stays low once PoP footprint and policy libraries are embedded.
Web Filtering Industry Leaders
Broadcom Corporation
Cisco Systems, Inc.
Palo Alto Networks, Inc.
McAfee, Inc.
Fortinet, Inc.
- *Disclaimer: Major Players sorted in no particular order

Market Opportunities and Future Outlook
Encrypted web traffic and remote access patterns are increasing demand for architectures that preserve visibility without relying on legacy hub-and-spoke inspection. With most web traffic now encrypted, the practical focus shifts toward on-device or proximity-based inspection models that reduce backhaul latency while still supporting policy enforcement, reporting, and threat detection across hybrid workforces. That change creates differentiation across keyword and content classification, encrypted traffic categorization, and policy automation that can reduce the workload of complex tuning for understaffed security teams.
Regulatory and standards activity also creates additional whitespace for compliant, privacy-aware content controls, especially as child-safety and age-restricted access rules expand. The UK Children's Wellbeing and Schools Act 2026 empowers the Secretary of State to require ISPs to restrict access to certain content for children, while US legislative proposals in 2026 (including the SAFE for Kids Act and the KIDS Act) elevate the role of technical controls and verification measures for restricted categories. On the supply side, NetSTAR Global's March 2026 release of inCompass 4.0, positioned for OEM integration of AI-powered web classification and threat intelligence, supports continued demand for embeddable categorization and policy modules across platforms, ISPs, and device ecosystems.
Recent Industry Developments
- June 2026: Cisco unveiled Cisco Cloud Control for managing and defending critical IT infrastructure and expanded Live Protect coverage to N9000 series switches. Cisco is extending security operations and enforcement closer to network and cloud control planes, which can support tighter policy execution paths for web access and threat containment across distributed environments.
- March 2026: Palo Alto Networks announced updates to Prisma Browser aimed at securing modern work patterns, including agentic AI workflows. By strengthening protections at the browser layer, the company broadened secure web access controls where SaaS usage and encrypted sessions reduce the effectiveness of legacy perimeter-only filtering.
- May 2025: Fortinet finalized the Lacework acquisition and began integrating cloud-security analytics into its Unified SASE portfolio. The combination links workload visibility and cloud runtime signals with secure web gateway and access policies, reinforcing platform consolidation trends in enterprise web filtering procurement.


Research Methodology Framework and Report Scope
Market Definition and Coverage
For this methodology, the web filtering market covers software and delivered services that control access to web content by inspecting and allowing or blocking traffic using rules at the DNS, URL, keyword, or file-type level, across business, public sector, and education networks.
Scope exclusions: We exclude consumer browser plug-ins and standalone parental-control apps that are not deployed as an organizational security control.
Segmentation Overview
- By Component
- Solution
- Services
- By Deployment Mode
- On-premises
- Cloud
- By Filtering Type
- DNS Filtering
- Keyword Filtering
- URL Filtering
- File-type and Other Filtering
- By Organisation Size
- Large Enterprises
- Small and Medium Enterprises (SMEs)
- By Industry Vertical
- BFSI
- IT and Telecom
- Government
- Education
- Other Industry Verticals
- By Geography
- North America
- United States
- Canada
- Mexico
- Europe
- Germany
- United Kingdom
- France
- Italy
- Spain
- Russia
- Rest of Europe
- Asia-Pacific
- China
- Japan
- India
- South Korea
- Australia and New Zealand
- Rest of Asia-Pacific
- South America
- Brazil
- Argentina
- Rest of South America
- Middle East and Africa
- Middle East
- Saudi Arabia
- United Arab Emirates
- Turkey
- Rest of Middle East
- Africa
- South Africa
- Nigeria
- Rest of Africa
- Middle East
- North America
Data Sources, Market Sizing, and Validation
Desk Research
Desk research started with mapping the demand context for web access security and acceptable-use controls, then linking it to how organizations actually buy and deploy filtering tools. We used public sources such as NIST cybersecurity guidance, CISA advisories, FCC broadband indicators, OECD digital economy metrics, and ITU connectivity statistics to understand exposure, adoption pull, and infrastructure readiness.
To shape the revenue model inputs, we also reviewed company filings and investor presentations, product documentation, government procurement notices, and security press coverage that describes deployment patterns like cloud delivery versus on-premises gateways. Where available, we used paid subscriptions for company financials and intelligence, patent databases to track security feature direction, and a global contracts and tenders feed to gauge public sector buying momentum. The desk sources named above are illustrative only, and we used additional references to collect data, validate assumptions, and clarify open questions.
Primary Interviews and Surveys
Primary work focused on validating what is actually counted as web filtering spend, and how vendors package pricing when filtering is bundled with adjacent web security functions. We spoke with a mix of solution owners, security architects, channel partners, and buyers across large organizations and mid-market firms, then sanity-checked region-level adoption signals across APAC, EMEA, and the Americas so the model did not overfit to one geography.
Distribution of primary research fieldwork respondents
| Company type | Respondent position | Region |
|---|---|---|
| Top tier: 32% | CXOs: 14% | APAC: 41% |
| Mid tier: 52% | Functional/Unit leaders: 41% | EMEA: 34% |
| Smaller Players: 16% | Managers: 45% | Americas: 25% |
Market-Sizing & Forecasting
Sizing was built using a top-down approach once, where enterprise and public sector security spending patterns were reconstructed into a web filtering demand pool using adoption and deployment indicators, and then translated into revenues using realistic price and coverage assumptions. To keep it practical, we treated the market as the paid control layer that filters web access, whether it is delivered from the cloud or installed on-premises.
Selective bottom-up approximations were then used to corroborate totals, such as sampled vendor revenue disclosures, channel feedback on deal sizes, and a volume-by-ASP check using seats (or users) and protected traffic endpoints. Inputs tracked in the model included the cloud versus on-prem mix, typical subscription term lengths, bundling rates with secure web gateway functions, seat coverage per organization, and the pace of HTTPS inspection adoption, since it affects compute requirements and pricing behavior. When bottom-up inputs were missing for smaller providers, we filled gaps using conservative revenue-per-customer ranges, then cross-checked those ranges with partner feedback before final totals were set.
Forecasting relied mainly on scenario analysis that tied growth to measurable drivers like workforce distribution, regulatory attention to web access controls, cloud security adoption, and refresh cycles of network security stacks. The final growth path was adjusted only after expert feedback confirmed the realism of adoption speed and expected pricing progression.
Data Validation & Update Cycle
Validation was done through repeated variance checks across model layers, so totals matched what independent signals implied for adoption and spending intensity. We compared outputs against adjacent web security spend patterns, cloud delivery penetration, and procurement activity, and then reviewed and corrected any outliers using documented assumption changes.
Before sign-off, the work goes through a multi-step analyst review that checks math integrity, unit consistency, and year-over-year movements that do not match explained drivers. If a material mismatch shows up, re-contact is triggered with relevant interviewees to confirm whether the gap is real or caused by a modeling input. Reports are refreshed annually, with interim updates when major events shift demand or pricing, and a final pre-delivery pass is completed so clients receive the most current view.
Mordor Intelligence's Web Filtering Market Sizing Compared With Other Published Estimates
Published market sizes for web filtering can look far apart even when they appear to cover the same scope, because the term is used loosely across network security and web access protection. Differences usually come from what gets counted as web filtering revenue, which year is treated as current, and how cloud subscriptions and bundled suites are handled.
The main gap comes from whether secure web gateway and broader cloud-delivered web security suites are fully included, or only counted when filtering is sold as a distinct line item. In Mordor Intelligence's model, we count revenue only when web filtering functionality is delivered as an organizational control across DNS, URL, keyword, or file-type enforcement (not as consumer add-ons). Other gaps are driven by the assumed pace of subscription price changes, the handling of currency conversion timing for global revenues, and refresh cadence that may miss faster adoption in certain regions.
Benchmark comparison
| Source | Market Size | Gaps in Research Methodology |
|---|---|---|
| Mordor Intelligence | USD 5.51 B (2026) | |
| Industry Publisher A | USD 5.46 B (2025) | Uses a closely related label (web content filtering solutions) and a different base year, and it can mix enterprise controls with broader content filtering tools, which shifts what is counted as market revenue. |
| Technology Advisory B | USD 5.46 B (2025) | Anchors sizing to a distinct forecast window and can apply a more aggressive growth path for suite-led adoption, which can inflate early-year values when bundling is not separated from pure filtering spend. |
The spread in the table mainly reflects scope and timing, not a single math difference, since base year choices and bundling treatment can move totals quickly in this category. By keeping counted revenue tied to clear filtering enforcement functions, then checking the result with pricing and adoption signals, the estimate remains traceable and repeatable for planning.


Key Questions Answered in the Report
What is the current value of the web filtering market?
The web filtering market size reached USD 5.51 billion in 2026 and is projected to hit USD 9.68 billion by 2031 at a 11.91% CAGR.
Which component is expanding the quickest?
Services are the fastest-growing component, posting a 13.62% CAGR as enterprises seek managed expertise to configure complex AI-driven filters.
Why is Asia-Pacific the fastest-growing region?
New privacy statutes such as India’s DPDPA and Indonesia’s Regulation 17/2025, paired with rapid cloud adoption, fuel a 12.74% CAGR in Asia-Pacific.
How are encrypted DNS protocols affecting filtering strategies?
DNS-over-HTTPS can bypass legacy resolvers, so organizations are adopting DoH-aware gateways and identity-centric policy engines to retain visibility.
What role does SASE play in purchasing decisions?
Buyers increasingly bundle secure web gateways into broader SASE contracts, simplifying licensing and ensuring consistent zero-trust enforcement across users and locations.
Which industry vertical is growing fastest?
Education leads with a 12.19% CAGR due to new mandates such as Georgia’s SB 351 requiring comprehensive social-media filtering in K-12 schools.
Page last updated on:






