Web Application Firewall Market Size and Share
Market Overview
| Study Period | 2020 - 2031 |
|---|---|
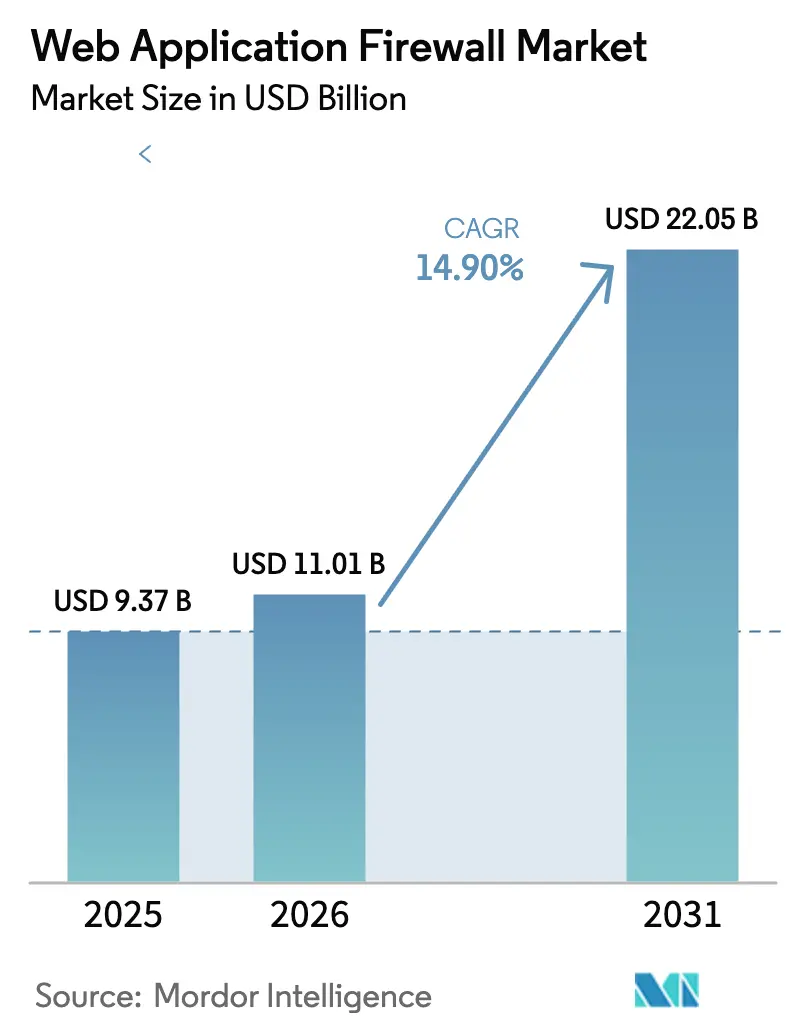
| Market Size (2026) | USD 11.01 Billion |
| Market Size (2031) | USD 22.05 Billion |
| Growth Rate (2026 - 2031) | 14.90% CAGR |
| Fastest Growing Market | Middle East and Africa |
| Largest Market | North America |
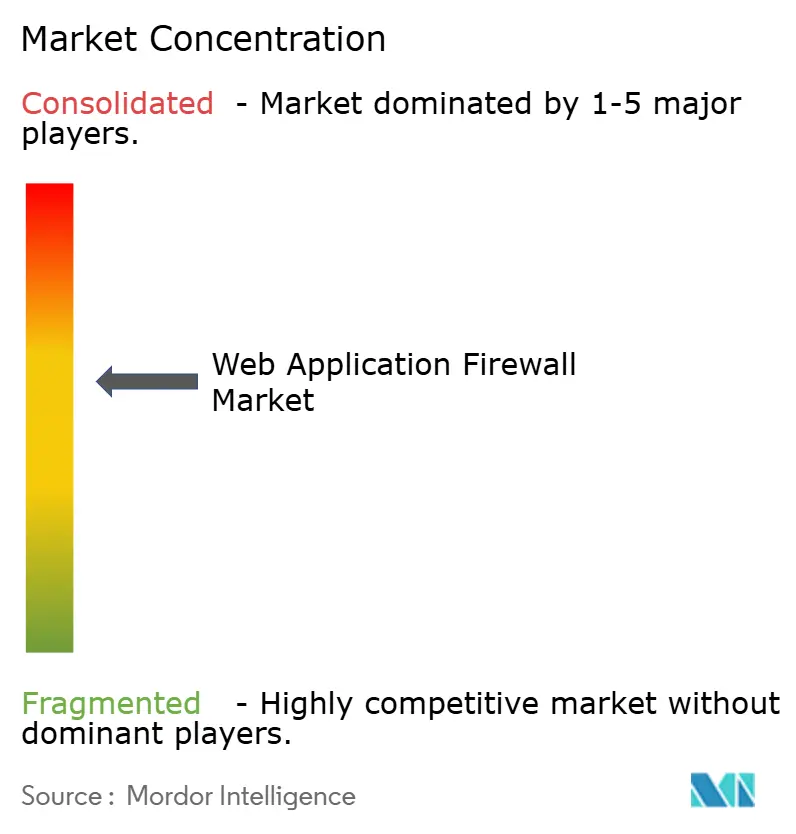
| Market Concentration | Medium |
Major Players*Disclaimer: Major Players sorted in no particular order Image © Mordor Intelligence. Reuse requires attribution under CC BY 4.0. | |
Web Application Firewall Market Analysis by Mordor Intelligence
The Web application firewall market size was valued at USD 9.37 billion in 2025 and estimated to grow from USD 11.01 billion in 2026 to reach USD 22.05 billion by 2031, at a CAGR of 14.9% during the forecast period 2026-2031. The expansion pivots on four powerful trends: skyrocketing API-layer abuse that forces inspection of GraphQL, gRPC and WebSocket traffic, rapid shift to cloud-native micro-services, tightening global privacy mandates that elevate real-time monitoring to a legal necessity, and edge-native defenses that lower latency while applying machine-learning analytics at the point of presence. Competitive intensity accelerates as hyperscale’s bundle native WAF into cloud subscriptions, specialist CDNs monetize sub-10-millisecond inspection, and legacy appliance vendors modernize through virtual editions. Venture funding targets early-stage start-ups embedding extended Berkeley Packet Filter (eBPF) for kernel-level inspection, while open-source Core Rule Set adoption tempers pricing power but not demand for managed SOC integration. Budget-constrained small and medium enterprises enter the Web application firewall market at record pace because cloud consumption pricing removes appliance capex and reduces deployment from weeks to hours.
Key Report Takeaways
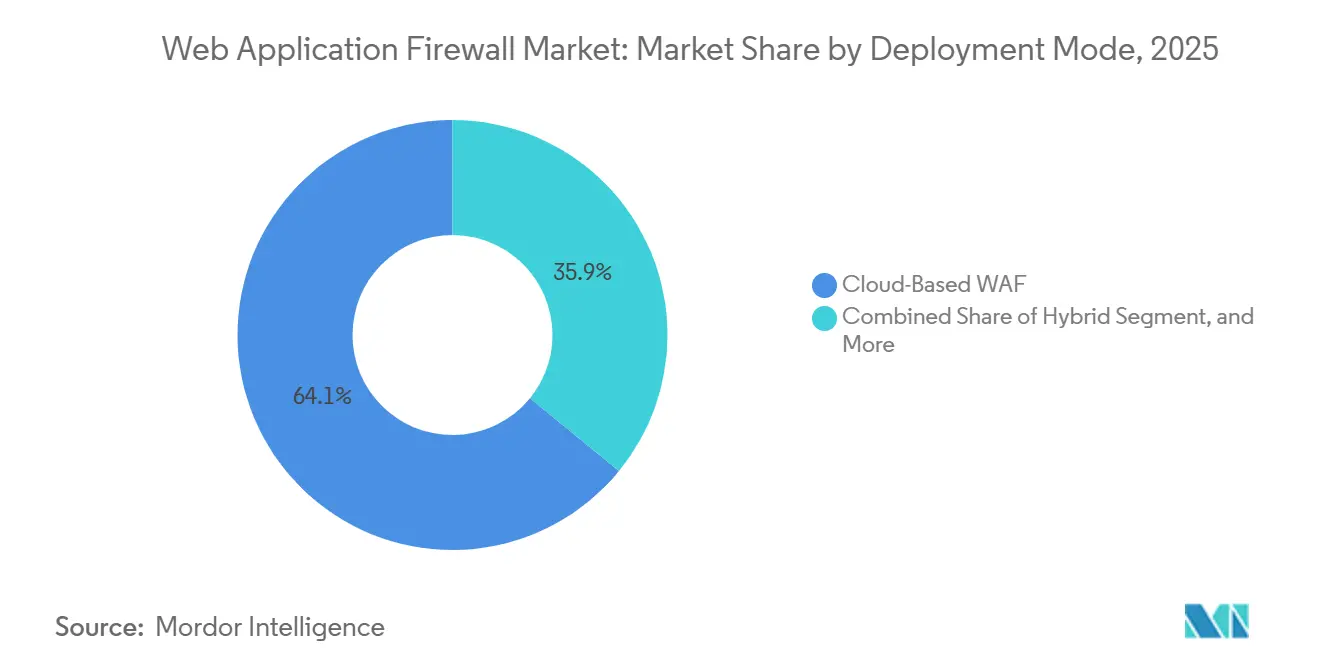
- By deployment mode, cloud-based WAF led with 64.11% revenue share in 2025, and hybrid configurations are advancing at a 15.57% CAGR through 2031 as organizations balance public-cloud agility with on-premises data-residency rules.
- By component, solutions accounted for 71.29% of 2025 spending, while professional and managed services represent the fastest-growing slice, rising at a 15.97% CAGR to 2031.
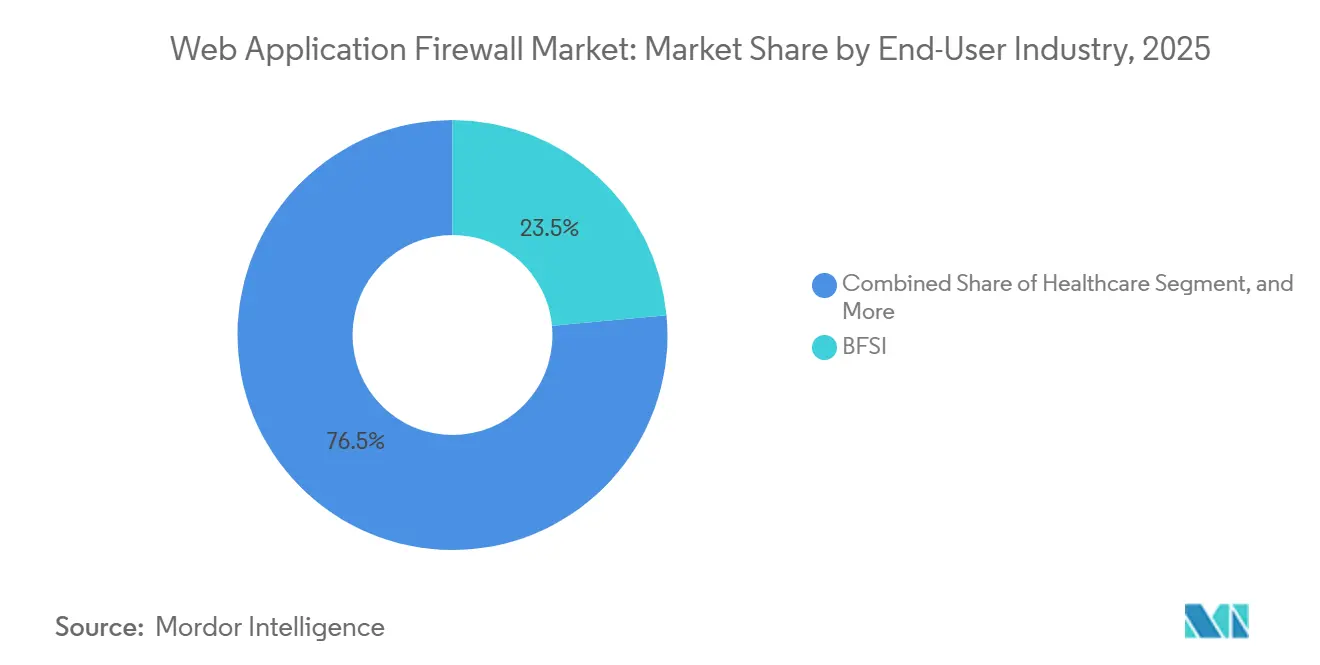
- By end-user industry, BFSI commanded 23.54% of 2025 demand; healthcare is forecast to expand at a 15.68% CAGR through 2031 because January 2026 HIPAA guidance makes virtual patching and SIEM integration compulsory.
- By enterprise size, large organizations captured 61.56% of 2025 revenue, yet small and medium enterprises are projected to climb at a 15.73% CAGR to 2031 thanks to cloud subscription economics.
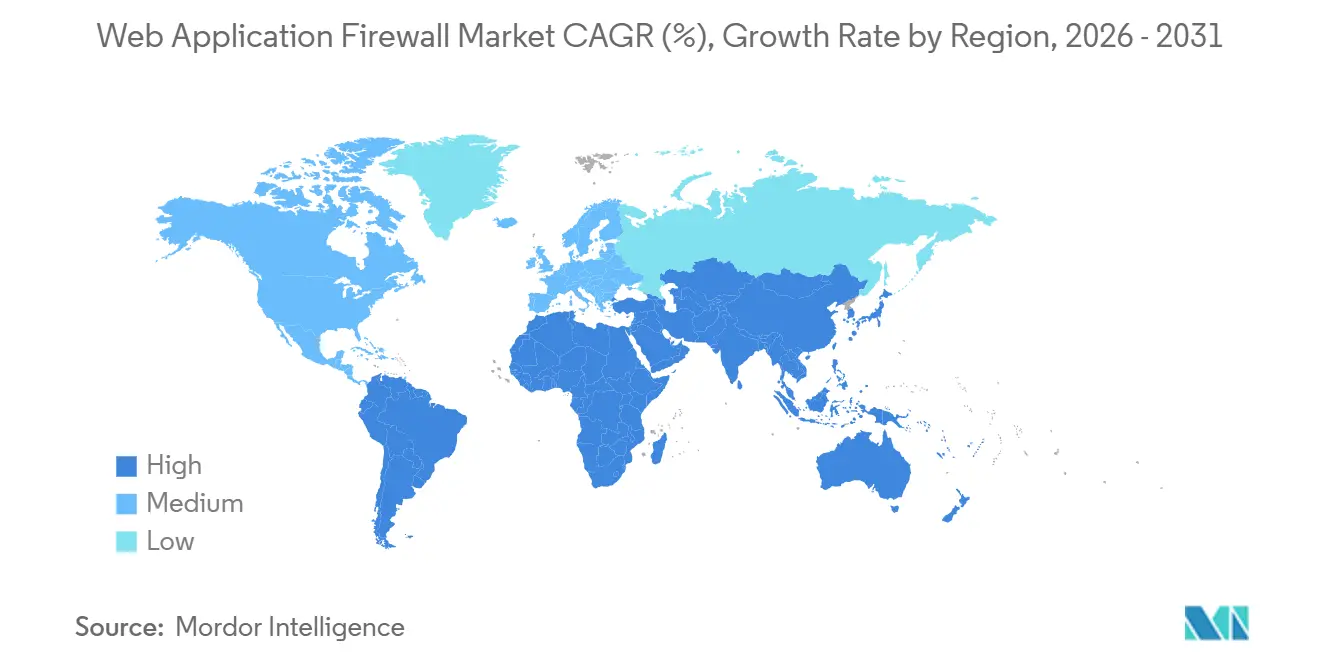
- By geography, North America held 38.73% revenue share in 2025, while the Middle East and Africa is projected to grow at a 15.79% CAGR through 2031, reflecting aggressive national cybersecurity mandates and cloud-first public-sector programs.
Note: Market size and forecast figures in this report are generated using Mordor Intelligence’s proprietary estimation framework, updated with the latest available data and insights as of January 2026.
Global Web Application Firewall Market Trends and Insights
Drivers Impact Analysis*
| Driver | (~) % Impact on CAGR Forecast | Geographic Relevance | Impact Timeline |
|---|---|---|---|
| API-Attack Volume Surge | +3.20% | Global, with acute concentration in North America, Europe, and APAC financial hubs | Short term (≤ 2 years) |
| Cloud-Native and Micro-Services Proliferation | +2.80% | Global, led by North America and Europe; rapid adoption in APAC and Middle East | Medium term (2-4 years) |
| Stricter Global Data-Protection Mandates | +2.50% | Europe (GDPR, NIS2, DORA), North America (CCPA), Middle East (UAE DPDP Act), APAC (China PIPL, India DPDP Act), South America (Brazil LGPD) | Medium term (2-4 years) |
| Edge/CDN Integration for Performance | +2.10% | Global, with early gains in North America and Europe; spill-over to APAC and Middle East | Long term (≥ 4 years) |
| AI-Enhanced Threat Analytics at the Edge | +1.90% | North America and Europe core; emerging adoption in Middle East and APAC | Long term (≥ 4 years) |
| "Security-as-Code" DevSecOps Adoption | +1.50% | North America, Europe, and APAC technology sectors; gradual diffusion to other regions | Long term (≥ 4 years) |
| Source: Mordor Intelligence | |||
API-Attack Volume Surge
API endpoints now attract the majority of hostile traffic, with 150 billion API-specific events logged in 2024, a figure that continues to climb as attackers exploit schema introspection and batched mutations.[1]Alena Boldyreva, “API Attack Statistics and Trends,” Wallarm, WALLARM.COM Layer 7 DDoS activity rose 94% between Q1 2023 and Q4 2024, passing 1.1 trillion requests a month, pressuring legacy engines that only parse basic HTTP semantics.[2]Cloudflare Research Team, “DDoS Threat Report Q4 2024,” Cloudflare Blog, CLOUDFLARE.COM Enterprises respond by adding contract-driven validation that rejects requests violating OpenAPI definitions, a shift that effectively extends perimeter defense into micro-service contracts. Vendors embedding GraphQL parsers and gRPC decoders win share in the Web application firewall market as traditional signature databases fail to understand rich payload constructs. The trend drives procurement toward platforms able to correlate API traffic with bot-management signals and behavioural baselines for automated cutoff.
Cloud-Native and Micro-Services Proliferation
Seventy-plus percent of enterprises running Kubernetes generate thousands of ephemeral pods, each spawning short-lived endpoints that overwhelm static appliance configurations. Edge architectures capable of spinning a WAF instance in under 150 milliseconds now align with serverless life cycles, matching workload elasticity and ensuring the Web application firewall market provides protection without hairpin routing penalties. Service-mesh sidecars push inspection directly into intra-cluster traffic, eliminating network detours while inheriting policy from declarative YAML pipelines. Central to adoption is the ability to manage WAF as code, embedding rules inside Infrastructure-as-Code templates so every build inherits hardened defaults. Vendors unable to decouple inspection from hardware see share erosion as container-native buyers prize speed of deployment over rack-mounted throughput.
Stricter Global Data-Protection Mandates
The Digital Operational Resilience Act (DORA) now obliges European financial entities to furnish real-time telemetry and breach notification within 24 hours, making automated WAF logging non-negotiable.[3]European Commission, “Digital Operational Resilience Act,” EUROPA.EU California’s CCPA amendments effective January 2026 broaden disclosure triggers to “reasonably likely” exposure, further penalizing misconfigurations. China’s PIPL and MLPS 2.0 insist that critical infrastructure terminate inspection domestically, fragmenting deployment into compliance silos and lifting hybrid adoption in the Web application firewall market. The patchwork spurs demand for unified policy managers that abstract jurisdictional constraints while still producing localized audit trails. Vendors offering geo-fenced inspection nodes and Arabic or Turkish log localization win bids across Middle East public-sector procurements.
Edge/CDN Integration for Performance
Rejecting malicious traffic at 330+ points of presence precludes backhaul latency and trims origin-server load, saving bandwidth costs during volumetric assaults. JA3 fingerprinting and ASN blocking augment traditional IP reputation, letting operators quarantine whole proxy networks with a single rule. Carrier-grade CDNs cache WAF verdicts, ensuring legitimate users see sub-10-millisecond responses even under active Layer 7 floods. As WebRTC, gaming and real-time collaboration tools demand low-latency paths, edge-native inspection becomes table stakes, pushing more buyers toward CDN-embedded offerings. This architecture cements the Web application firewall market position of platform players that already serve content near the end user.
Restraints Impact Analysis*
| Restraint | (~) % Impact on CAGR Forecast | Geographic Relevance | Impact Timeline |
|---|---|---|---|
| High False-Positive Business Disruption | -1.80% | Global, particularly acute in retail and e-commerce during peak demand periods | Short term (≤ 2 years) |
| Talent Gap for Advanced Tuning | -1.50% | Global, with severe shortages in North America, Europe, and APAC; emerging markets face even steeper deficits | Medium term (2-4 years) |
| QUIC/HTTP-3 Encryption Inspection Cost | -1.20% | Global, with higher impact in regions with stringent data-residency requirements (Europe, China, Middle East) | Medium term (2-4 years) |
| Open-Source WAF Dilution | -0.90% | Global, with strongest impact in SME segment and cost-sensitive emerging markets | Long term (≥ 4 years) |
| Source: Mordor Intelligence | |||
High False-Positive Business Disruption
Default paranoia levels in Core Rule Set trigger 10-15% false positives, blocking carts on Black Friday and inflating support call volume. Retailers confront a lose-lose scenario of lost revenue versus added fraud, prompting them to invest in sandbox tuning environments and real-time rule rollback features. Machine-learning overlays improve balanced accuracy by 45% but demand continuous retraining and high-quality labels, raising operational cost. Commercial vendors now package managed-tuning subscriptions that promise sub-1% false-positive rates, a differentiator within the Web application firewall market. Buyers increasingly request proof points showing decreased customer drop-offs during flash-sale simulations before signing multiyear contracts.
Talent Gap for Advanced Tuning
A 4.76-million-person cybersecurity shortfall leaves 67% of organizations understaffed; 54% attribute recent breaches to skill deficits. WAF tuning requires mastery of regex, HTTP nuances and application logic, a mix rare in mid-market salary bands. Managed services fill the gap by pairing 24 7 SOC analysts with automated policy pipelines, converting head-count shortages into operating expenditure. Demand for turnkey expertise fuels double-digit growth in the services slice of the Web application firewall market, as SMEs outsource everything from alert triage to compliance reporting.
*Our forecasts treat driver/restraint impacts as directional, not additive. The impact forecasts reflect baseline growth, mix effects, and variable interactions.
Segment Analysis
By Deployment Mode: Hybrid Configurations Reconcile Compliance and Agility
Hybrid architectures captured growing mindshare once regulators insisted that protected health information and cardholder data remain on premises while public websites stayed in cloud. The Web application firewall market share for cloud-based offerings stood at 64.11% in 2025, but hybrid is projected to advance at a 15.57% CAGR, the category’s fastest pace. CFOs like hybrid’s ability to cap capex while appeasing auditors who prohibit foreign inspection points. Policy sprawl, however, bedevils security staff because on-premises appliances and cloud consoles expose dissimilar rule syntax. Central managers that push a unified JSON schema to F5 appliances, AWS WAF and Azure Application Gateway reduce drift, making them a key purchase criterion. Vendors without multi-cloud abstraction see churn as buyers standardize on single dashboards that track every enforcement point. As India and China enforce data-localization, demand rises for local pop deployment kits bundled with on-premises keys, expanding the Web application firewall market size associated with hybrid rollouts.
Simultaneously, cloud-only adopters remain sensitive to vendor lock-in. Exit strategies rooted in Terraform modules gain favour because they promise portability should pricing spike. Marketplace billing accelerates proof-of-concepts, letting teams activate pay-as-you-go WAF in under an hour, a speed impossible with procurement committees requesting hardware quotes. Consequently, legacy appliance revenue grows only in regulated niches, whereas subscription ARR scales with each new micro-service pushed into production.


By Component: Managed Services Absorb Tuning Complexity
Solutions dominated spending at 71.29% in 2025, but tight labour markets push professional and managed services toward a 15.97% CAGR, the quickest trajectory within components. Buyers benchmark providers on time-to-contain zero-day injections and mean-time-to-resolve false positives, metrics that strongly influence renewal decisions. Managed SOC bundles now stitch WAF telemetry to endpoint and network sensors, building a unified kill chain that accelerates response. Because middle-market companies lack 24 7 coverage, they flock to turnkey offerings that issue rolling monthly updates without change-advisory boards, boosting recurring revenue across the Web application firewall market size.
Providers differentiate using proprietary threat-intelligence feeds and language-model assistants that auto-generate ModSecurity regex in plain English. Those capabilities win accounts that traditionally shunned managed security for fear of vendor opacity. Down-market, white-label platforms allow telecom carriers to resell branded WAF, widening distribution and embedding inspection deeper into broadband bundles. The Web application firewall market therefore tilts toward as-a-service consumption, relegating perpetual licenses to legacy renewal cycles.
By End-User Industry: Healthcare Compliance Mandates Accelerate Adoption
Financial services retained the largest stake at 23.54% in 2025, a testament to PCI DSS v4.0’s upgrade of WAF from compensatory to baseline control. Yet the healthcare vertical is set to expand fastest, with a 15.68% CAGR through 2031 after January 2026 HIPAA guidance codified virtual patching and SIEM integration. Hospitals and telemedicine platforms replace appliance-based stacks with cloud subscriptions that ship weekly rule updates to thwart ransomware payloads targeting EMR portals. The Web application firewall market size tied to healthcare spikes whenever regulators levy fines for unsecured APIs leaking protected data.
Other verticals follow unique risk profiles. Retail platforms demand bot mitigation that thwarts card-testing scripts without ruining user experience, explaining why they test captchas on staging sites before go-live. Energy utilities integrate WAF with operational-technology gateways to segment industrial protocols, although deep packet inspection for Modbus or DNP3 remains nascent. Defense contractors insist on on-premises inspection nodes cleared for secret networks, creating niche spaces for Common Criteria-certified appliances.
By Enterprise Size: SMEs Favor Cloud-Economics Over Capex
Large organizations produced 61.56% of 2025 billings, but SMEs will outpace them at a 15.73% CAGR as cloud subscriptions allow cost alignment with traffic bursts. SaaS pricing eradicates the stranded capacity typical when a rack-mounted WAF idles at 10% utilization during off-peak months. Moreover, aggregated telemetry from millions of SME domains gives cloud vendors broader visibility, yielding faster zero-day signature rollout that levels the playing field against big-budget banks. The Web application firewall market share for subscription models thus climbs each quarter.
SME buyers, however, often struggle to customize rules for bespoke business logic. Vendors counter with policy-recommendation engines powered by language models that propose exceptions based on historical false-positive logs. Pay-per-request billing resonates with seasonally spiky workloads such as ticket sales or tax-filing portals. Conversely, enterprises negotiate flat-rate global contracts, bundling WAF with CDN and object storage minimums to gain volume discounts. The dual purchasing tracks coexist, making pricing transparency a competitive differentiator.
Geography Analysis
North America supplied 38.73% of Web application firewall market revenue in 2025. Continuous mandates from CCPA expansions to mandatory PCI DSS v4.0 compliance create a buyer culture that treats WAF as essential infrastructure rather than optional add-on. Edge-network saturation by hyperscalers, coupled with the highest density of SOC talent, fosters rapid feature rollouts that set functional expectations worldwide. Canada’s provincial privacy acts drive hybrid demand, while Mexican near-shore expansions funnel new e-commerce traffic through U.S.-based inspection nodes, sustaining cross-border managed-service revenue.
Europe maintains strict oversight through GDPR, NIS2 and DORA, pushing enterprises to demonstrate real-time monitoring and 24-hour incident reporting. Schrems II rulings complicate trans-Atlantic data flows, so many firms deploy regional WAF clusters inside EU sovereign clouds, enlarging the European slice of the Web application firewall market. National agencies like Germany’s BSI and France’s ANSSI issue sector frameworks that influence vendor product roadmaps, especially the requirement for tamper-evident audit logs delivered in language-specific formats. Brexit leaves the United Kingdom maintaining parallel yet similar standards, forcing multinational banks to map dual compliance regimes.
Asia-Pacific shows the steepest adoption curve as China enforces PIPL and MLPS 2.0 and India finalizes its Digital Personal Data Protection Act. Both regimes require in-country inspection, stimulating domestic data-center buildouts by foreign vendors. Japan’s FSA guidance for fintech apps and South Korea’s PIPA sustain high spend among electronic payments providers. Start-ups in Indonesia and Vietnam prefer cloud subscriptions that remix regional compliance with cost control, further enlarging the Web application firewall market size across APAC.
The Middle East and Africa projects the highest CAGR at 15.79% through 2031, spurred by UAE DPDP Act mandates and Saudi Arabia’s cybersecurity controls. Vision 2030 megaprojects digitize public services, requiring Arabic-language log support and local SOC integration. Israel’s innovation ecosystem spawns AI-driven WAF start-ups that export to Gulf Cooperation Council neighbours. South America follows with LGPD-driven modernization in Brazil and resolution 4.893 that explicitly requires WAF for financial institutions. Africa remains early-stage, though South Africa’s POPIA nudges banking and telecom operators toward pilot deployments, adding incremental volume to the global Web application firewall market.

Competitive Landscape
No single vendor exceeds 15% share, signalling moderate fragmentation in the Web application firewall market. Cloudflare, Akamai and Fastly win on global edge footprints and sub-10-millisecond latency, luring digital-native firms seeking performance parity with hyperscalers. AWS, Microsoft Azure and Google Cloud package managed WAF into broader cloud bundles, exploiting near-zero delivery cost to encircle appliance incumbents. F5, Fortinet and Barracuda reposition through SaaS editions and centralized policy consoles, aiming to defend regulated verticals unwilling to relinquish on-premises keys.
Artificial-intelligence capabilities differentiate current releases. Microsoft’s Security Copilot translates natural-language policy into regex, shrinking tuning cycles and lowering skills thresholds. Akamai’s Firewall for AI blocks prompt-injection attacks against large-language-model endpoints, addressing a gap in traditional OWASP taxonomies. BarracudaONE unifies email, network firewall and WAF in a single pane, targeting mid-market fatigue with tool sprawl. Emerging players leverage eBPF for kernel-space inspection, slashing latency to microseconds, yet must still establish global POPs to meet multi-region SLA expectations.
Open-source Core Rule Set v4.18.0 underpins AWS WAF and Azure Application Gateway, commoditizing baseline protections and putting pricing pressure on signature updates. Vendors now emphasize managed rulesets, threat-intel alignment and indemnity warranties as upsell levers. Integrations with SIEM suites and DevOps pipelines become table stakes, ensuring that the Web application firewall market remains dynamic as buyers chase lower friction between developers and security teams.
Web Application Firewall Industry Leaders
Akamai Technologies Inc.
Barracuda Networks Inc.
Cloudflare Inc.
Citrix Systems, Inc.
Qualys, Inc.
- *Disclaimer: Major Players sorted in no particular order

Recent Industry Developments
- February 2026: Cloudflare introduced adaptive rate-limiting that adjusts thresholds on live traffic baselines, cutting false positives by 30% while preserving credential-stuffing detection efficacy.
- January 2026: The U.S. Department of Health and Human Services released guidance requiring virtual patching, SIEM integration and 90-day log retention under HIPAA, accelerating healthcare WAF adoption.
- December 2024: Akamai completed the acquisition of Noname Security for USD 450 million, expanding API protection capabilities.
- December 2025: Palo Alto Networks expanded its Google Cloud partnership, integrating Prisma Cloud with Cloud Armor for unified multi-cloud policy enforcement.


Global Web Application Firewall Market Report Scope
The Web Application Firewall Market Report is Segmented by Deployment Mode (Cloud-Based WAF, On-Premises/Appliance, Hybrid), Component (Solutions, Professional and Managed Services), End-User Industry (BFSI, Healthcare, IT and Telecom, Industrial and Defense, Retail and E-Commerce, Energy and Utilities, Manufacturing, Other End-User Industry), Enterprise Size (Small and Medium Enterprises, Large Enterprises), and Geography (North America, Europe, Asia-Pacific, Middle East, Africa, South America). The Market Forecasts are Provided in Terms of Value (USD).
| Cloud-Based WAF |
| On-Premises / Appliance |
| Hybrid |
| Solutions |
| Professional and Managed Services |
| BFSI |
| Healthcare |
| IT and Telecom |
| Industrial and Defense |
| Retail and E-Commerce |
| Energy and Utilities |
| Manufacturing |
| Other End-User Industry |
| Small and Medium Enterprises (SMEs) |
| Large Enterprises |
| North America | United States |
| Canada | |
| Mexico | |
| Europe | United Kingdom |
| Germany | |
| France | |
| Italy | |
| Rest of Europe | |
| Asia-Pacific | China |
| Japan | |
| India | |
| South Korea | |
| Rest of Asia-Pacific | |
| Middle East | Israel |
| Saudi Arabia | |
| United Arab Emirates | |
| Turkey | |
| Rest of Middle East | |
| Africa | South Africa |
| Egypt | |
| Rest of Africa | |
| South America | Brazil |
| Argentina | |
| Rest of South America |
| By Deployment Mode | Cloud-Based WAF | |
| On-Premises / Appliance | ||
| Hybrid | ||
| By Component | Solutions | |
| Professional and Managed Services | ||
| By End-User Industry | BFSI | |
| Healthcare | ||
| IT and Telecom | ||
| Industrial and Defense | ||
| Retail and E-Commerce | ||
| Energy and Utilities | ||
| Manufacturing | ||
| Other End-User Industry | ||
| By Enterprise Size | Small and Medium Enterprises (SMEs) | |
| Large Enterprises | ||
| By Geography | North America | United States |
| Canada | ||
| Mexico | ||
| Europe | United Kingdom | |
| Germany | ||
| France | ||
| Italy | ||
| Rest of Europe | ||
| Asia-Pacific | China | |
| Japan | ||
| India | ||
| South Korea | ||
| Rest of Asia-Pacific | ||
| Middle East | Israel | |
| Saudi Arabia | ||
| United Arab Emirates | ||
| Turkey | ||
| Rest of Middle East | ||
| Africa | South Africa | |
| Egypt | ||
| Rest of Africa | ||
| South America | Brazil | |
| Argentina | ||
| Rest of South America | ||


Key Questions Answered in the Report
What is the projected CAGR for web application firewall spending between 2026 and 2031?
Spending is forecast to rise at a 14.9% CAGR, more than doubling over the period.
Which deployment approach is gaining momentum the fastest?
Hybrid configurations are growing at a 15.57% CAGR because they align cloud agility with on-premises data-residency mandates.
How large is the share held by cloud-based WAF offerings today?
Cloud solutions already account for 64.11% of 2025 revenue and continue to expand on the back of consumption-based pricing.
Which customer segment is set to outpace others in growth?
Small and medium enterprises are expected to advance at a 15.73% CAGR as subscription models remove upfront appliance costs.
Where is regional uptake most pronounced through 2031?
The Middle East and Africa leads in growth with a 15.79% CAGR, driven by new national cybersecurity regulations and cloud-first government projects.
What vertical shows the strongest forward trajectory?
Healthcare is advancing at a 15.68% CAGR after January 2026 HIPAA guidance made real-time virtual patching and SIEM integration compulsory.
Page last updated on:


