
Wearable Robots And Exoskeletons Market Size and Share
Market Overview
| Study Period | 2020 - 2031 |
|---|---|
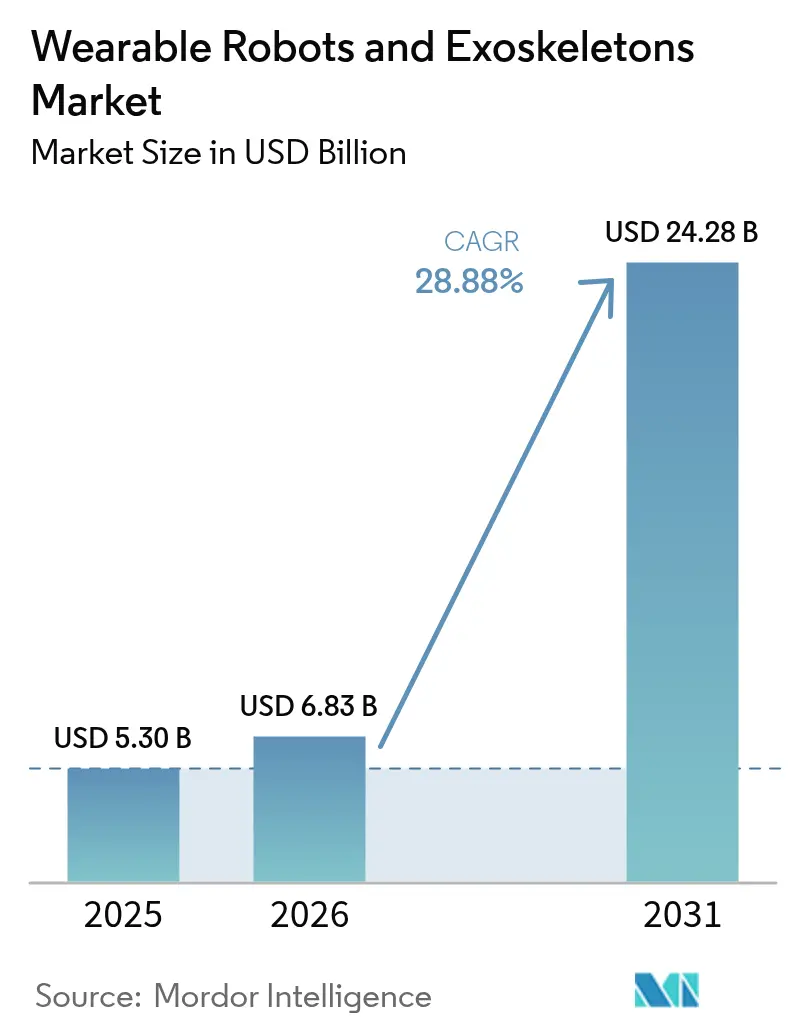
| Market Size (2026) | USD 6.83 Billion |
| Market Size (2031) | USD 24.28 Billion |
| Growth Rate (2026 - 2031) | 28.88% CAGR |
| Fastest Growing Market | Asia Pacific |
| Largest Market | North America |
| Market Concentration | Medium |
Major Players *Disclaimer: Major Players sorted in no particular order Image © Mordor Intelligence. Reuse requires attribution under CC BY 4.0. | |
Wearable Robots And Exoskeletons Market Analysis by Mordor Intelligence
The wearable robots and exoskeletons market size is expected to grow from USD 5.30 billion in 2025 to USD 6.83 billion in 2026 and is forecast to reach USD 24.28 billion by 2031 at 28.88% CAGR over 2026-2031. This growth trajectory underscores a widening gap between rising musculoskeletal-disorder prevalence, surging defense budgets, and employer mandates that prioritize active ergonomics over passive aids. The United States Department of Defense raised fiscal-year 2025 RDT&E funding for soldier-augmentation systems, while the Department of Veterans Affairs removed continuous-supervision requirements that once limited in-home neuro-rehabilitation. Battery-pack prices dipped below USD 140 per kWh in 2024, making full-shift powered designs feasible for logistics fleets. Japanese and European long-term care programs now reimburse assistive robots, expanding the addressable base in super-aged societies. Industrial pilots led by DHL and Hyundai point to rapid corporate adoption once injury-reduction targets become codified in safety KPIs .
Key Report Takeaways
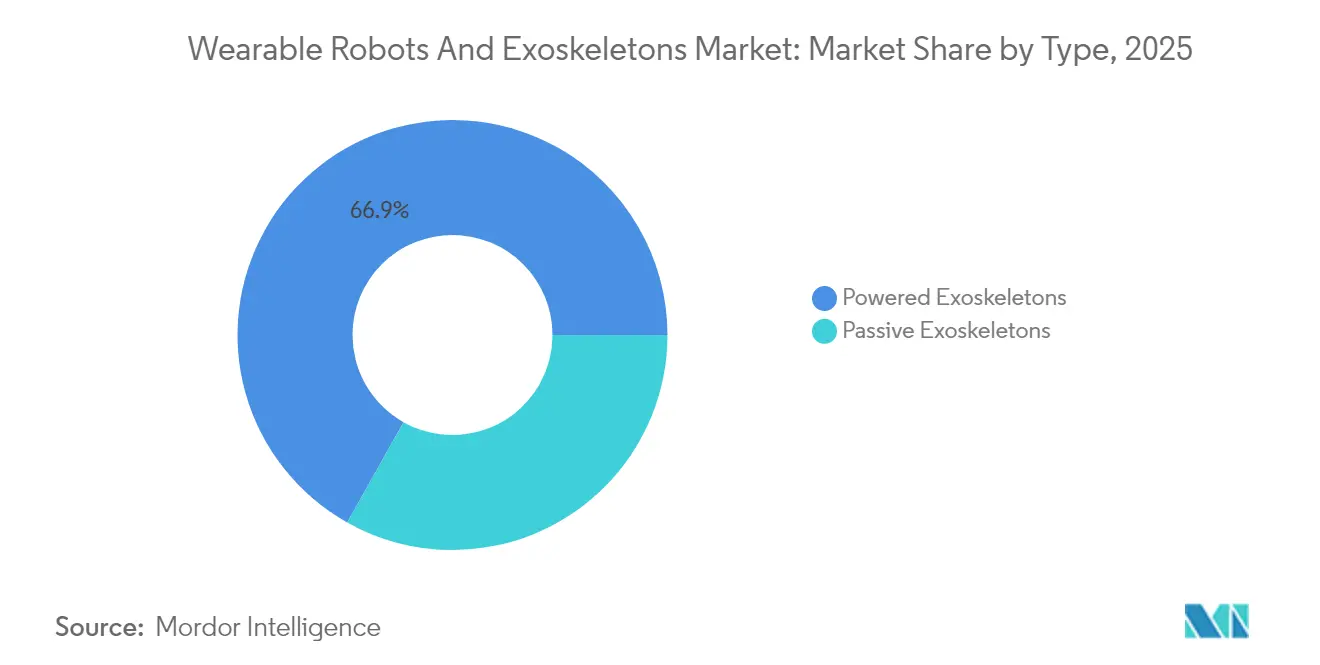
- By type, powered exoskeletons led with 66.85% of the wearable robots and exoskeletons market share in 2025; passive systems are forecast to post a 31.55% CAGR through 2031.
- By component, hardware commanded 73.05% share of the wearable robots and exoskeletons market size in 2025, while software is advancing at 32.05% CAGR through 2031
- By body part assisted, lower-extremity solutions accounted for 59.15% of the wearable robots and exoskeletons market size in 2025; upper-extremity devices are set to grow at 31.05% CAGR. through 2031
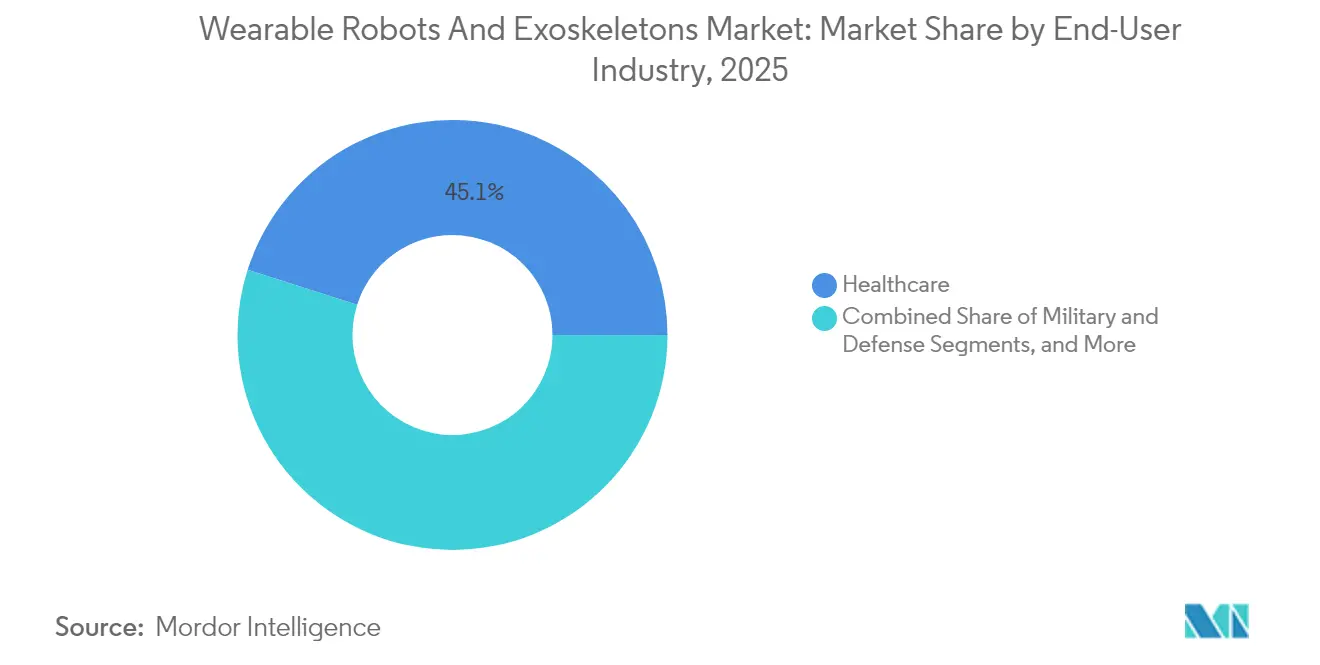
- By end-user industry, healthcare captured 45.10% revenue in 2025; military and defense applications are expanding at 33.2% CAGR through 2031
- By mobility type, mobile configurations made up 71.05% of 2025 deployments and are forecast to grow at 31.4% CAGR through 2031.
- By geography, North America led with 39.85% revenue in 2025, and Asia Pacific is the fastest climber at 32.1% CAGR through 2031
- Cyberdyne, ReWalk Robotics, Ekso Bionics, Sarcos Technology and Robotics, and Ottobock together controlled nearly 50% of 2024 global revenue, indicating a moderately concentrated field.
Note: Market size and forecast figures in this report are generated using Mordor Intelligence’s proprietary estimation framework, updated with the latest available data and insights as of 2026.
Global Wearable Robots And Exoskeletons Market Trends and Insights
Drivers Impact Analysis*
| Driver | (~) % Impact on CAGR Forecast | Geographic Relevance | Impact Timeline |
|---|---|---|---|
| Aging-population led surge in musculoskeletal disorders | +6.2% | Global, with concentration in North America, Europe, and Japan | Long term (≥ 4 years) |
| Rapid cost declines in lightweight actuators and battery packs | +7.8% | Global, with supply-chain benefits in Asia Pacific and North America | Medium term (2-4 years) |
| Mandatory workplace-injury reduction targets in heavy industry | +5.4% | North America and Europe, expanding to Asia Pacific manufacturing hubs | Medium term (2-4 years) |
| Record defense budgets earmarked for soldier-augmentation tech | +4.9% | North America, Europe, Middle East | Short term (≤ 2 years) |
| Insurance-reimbursement approvals for in-home neuro-rehab | +3.6% | North America and Europe, limited in emerging markets | Medium term (2-4 years) |
| Emerging lease-as-a-service models for exoskeleton fleets | +2.9% | Global, with early adoption in Europe and North America | Short term (≤ 2 years) |
| Source: Mordor Intelligence | |||
Aging-Population Surge in Musculoskeletal Disorders
Stroke prevalence climbs sharply after age 55, and older adults already represent 16% of the world population in 2025. The World Health Organization estimates 1.71 billion disability-adjusted life years from musculoskeletal conditions.[1]World Health Organization, “Musculoskeletal Health: Global Burden of Disease Estimates,” who.int Powered gait trainers provide adjustable torque that enables higher-intensity therapy than manual techniques. Japan’s reimbursement for assistive-robot rentals, effective April 2024, accelerated Hybrid Assistive Limb adoption in nursing homes, while the U.S. Centers for Medicare and Medicaid Services opened code E1399 for home-use prescriptions. Clinical trials showed a 23% bump in walking speed after 12-week HAL therapy cycles. These signals demonstrate why healthcare remains the anchor of the wearable robots and exoskeletons market.
Rapid Cost Declines in Actuators and Batteries
Brushless DC motor prices slid 18% between 2022 and 2024 as Chinese plants scaled rare-earth-free rotors, and lithium-ion packs for high-discharge wearables fell to USD 137 per kWh. German Bionic embedded a 1.2 kWh pack in the 4.8 kg Apogee ULTRA, securing 12-hour runtime and 300 rental subscriptions within one quarter. Parker Hannifin’s compact electro-hydraulic actuator now delivers 150 Nm at one-third the weight of pneumatic peers . These shifts lower the bill of materials, propelling the wearable robots and exoskeletons market toward cost-parity with passive braces.
Mandatory Workplace-Injury Reduction Targets
OSHA’s 2024 ergonomic guidance recommends powered exoskeletons for overhead work exceeding 23 kg. Musculoskeletal disorders drove 31% of the 2.8 million U.S. non-fatal injuries in 2024, costing employers USD 15,000 per case. DHL pledged to deploy 500 back-support units by end-2025 to cut lower-back claims 25% . Hyundai’s X-ble Shoulder, rolled out in Alabama and Czech plants, cut shoulder-strain reports 40% in its first quarter. Regulatory backing and quantified ROI illustrate why industrial demand forms a fast-growing wedge within the wearable robots and exoskeletons market.
Record Defense Budgets for Soldier Augmentation
The U.S. FY 2025 budget allocated USD 12.8 million to the Warrior Systems exoskeleton program, a 35% jump year on year. Lockheed Martin’s ONYX trimmed metabolic cost 30% during loaded marches in 10th Mountain Division trials. NATO states collectively raised augmentation R&D outlays 12% in 2024, and Sarcos secured a USD 6.2 million order for 15 Guardian XO suits. Battlefield endurance metrics and logistics use cases reinforce a sizable defense tailwind for the wearable robots and exoskeletons market.
Restraints Impact Analysis*
| Restraint | (~) % Impact on CAGR Forecast | Geographic Relevance | Impact Timeline |
|---|---|---|---|
| High upfront acquisition and lifecycle maintenance costs | -4.7% | Global, with acute impact in emerging markets | Medium term (2-4 years) |
| Lengthy multi-jurisdictional medical-device certification | -3.2% | Europe, North America, and Asia Pacific | Long term (≥ 4 years) |
| Limited torque-to-weight ratios for full-shift industrial use | -2.1% | Global, particularly in hot-climate regions | Medium term (2-4 years) |
| User-acceptance barriers due to device discomfort and heat | -1.8% | Global, with higher friction in tropical and subtropical zones | Short term (≤ 2 years) |
| Source: Mordor Intelligence | |||
High Upfront Acquisition and Lifecycle Maintenance Costs
Industrial units list at USD 40,000–80,000, while healthcare systems face USD 77,000 price tags for home-use devices. Annual maintenance adds up to 20% of initial spend, driven by battery and actuator replacements. German Bionic’s EUR 250 monthly rental still equates to USD 3,396 per year, straining thin-margin firms . Battery swaps every two years cost USD 2,500–4,000; actuator overhauls run USD 5,000–8,000. These economics temper adoption in price-sensitive regions, limiting the near-term upside of the wearable robots and exoskeletons industry.
Lengthy Multi-Jurisdictional Certification
EU Medical Device Regulation stretches approvals to 18–24 months as Notified-Body capacity dwindles to 34 entities. Wandercraft needed 22 months to earn CE marking for its hands-free system. China moved certain powered designs to Class III, layering clinical-trial obligations that add up to 18 months to launch cycles. FDA’s 510(k) can take 180 days but still demands predicate equivalence. Divergent rules compel parallel R&D tracks, lifting cost structures and cooling innovation velocity in the wearable robots and exoskeletons market.
*Our forecasts treat driver/restraint impacts as directional, not additive. The impact forecasts reflect baseline growth, mix effects, and variable interactions.
Segment Analysis
By Type: Powered Dominance Amid Passive Niche Persistence
Powered designs captured 66.85% of 2025 revenue and are forecast to expand at 31.2% CAGR through 2031, underscoring their pull across healthcare, defense, and heavy-lifting tasks. The wearable robots and exoskeletons market size attributed to powered units is projected to near USD 16.2 billion by 2031, driven by falling actuator prices and subscription models that smooth capital outlays. German Bionic’s rental plan reduces ownership costs 40%, while Lockheed Martin’s ONYX field data signal double-digit endurance gains that military buyers value.
Passive solutions held 33.15% share in 2025, steady demand for rugged, battery-free rigs in construction, agriculture, and maintenance. SuitX’s IX BACK VOLTON blends passive lumbar support with an optional powered mode, illustrating design convergence as buyers seek flexibility without compromising uptime. Passive exoskeletons remain attractive where charging infrastructure is scarce, yet incremental torque benefits mean powered systems will keep widening their reach across the global wearable robots and exoskeletons market.


By Component: Software Gains as Hardware Commoditizes
Hardware delivered 73.05% of 2025 revenue, but commoditization is eroding margins as sensor and motor prices fall. Sensors accounted for 15% of bill-of-materials cost, while actuators still dominate at 45% but are shedding weight and energy draw. Battery innovation looms; solid-state prototypes promise 50% density gains by 2027. Software revenue is pacing at 32.05% CAGR, and fleet dashboards now underpin recurring-revenue bundles.
Fourier Intelligence’s on-device AI tweaks torque in real time, reducing fatigue and differentiating bids in hospital tenders. As a result, software’s slice of the wearable robots and exoskeletons market share will widen as data analytics and remote diagnostics cement themselves in every contract.
By Body Part Assisted: Upper-Extremity Upswing
Lower-extremity systems still led with 59.15% share in 2025, reflecting maturity in stroke and spinal-cord rehabilitation. The wearable robots and exoskeletons market size for lower-limb devices topped USD 3.14 billion in 2025, supported by steady reimbursement wins. However, upper-extremity rigs are sprinting ahead at 31.05% CAGR on the back of automotive and aerospace adoption.
Hyundai’s X-ble Shoulder improved worker-comfort metrics 40% in early deployments, signaling a rising tide for shoulder and elbow devices. Full-body frames remain niche because USD 100,000-plus price tags limit demand to defense and shipyard maintenance, yet Sarcos’ heavy-lift contracts show pockets of growth.
By End-User Industry: Military Momentum
Healthcare remained the anchor at 45.10% revenue in 2025, though its share will ease as defense uptake accelerates. Military programs enjoy earmarked budgets and accelerated procurement; the U.S. Warrior Systems allocation alone jumped 35% year on year.
Industrial and logistics buyers account for roughly 35% of demand and favor subscription models that mesh with OpEx budgets. DHL’s 500-unit roll-out and Airbus’ 12-month pilot validate economic payback for injury reduction and throughput gains. Public safety and consumer niches still trail, yet Tokyo firefighters and ski-assist prototypes point to future adjacency expansion inside the wearable robots and exoskeletons market.
By Mobility Type: Untethered Premium
Mobile exoskeletons owned 71.05% of installations in 2025 and are tracking a 31.4% CAGR as battery density and fleet charging improve. German Bionic’s Apogee ULTRA delivers 12-hour runtime at sub-5 kg weight, giving operators freedom across entire shifts. Tethered rigs remain entrenched in rehabilitation suites where unlimited runtime outweighs mobility.
EksoNR’s cart-based power stage lightens the wearable section, easing fall-risk management during therapy. The dichotomy will persist, yet improved energy density ensures the revenue mix tilts toward mobile designs within the wearable robots and exoskeletons market.
Geography Analysis
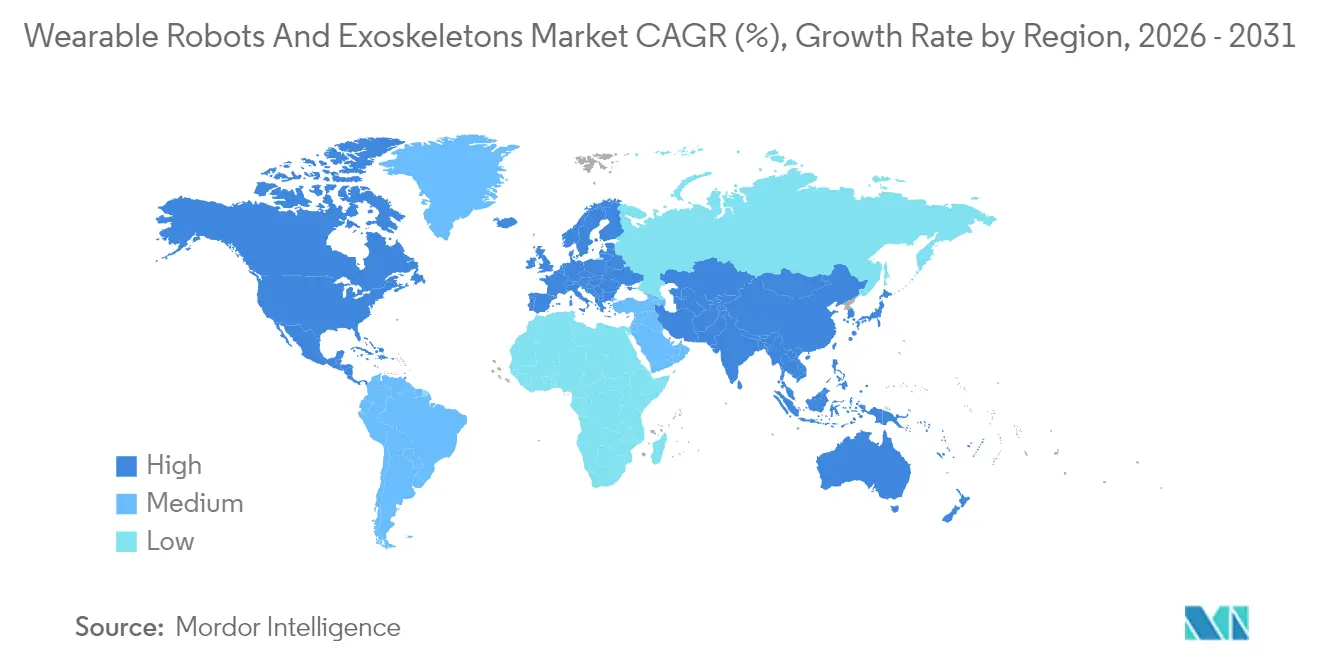
North America led with 39.85% revenue in 2025. FDA 510(k) streamlines medical clearances, while USD 12.8 million in FY 2025 Army RDT&E exoskeleton funding signals long-run commitment. VA policy changes removed supervision mandates, boosting veteran access. Canada’s WorkSafeBC offers 50% purchase subsidies, and Mexico’s automotive belt is piloting passive rigs despite training gaps. These factors keep North America atop the wearable robots and exoskeletons market rankings.
Asia Pacific is the fastest climber at 32.1% CAGR. Japan expanded long-term care insurance to cover assistive-robot rentals. Fourier Intelligence installed 120 exoskeletons in Chinese hospitals by late-2024. Hyundai plans 1,000 X-ble Shoulder units by 2026 as South Korea aligns factory automation with labor-safety mandates. India and Australia are early-stage yet promising due to new funding lines and pilot trials. The region’s demographic urgency and reimbursement reforms make it the pivotal growth engine for the wearable robots and exoskeletons market.
Europe held roughly 24.95% of 2025 revenue. MDR lengthens approval cycles to 24 months, benefiting incumbents such as Ottobock and Wandercraft. Germany’s accident-insurance funds reimburse 80% of device costs for high-risk trades. The U.K. National Health Service pilot shows a 30% reduction in therapy hours versus conventional rehab, aiding adoption. Regulatory bottlenecks moderate short-term expansion, yet strong worker-safety cultures sustain demand across the wearable robots and exoskeletons market.

Regulatory Landscape
Regulation for wearable robots and exoskeletons splits between medical-device pathways and general industrial safety regimes, which leads to different compliance burdens by use case. In the United States, powered lower-extremity exoskeletons used for rehabilitation are regulated by the FDA as Class II devices under 21 CFR 890.3480 (Product Code PHL), typically using the 510(k) route, and this pathway continues to shape time-to-market and predicate strategies. In October 2025, Wandercraft received FDA 510(k) clearance for its Atalante X powered exoskeleton, reinforcing that regulatory cadence remains a key gating factor.
In Europe, therapeutic and rehabilitation exoskeletons must comply with Regulation (EU) 2017/745 (MDR), which requires clinical evaluation and post-market surveillance. Non-medical occupational systems often map to broader machinery safety and risk assessment frameworks rather than device-specific harmonized rules. Testing baselines are also tightening, with ISO publishing ISO 18646-6:2026 in May 2026 for lower-limb wearable robots, creating a more explicit benchmark for procurement specifications, conformity documentation, and third-party validation across regions.
Value Chain Analysis
The value chain starts with component suppliers for actuators (electric and electro-hydraulic), sensors (IMUs, force/torque, encoders), power sources (lithium-ion packs and BMS), and lightweight structural materials. Exoskeleton OEMs then integrate control software, safety systems, and human-interface hardware.
Midstream work centers on validation and certification against safety and risk-management frameworks such as ISO 13482 and ISO 12100, while exoskeleton-specific guidance is still expanding. ASTM F3795-25 and country standards such as South Korea's KS B 7322-2025 formalize wearable robot design, performance, and safety specifications. Downstream, commercialization typically combines direct enterprise sales, healthcare channel partners, and fleet-style rentals bundled with training, maintenance, and analytics, but distribution remains a scaling constraint in industrial markets where developers often struggle to transition from pilots to standardized procurement. Integration services and systems engineering are gaining share as deployments connect to factory operations and broader automation stacks, including Technical University of Munich research (June 2026) on the WearaCob system that pairs an upper-body exoskeleton with a cobot to reduce lifting strain (reported up to 65%), pointing to demand for integrated solutions rather than standalone devices.
Competitive Landscape
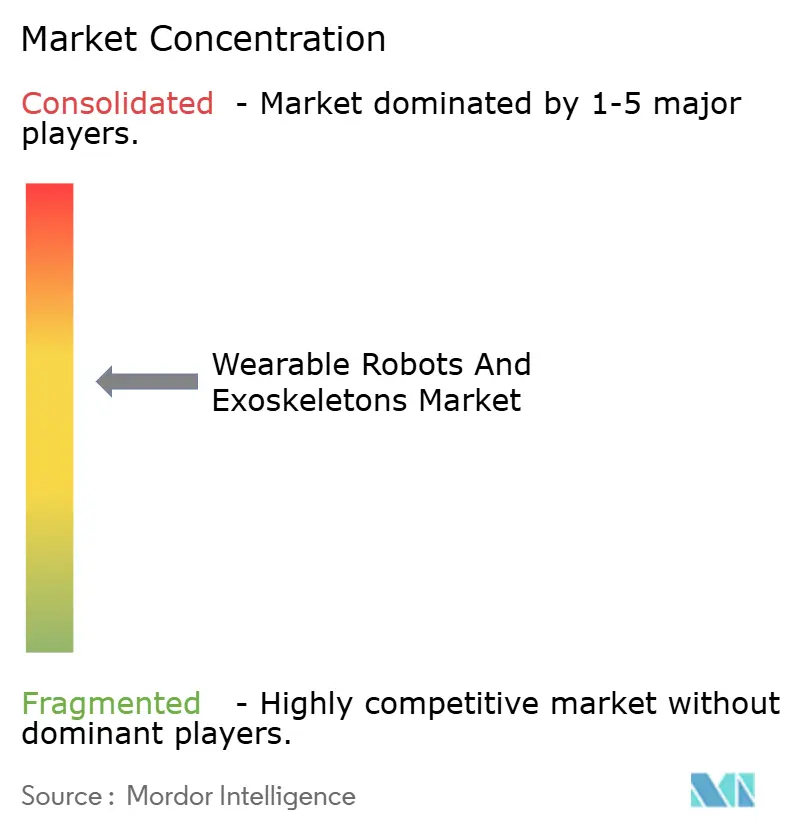
The top five suppliers controlled about 50% of 2024 sales, pointing to moderate concentration. Incumbents leverage regulatory head starts; Cyberdyne and Ekso Bionics both expanded clearances in 2024, widening their reimbursable indications. Hyundai’s vertical integration slashed unit price 30%, spotlighting auto-OEM entry threats. German Bionic’s EUR 250 rental compresses hardware margins yet accelerates fleet scale. Sarcos defends high-capex full-body niches via 47 force-feedback patents, while Wandercraft’s hands-free gait IP addresses daily-mobility segments. IEC 63376 safety certification, expected in late-2025, will raise compliance thresholds, favoring firms with quality-system depth. Regionally, soft-pneumatic forms dominate Japanese elder-care settings, whereas rigid electric frames rule U.S. military and European industrial bids. M&A appetite remains restrained, but joint ventures with battery and AI-software specialists are surfacing to close technology gaps throughout the wearable robots and exoskeletons market.
Wearable Robots And Exoskeletons Industry Leaders
Cyberdyne Inc.
ReWalk Robotics Inc.
Ekso Bionics Holdings Inc.
Honda Motor Co. Ltd
Sarcos Technology and Robotics Corporation
- *Disclaimer: Major Players sorted in no particular order

Market Opportunities and Future Outlook
The clearest whitespace is in industrial and logistics deployments where injury-reduction goals are being tied to safety KPIs, but procurement processes still lack standardized roll-out playbooks, channel coverage, and exosuit-specific safety guidance. Enterprise-scale deployments and trials offer concrete signals of adoption beyond pilots, including IKEA reporting it deployed SuitX exoskeletons across its logistics operations in July 2026, and IAG (British Airways parent) initiating baggage-handler trials with Verve Motion in July 2026. These cases highlight demand in high-strain manual handling roles and leave room for vendors that package device supply with training, change management, and workforce-acceptance programs.
Another opportunity is technology-led expansion in control, telemetry, and operational integration. The market is moving from rule-based controllers toward data-driven and hybrid control approaches, with greater use of IMU-based inputs to reduce reliance on biosignals that can complicate deployment. Integrated human-robot workflows are also becoming a commercial target, with the June 2026 WearaCob results showing strain reduction when exoskeleton assistance is coordinated with a cobot, which supports bundled offerings (wearable plus software plus integration services) into advanced manufacturing and Industry 5.0 initiatives. These directions also need to align to safety frameworks such as ISO 13482 and evolving test methods like ISO 18646-6:2026.
Recent Industry Developments
- June 2026: CYBERDYNE and Pegasus Tech Ventures launched a JPY 10 billion corporate venture capital fund focused on Cybernics and Physical AI. The fund structure formalizes a pipeline for startup collaboration and external R&D that can accelerate sensor, control, and human-assist capabilities relevant to wearable robots and exoskeletons. It also signals a shift toward ecosystem-led innovation rather than only in-house product iteration.
- October 2025: Wandercraft received FDA 510(k) clearance for the Atalante X powered exoskeleton. The clearance expands the set of FDA-cleared options in powered gait and rehabilitation, supporting hospital procurement and reimbursement-aligned deployment. It also raises competitive pressure on incumbents to maintain clinical evidence and regulatory cadence in the United States.
- April 2024: Japan expanded reimbursement for assistive-robot rentals under long-term care programs, supporting deployments in elder-care settings. Coverage for rental models lowers adoption friction for facilities that cannot absorb high upfront device costs, strengthening recurring-revenue pathways for vendors. The policy also reinforces Japan as a reference market for care-oriented wearable robotics in super-aged societies.


Research Methodology Framework and Report Scope
Market Definition and Coverage
This market covers revenues from wearable robots and exoskeleton systems worn on the body to support or enhance human movement, endurance, or strength, including units sold and related solutions tied to the device.
Scope exclusions: Prosthetics are excluded from this market sizing, even when they are discussed alongside mobility support technologies.
Segmentation Overview
- By Type
- Powered Exoskeletons
- Passive Exoskeletons
- By Component
- Hardware
- Sensors
- Actuators
- Power Sources
- Software
- Services
- Hardware
- By Body Part Assisted
- Lower Extremity
- Upper Extremity
- Full Body
- By End-user Industry
- Healthcare
- Industrial and Logistics
- Military and Defense
- Other End-user Industrys (Public Safety, Consumer)
- By Mobility Type
- Mobile / Wearable
- Stationary / Tethered
- By Geography
- North America
- United States
- Canada
- Mexico
- South America
- Brazil
- Argentina
- Rest of South America
- Europe
- Germany
- United Kingdom
- France
- Italy
- Spain
- Russia
- Rest of Europe
- Asia Pacific
- China
- Japan
- India
- South Korea
- Australia
- Rest of Asia Pacific
- Middle East and Africa
- Middle East
- Saudi Arabia
- United Arab Emirates
- Turkey
- Rest of Middle East
- Africa
- South Africa
- Nigeria
- Egypt
- Rest of Africa
- Middle East
- North America
Data Sources, Market Sizing, and Validation
Desk Research
Desk work starts with defining the market boundary and mapping demand context using public and official datasets. For regulatory signals in medical use cases, we typically review sources such as the US FDA device database. For workforce and occupational indicators, we use the US Bureau of Labor Statistics. For procurement direction, we review defense budget documents published by government agencies.
To keep the model grounded, we also review clinical publications indexed in PubMed, patent databases for filing intensity and technology focus, and trade statistics that show cross-border flows of relevant components. Company filings, investor presentations, and credible press coverage are then used to confirm product positioning and where revenues are actually booked, whether that is hardware versus software and service attachments. Where needed, paid subscriptions for company financials and intelligence, plus patent and shipment-level trade datasets, are used to improve consistency in assumptions. These desk sources are illustrative only, and additional public references are reviewed to collect, validate, and clarify data points.
Primary Interviews and Surveys
Primary work is used to stress-test the desk assumptions with people who see purchasing and deployment decisions firsthand, including manufacturers, component suppliers, distributors, integrators, clinicians, safety leads, and end-user procurement teams. Since this is a global market, we cross-check inputs across APAC, EMEA, and the Americas so regional adoption timing, reimbursement practices, and industrial safety programs are reflected in the final set of assumptions.
Distribution of primary research fieldwork respondents
| Company type | Respondent position | Region |
|---|---|---|
| Top tier: 29% | CXOs: 12% | APAC: 44% |
| Mid tier: 56% | Functional/Unit leaders: 30% | EMEA: 34% |
| Smaller Players: 15% | Managers: 58% | Americas: 22% |
Market-Sizing & Forecasting
Sizing is built using a combined top-down and bottom-up approach. The top-down view starts from end-use demand pools and adoption rates, then converts them into device volumes and revenue using typical pricing and mix assumptions. For wearable robots and exoskeletons, the demand pool is reconstructed from indicators such as rehabilitation patient throughput, targeted worker populations in high injury-risk tasks, defense procurement programs, and the share of sites that are actively piloting or scaling deployments.
To keep totals realistic, we run selective bottom-up checks using supplier roll-ups, channel discussions, and sampled average selling price multiplied by unit shipments by major end uses. Those results are used to adjust mix and pricing when gaps appear. Key model inputs include powered versus passive mix, average selling price movement by device class, service and maintenance attach rates, regulatory clearances and hospital adoption signals, and the pace of industrial program rollouts by region. Forecasts are developed using scenario analysis, where adoption and price paths are varied within ranges primary respondents said are workable, and the final outlook is selected after reconciling it with observed deployment timelines. Where unit or price data is missing for smaller geographies, we bridge using proxy penetration rates from similar markets, then re-check the results with regional experts.
Data Validation & Update Cycle
Validation is done by cross-checking the modeled revenue with independent signals, including shipment trends in related components, public procurement disclosures, and published clinical adoption activity, so the market does not drift away from real deployment behavior. Large variances trigger a second pass, where assumptions are re-opened, and follow-up conversations are scheduled with respondents closest to the disputed variable.
Before sign-off, outputs go through multi-step internal reviews focused on arithmetic checks, consistency across regions, and whether pricing and volume logic align with how buyers purchase these systems. The report is refreshed annually, and interim updates are made when a material event changes demand or supply assumptions, such as a regulatory shift or a meaningful change in reimbursement. Right before delivery, we complete a final review pass so clients receive the most current numbers and narrative.
Mordor Intelligence's Wearable Robots and Exoskeletons Market Size Versus Other Published Estimates
Published market values for wearable robots and exoskeletons can differ widely because the study boundary is not the same across sources, and timing choices also vary. Differences usually come from what is counted as a wearable robot, whether services are included with hardware, and which forecast start year is used.
The benchmark table shows a spread, and in Mordor Intelligence's model the market follows a strict wearable exoskeleton and wearable robot revenue scope that excludes prosthetics while counting related software and services when they are tied to the device sale or deployment. Some other estimates lean toward aggressive long-range growth curves, or they combine adjacent categories and apply broad price and adoption assumptions that are not consistently checked against rehabilitation and industrial deployment signals.
Benchmark comparison
| Source | Market Size | Gaps in Research Methodology |
|---|---|---|
| Mordor Intelligence | USD 6.83 B (2026) | |
| Industry Publisher A | USD 3.52 B (2026) | Often scoped narrowly to exoskeleton devices only, with limited capture of software and service revenues attached to deployments, which can pull the 2026 total down versus broader wearable-robot coverage. |
| Industry Publisher B | USD 5.33 B (2025) | Uses a different base year and may include adjacent sub-types like soft exosuits and broader application buckets, and the year shift plus scope blending can change totals even when the theme is similar. |
Taken together, the differences mostly come from what is included in the product boundary, whether attached services are counted, and how the start year is set for the model. Our approach keeps the estimate traceable to adoption drivers, pricing logic, and practical cross-checks, which makes the final number easier to reconcile with real deployment activity and update over time.


Key Questions Answered in the Report
How big is the Wearable Robots and Exoskeletons Market?
The Wearable Robots and Exoskeletons Market size is expected to reach USD 6.83 billion in 2026 and grow at a CAGR of 28.88% to reach USD 24.28 billion by 2031.
What is the current value of the wearable robots and exoskeletons market?
It stands at USD 6.83 billion in 2026 and is forecast to hit USD 24.28 billion by 2031, implying a 28.88% CAGR.
Which segment leads in market share, powered or passive exoskeletons?
Powered models dominate with 66.85% share in 2025, driven by healthcare and heavy-lift use cases.
How quickly are upper-extremity exoskeletons growing?
They are advancing at a 31.05% CAGR through 2031, reflecting automotive and aerospace adoption.
Which region is expanding the fastest?
Asia Pacific shows the highest growth pace at 32.1% CAGR owing to Japanese, Chinese, and South Korean initiatives.
Why are lease-as-a-service models important?
Subscription rentals lower upfront costs, enabling small firms to adopt exoskeletons without major capital outlays while giving manufacturers recurring revenue.
Page last updated on:






