
Market Overview
| Study Period | 2021 - 2031 |
|---|---|
| Market Size (2026) | USD 9.08 Billion |
| Market Size (2031) | USD 12.23 Billion |
| Growth Rate (2026 - 2031) | 6.12 % |
| Fastest Growing Market | Asia Pacific |
| Largest Market | Asia Pacific |
| Market Concentration | Medium |
Major Players *Disclaimer: Major Players sorted in no particular order Image © Mordor Intelligence. Reuse requires attribution under CC BY 4.0. | |
Water-borne Adhesives Market Analysis by Mordor Intelligence
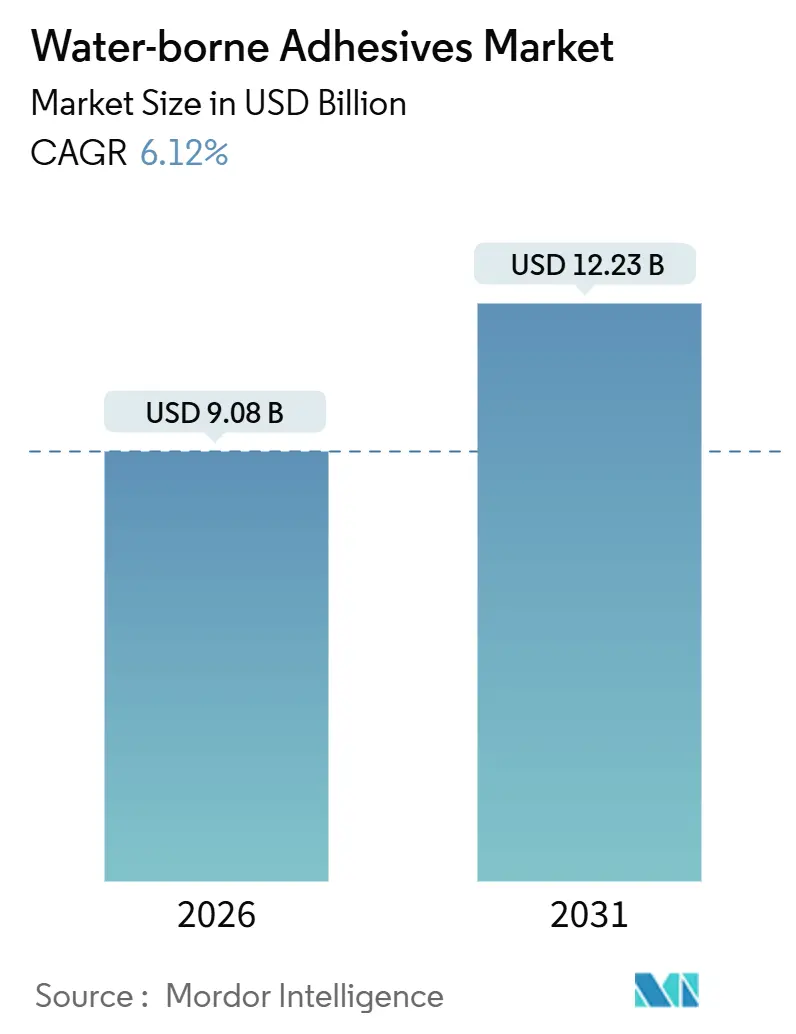
The Water-borne Adhesives Market size is estimated at USD 9.08 billion in 2026 and is expected to reach USD 12.23 billion by 2031, at a CAGR of 6.12% during the forecast period (2026-2031). Heightened scrutiny of volatile organic compound (VOC) emissions, especially in China, the European Union, and the United States, is accelerating the replacement of solvent-borne chemistries with water-based alternatives. Fast-moving fulfillment centers that seal more than 300 corrugated cases per minute favor polyvinyl acetate (PVA) emulsions that cure within three seconds, while modular building contractors in Indonesia and Thailand increasingly specify low-VOC adhesives to meet green-building rating thresholds. Polyurethane (PU) dispersions are also gaining traction in lightweight vehicles where automakers now replace steel rivets with 300 bonding points per car, cutting curb weight by 2.2 pounds and improving fuel economy by 3%. Flexible packaging converters are adopting next-generation acrylic emulsions that pass United States Food and Drug Administration (FDA) 21 CFR 175.105 migration limits, enabling solvent-free laminates for retort pouches.
Key Report Takeaways
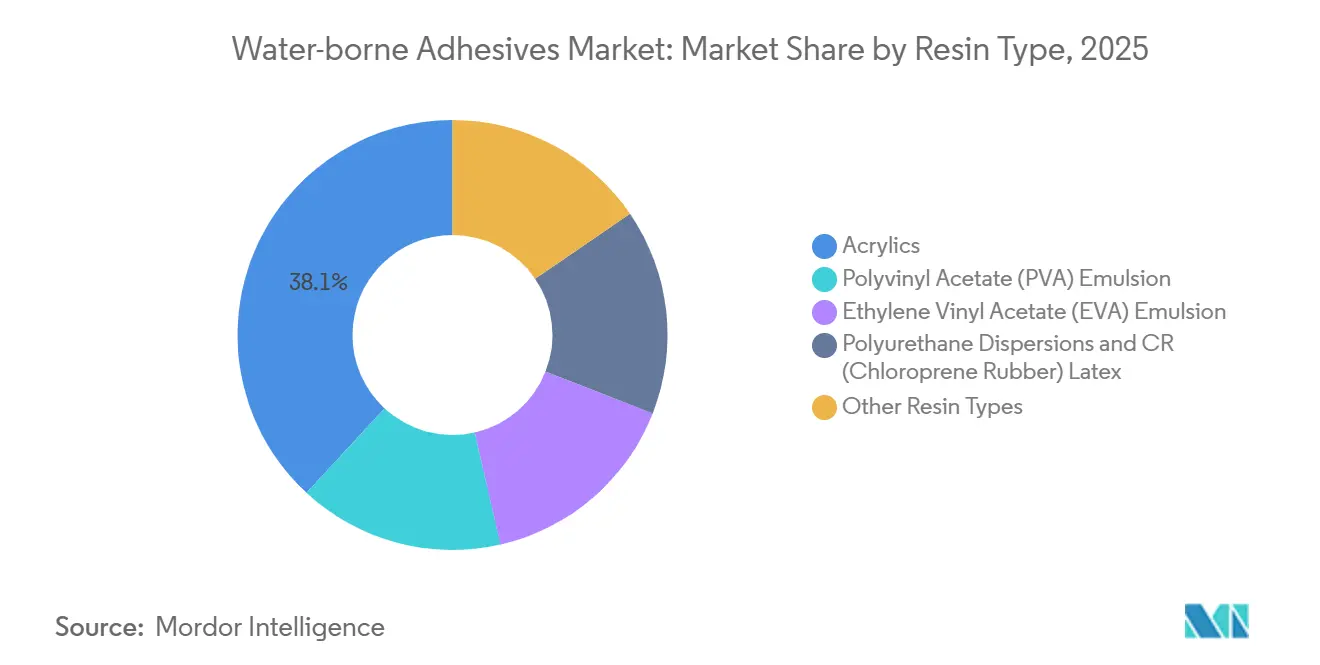
- By resin type, acrylics led with 38.12% of the water-borne adhesives market share in 2025, while polyurethane dispersions are projected to register the highest CAGR at 6.71% through 2031.
- By application, flexible packaging commanded 40.44% of the water-borne adhesives market size in 2025; laminating and filmic structures are forecast to expand at a 7.52% CAGR to 2031.
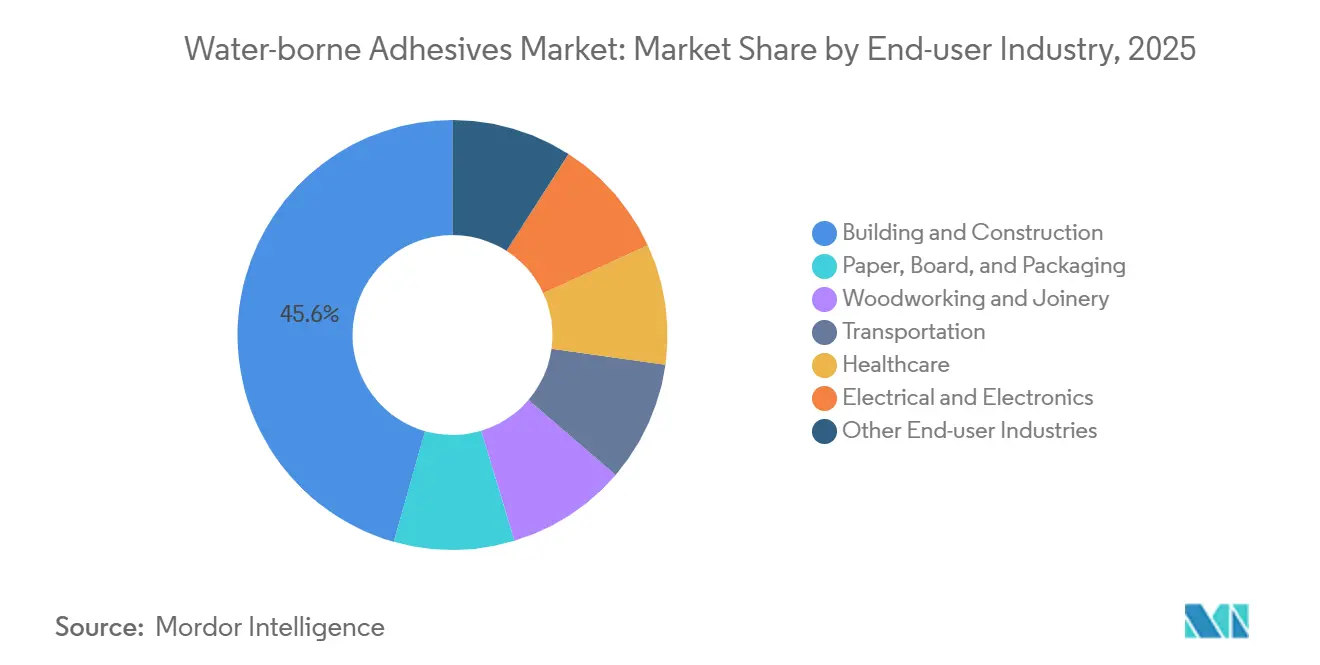
- By end-user industry, building and construction accounted for 45.59% revenue in 2025, whereas healthcare is advancing at a 6.37% CAGR through 2031.
- By substrate, paper and paperboard captured 51.28% volume in 2025, yet plastics and films are forecast to grow at a 6.51% CAGR through 2031 as mono-material pouches gain favor.
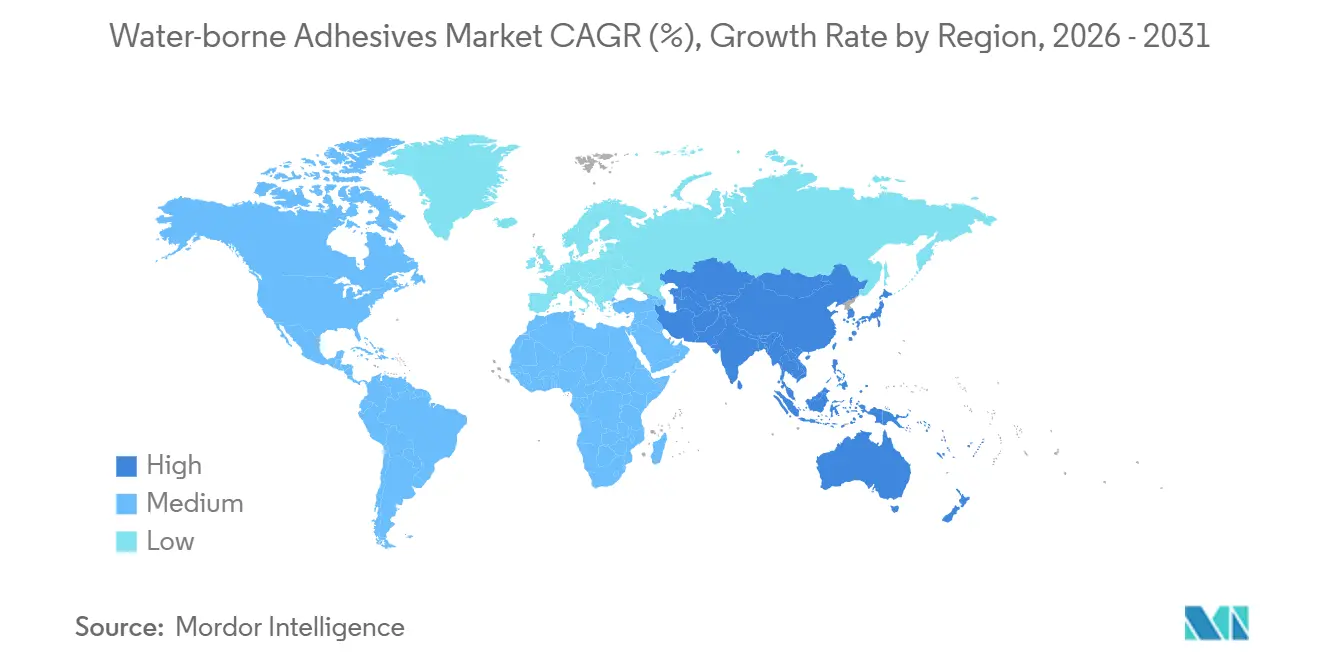
- By geography, Asia-Pacific held 40.45% market share in 2025 and is set to grow at a 6.92% CAGR to 2031 on the back of stringent regional VOC caps.
Note: Market size and forecast figures in this report are generated using Mordor Intelligence’s proprietary estimation framework, updated with the latest available data and insights as of January 2026.
Market Trends and Insights
Drivers Impact Analysis of Water-borne Adhesives Market*
| Drivers | (~) % Impact on CAGR Forecast | Geographic Relevance | Impact Timeline |
|---|---|---|---|
| E-commerce-led boom in corrugated packaging | +1.4% | North America, China, India | Short term (≤ 2 years) |
| VOC-reduction mandates | +1.8% | North America, EU, China | Medium term (2-4 years) |
| ASEAN modular construction | +1.1% | Indonesia, Thailand, Vietnam, spill-over to India | Medium term (2-4 years) |
| Lightweight automotive bonding | +0.9% | Germany, United States, Japan, South Korea | Long term (≥ 4 years) |
| Bio-based food-contact breakthroughs | +0.7% | North America, EU, early adoption in Japan | Long term (≥ 4 years) |
| Source: Mordor Intelligence | |||
E-commerce-Led Boom in Corrugated Packaging
Global online sales reached USD 6 trillion in 2025, prompting logistics operators to redesign secondary packaging for faster throughput and lower damage rates. Corrugated converters now use water-based starch and PVA adhesives that develop set speed within three seconds, enabling production lines to exceed 300 meters per minute without the fire hazards seen in hot-melt systems[1]. Rising demand for right-sized boxes has increased the packaging-to-product weight ratio, which elevates adhesive consumption per shipment. Major e-retailers such as Amazon eliminated plastic air pillows in 2024, accelerating the switch to paper-based cushioning bonded with water-borne chemistries. Similar commitments by Walmart and Alibaba have reinforced this trajectory, making corrugated packaging the single-largest growth node in the water-borne adhesives market.
VOC-Reduction Mandates Driving Solvent-to-Water Switch
China’s GB 33372-2020 caps VOCs in water-borne products at 50 g/kg, while the European Union’s Directive 2004/42/EC restricts decorative coatings to 30 g/L and contact adhesives to 50 g/L. In the United States, the Environmental Protection Agency’s National Emission Standards for Hazardous Air Pollutants require a 95% VOC capture rate or low-emitting formulations. California’s Air Resources Board (CARB) Phase 2 regulation sets an even tighter 25 g/L ceiling for architectural coatings. Collectively, these rules have forced converters to reformulate, thereby boosting demand across the water-borne adhesives market.
ASEAN Modular Construction Spurring Fast-Setting PVA Demand
Indonesia earmarked USD 412 billion for infrastructure from 2024-2029, with one-third allocated to prefabricated housing that prefers fast-curing water-based adhesives. Thailand’s Eastern Economic Corridor funnels THB 3 trillion (USD 85 billion) into industrial townships where off-site fabrication trims labor by 40%. Vietnam’s QCVN 01:2021 VOC standard of 75 g/L also nudges builders toward aqueous systems. PVA emulsions formulated with latent cross-linkers achieve handling strength in 15 minutes, enabling stacked panel transport without delamination, a decisive edge over solvent-borne adhesives.
Lightweight Automotive Bonding Boosting PU Dispersions
Global light-vehicle output hit 88 million units in 2025, with electric vehicles making up 18%. Automakers seek to extend driving range by shedding mass, replacing 55 pounds of metal fasteners with 2.2 pounds of PU dispersion adhesive per vehicle. These water-borne dispersions bond aluminum, composites, and high-strength steel without galvanic corrosion. ISO 11343-certified products now deliver 25 MPa lap-shear strength on oiled steel, while thermally conductive grades filled with boron nitride dissipate heat in 800-V battery packs.
Restraints Impact Analysis of Water-borne Adhesives Market*
| Restraints | (~) % Impact on CAGR Forecast | Geographic Relevance | Impact Timeline |
|---|---|---|---|
| Heat-resistance gap in high-temperature uses | -0.6% | Global, notably automotive under-hood and electronics | Medium term (2-4 years) |
| Limited reach in high-end structural bonding | -0.4% | North America, EU, Japan | Long term (≥ 4 years) |
| Higher capex for water-borne lines | -0.3% | India, Southeast Asia, South America | Short term (≤ 2 years) |
| Source: Mordor Intelligence | |||
Heat-Resistance Gap Limits Entry into High-Temperature Uses
Most aqueous formulations degrade above 120 °C, preventing deployment in engine compartments where ambient temperatures exceed 150 °C and in electronics reflow soldering peaks of 260 °C. Epoxy and polyimide systems retain integrity at 200 °C for thousands of hours, a performance envelope water-based products cannot match without sacrificing film formation. The rise of silicon-carbide inverters demanding 175 °C adhesives further sidelines water-borne chemistries, while aerospace specs such as ASTM D5868 require 80% strength retention at 180 °C, effectively excluding them[2].
Limited Penetration in High-End Structural Bonding
Wind-turbine blades need 30 MPa tensile strength and 15 kJ/m² fracture toughness per DNV GL guidelines, metrics attainable only by epoxy variations under current technology. ISO 11343 crash-test retention targets of 70% bond strength after 1,000 hours at 85 °C/85% RH are challenging for aqueous dispersions that cure via water evaporation. Marine standards from Lloyd’s Register require 10,000-hour salt-spray endurance that water-based systems can meet only with pricey inhibitors. Consequently, silicone and moisture-curing polyurethane keep their footing in curtain-wall glazing and façade panels.
*Our forecasts treat driver/restraint impacts as directional, not additive. The impact forecasts reflect baseline growth, mix effects, and variable interactions.
Water-borne Adhesives Market Segment Analysis
By Resin Type:
PU Dispersions Gain on AcrylicsAcrylics held 38.12% of revenue in 2025, buoyed by pressure-sensitive labels and paper converting, where 10-15 N/25 mm peel adhesion suffices. The water-borne adhesives market size for PU dispersions is projected to increase at a 6.71% CAGR to 2031 as automakers and footwear brands demand abrasion resistance and flexibility unrivaled by acrylics. Covestro’s Dispercoll U series posts 800% elongation and 25 MPa tensile strength without free isocyanate, positioning it for single-component systems that simplify plant logistics. PVA emulsions still dominate woodworking, forming transparent glue lines and penetrating porous substrates, while EVA emulsions remain preferred for carpet backing and hygiene disposables despite a 20% cost premium.
Innovation is narrowing the performance gap: self-crosslinking acrylics now reach 3 MPa lap-shear strength on aluminum, previously an epoxy stronghold. Bio-based resins remain below 5% but are rising as Henkel and Wacker launch lignin and starch derivatives. Chloroprene latex continues to lose share after the EU REACH restricted nitrosamine precursors. Collectively, the shift toward high-function PU dispersion broadens the value pool inside the water-borne adhesives market.

By Application:
Laminating Outpaces Flexible PackagingFlexible packaging represented 40.44% market share in 2025 as brands migrated from rigid formats to stand-up pouches that cut material use by 30%-50%. The water-borne adhesives market size for laminating and filmic structures is forecast to grow at 7.52% through 2031, fueled by multilayer barrier films combining polyethylene and metallized polyester. FDA-compliant solvent-free systems now leave <5 mg/m² residuals, opening retort pouch opportunities.
Tapes and labels benefit from e-commerce tamper-evidence needs, while flooring adhesives certified under LEED emit <50 µg/m³ total VOCs. Bookbinding faces digital substitution yet retains premium hardcovers that rely on neutral-pH PVAs. Non-woven hygiene lines seek formaldehyde-free formulations, enabling water-borne dispersions to capture elastic attachment and wetness-indicator niches.
By End-User Industry:
Healthcare AcceleratesBuilding and construction generated 45.59% revenue in 2025, underpinned by LEED and Living Building Challenge criteria setting <50 g/L VOC limits. Healthcare is poised for a 6.37% CAGR to 2031 as ISO 10993-compliant acrylics dominate wound dressings that maintain adhesion for seven days without skin maceration. The water-borne adhesives market share for packaging remains high due to carton sealing and label application.
Woodworking applications must meet CARB Phase 2 formaldehyde caps, spurring uptake of PVAs. Transportation interior trims increasingly adopt PU dispersions for acoustic damping below 100 °C. Electronics remain a smaller niche given heat limits, although silver-filled conductive emulsions are edging into flexible printed circuits processed at ≤150 °C.
By Substrate:
Plastics Narrow the Gap with PaperPaper and paperboard substrates provided 51.28% bonding volume in 2025, dominated by corrugated, folding carton, and tissue lamination lines that value low-cost starch and PVA blends. Plastics and films are growing 6.51% thanks to recyclable mono-material pouches; new aqueous laminating systems deliver 3 N/15 mm peel on corona-treated polyethylene without solvent primers.
Wood composites employ phenol-resorcinol and melamine-urea-formaldehyde adhesives, achieving 1.5 MPa dry-bond and 0.8 MPa wet-bond strength. Metal applications remain relegated to pre-painted coil, where epoxy-acrylic hybrids provide chromate-free corrosion resistance, while glass bonding for windshield replacements still relies on moisture-curing PU. Textile and non-woven sectors demand wash-durable dispersions that survive 60 °C cycles and 120 °C drying, a capability met by heat-activated cross-linkers in PU dispersions.
Geography Analysis
APAC Water-borne Adhesives Market
Asia-Pacific controlled 40.45% of revenue in 2025 and is expected to compound at a 6.92% CAGR through 2031 on the back of China’s GB 18582-2020 and GB 30981-2020, which cap VOCs in adhesives at 50 g/kg. Indonesia’s USD 412 billion infrastructure plan favors modular housing that relies on fast-setting PVAs, while Thailand’s THB 3 trillion Eastern Economic Corridor drives low-VOC demand. India’s Goods and Services Tax reforms lowered interstate costs by 15%, enabling bulk production hubs in Gujarat and Tamil Nadu. Japan’s 2025 workplace exposure limits of 10 ppm toluene push formulators toward aqueous platforms.
North America Water-borne Adhesives Market
North America’s construction and automotive markets have plateaued, yet e-commerce and healthcare sustain 3%-4% growth. The United States NESHAP rule rewards converters that switch to water-borne products by obviating thermal oxidizers. Canada’s 2024 formaldehyde cap of 0.05 ppm accelerates PVA uptake in cabinetry. Mexico’s tier-1 suppliers now specify aqueous structural adhesives to satisfy OEM sustainability scorecards.
Europe Water-borne Adhesives Market
Europe continues to lead on regulation: Germany’s TA Luft limits VOC stack emissions to 20 mg/m³, while France’s RE2020 enforces lifecycle carbon audits that favor bio-based adhesives. Post-Brexit UK REACH retained EU restrictions on carcinogens, maintaining momentum toward solvent-free formulations. Nordic circular programs advocate design-for-disassembly, positioning water-borne adhesives for recyclable furniture.
South America and MEA Water-borne Adhesives Market
South America is regaining momentum after a short recession. Brazil’s CONAMA 452 harmonizes with 50 g/L VOC caps, spurring adoption in architectural coatings, whereas Argentina’s panel mills comply with MERCOSUR’s 0.1 ppm formaldehyde limit, boosting urea-formaldehyde emulsions. The Middle East and Africa remain nascent; Saudi megaprojects and South African renewables create localized demand for low-VOC bonding in solar laminates and turbine blades.
Regulatory Landscape
VOC and hazardous-substance controls remain the main regulatory driver pushing substitution of solvent-borne chemistries with water-borne systems. In the European Union, Directive 2004/42/EC sets VOC limits for adhesive categories, including contact adhesives, while REACH obligations increase reformulation and documentation work as substance status changes and downstream users request updated safety data sheets. In the United States, Environmental Protection Agency (EPA) air rules and state programs such as California Air Resources Board (CARB) requirements reinforce low-VOC adoption in construction and consumer-facing applications.
Value Chain Analysis
The water-borne adhesives value chain starts with upstream feedstocks, including acrylic monomers, vinyl acetate, EVA, polyols and isocyanate derivatives for PU dispersions, as well as tackifiers, surfactants, fillers, and preservatives. This is followed by polymerization and dispersion manufacture, then downstream compounding into application-specific formulations. Manufacturers typically sell through direct key-account channels to large packaging converters, building and construction distributors, woodworking OEMs, and transportation tier suppliers, while smaller volumes move via regional chemical distributors that provide technical service and inventory buffering.
Operational performance and compliance documentation influence competitiveness at each step. Water-based systems are sensitive to solids content and particle-size distribution, so variability in monomers and process auxiliaries can translate into runnability issues at converters, including set speed, drying time, and humidity tolerance. Downstream customers are also increasingly requesting life cycle assessment inputs and Scope 3-relevant data, which elevates analytical capability and traceability as differentiators. This is reinforced by air-quality compliance frameworks such as South Coast AQMD Rule 1168, which includes manufacturer reporting requirements, along with state-level VOC content limits (for example, Virginia VOC standards) that favor suppliers with stronger regulatory and product stewardship infrastructure.
Competitive Landscape
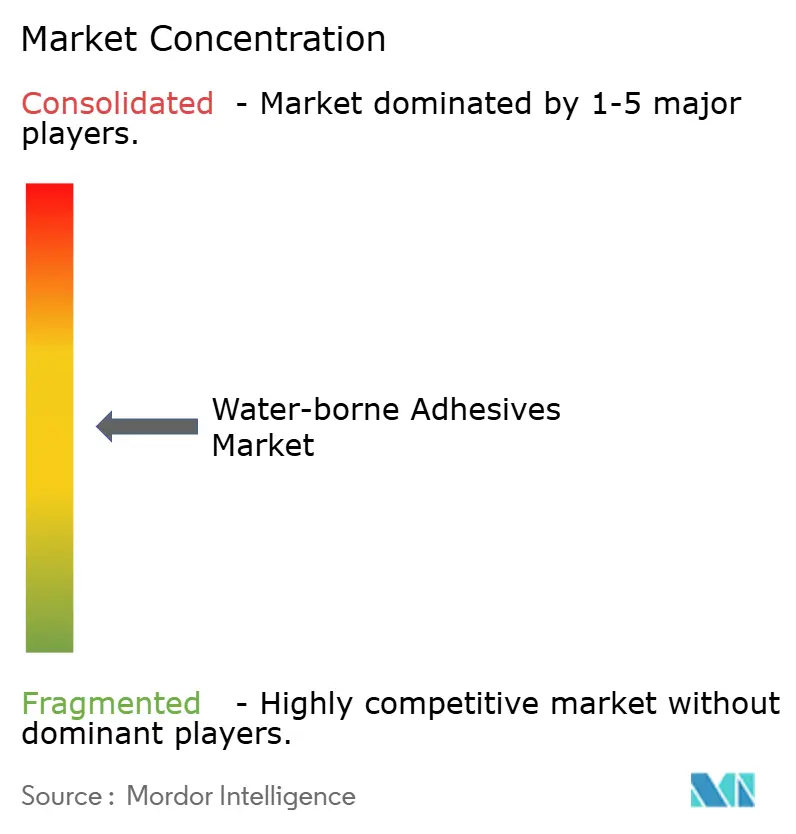
The water-borne adhesives market is moderately consolidated. Henkel opened a EUR 50 million technology center in Düsseldorf in 2025 to scale latent-reactive PU dispersions that cure at 80 °C for automotive trim and electronics potting. H.B. Fuller’s USD 1.85 billion acquisition of ND Industries added high-margin engineered adhesives for industrial assemblies. Arkema’s 2024 purchase of Prochimir expanded its South American footprint with eight sites and EUR 120 million annual sales. Sika commissioned a USD 45 million plant in Egypt in 2025 to capture rising North African construction demand. White-space innovation revolves around heat-resistant aqueous systems, bio-based food-contact grades, and conductive dispersions for flexible electronics. Patent filings climbed double digits in 2024-2025, highlighting self-crosslinking acrylics and graphene-filled formulations. Third-party certifications such as GreenGuard Gold now serve as de facto entry tickets to premium construction and consumer packaged goods accounts, with 12 manufacturers publishing Environmental Product Declarations in 2025.
Water-borne Adhesives Industry Leaders
-
Henkel AG & Co. KGaA
-
H.B. Fuller Company
-
Arkema
-
3M
-
Dow
- *Disclaimer: Major Players sorted in no particular order
Water-borne Adhesives Market Companies Covered in this Report
- 3M
- Arkema
- Ashland
- Avery Dennison Corporation
- Benson Polymers Pvt Ltd.
- DIC CORPORATION
- Dow
- Dymax
- Evonik Industries AG
- H.B. Fuller Company
- HBK
- Henkel AG & Co. KGaA
- Jowat SE
- MAPEI S.p.A.
- Parker Hannifin Corp
- Pidilite Industries Ltd.
- PPG Industries, Inc.
- Sika AG
- Soudal Group
- Wacker Chemie AG
Market Opportunities and Future Outlook
Packaging circularity programs and tighter substance requirements are creating whitespace for water-borne formulations that pair low emissions with recyclability-enabling behavior, such as wash-off label adhesives and repulpable paper packaging adhesives. EU PPWR (EU) 2025/40 enforcement starting August 12, 2026 increases the weight of adhesive choices that do not disrupt recycling streams, and it also raises the value of composition and compliance documentation. This favors suppliers that can support brand owners and converters with validated data packages.
Capacity additions and service expansions in packaging-adjacent adhesives and materials handling are also widening growth routes in higher-throughput applications. UPM Adhesive Materials announced a new slitting and distribution terminal near New Delhi, scheduled to open in Q3 2026, to improve service reach for label and packaging supply chains in Northern and Eastern India. In India, SPEB Adhesives announced a capacity expansion tied to a new 16,000 square meter facility in Khalapur (Raigad district, Maharashtra), targeting 8,550 tonnes per annum of installed capacity in 2026, which indicates ongoing investment in regional supply for water-based and low-VOC product lines aligned with packaging and construction demand centers.
Recent Industry Developments in Water-borne Adhesives Market
- June 2026: In a move to expand its presence in medical adhesives, H.B. Fuller announced a USD 943 million bid to acquire U.K.-based Advanced Medical Solutions (AMS), broadening its R&D capabilities and product portfolio. The action strengthens access to healthcare end uses where water-borne acrylics and dispersions compete on skin compatibility and regulatory compliance. The acquisition also signals a deeper emphasis on specialty adhesives with robust documentation requirements and validation programs.
- October 2025: Henkel and Dow expanded a strategic partnership focused on emission reduction across Henkel’s adhesive portfolio. The collaboration ties decarbonization and formulation modernization more closely to upstream material choices and manufacturing practices, reinforcing the shift toward lower-emission technologies such as water-based systems in targeted applications. It also raises the bar for supplier data transparency and joint development with key raw-material partners.
- September 2024: Arkema (Bostik) launched Kizen LIME, a new range of packaging adhesives positioned around decarbonization objectives. The introduction adds competitive pressure in packaging, where brand owners and converters are tightening VOC and sustainability requirements and evaluating adhesive choices as part of packaging redesign programs. It also highlights continued product differentiation around lower-impact chemistries in high-volume end uses such as flexible packaging and paper converting.
Water-borne Adhesives Market Report Scope and Research Methodology
Market Definition and Coverage
For this study, the market is defined as the revenue generated from water-borne adhesive formulations where water is the main carrier, sold for bonding across industrial and consumer-facing applications.
Scope exclusions: We exclude solvent-borne adhesives, hot-melt systems, UV-cured products, reactive two-part chemistries, and finished pressure-sensitive tape rolls.
Segments Covered in This Report
- By Resin Type
- Acrylics
- Polyvinyl Acetate (PVA) Emulsion
- Ethylene Vinyl Acetate (EVA) Emulsion
- Polyurethane Dispersions and CR (Chloroprene Rubber) Latex
- Other Resin Types
- By Application
- Flexible Packaging
- Tapes and Labels
- Paper Converting and Graphic Arts
- Laminating and Filmic Structures
- Flooring and Carpeting
- Bookbinding and Publishing
- Non-woven and Hygiene Products
- Others
- By End-user Industry
- Building and Construction
- Paper, Board, and Packaging
- Woodworking and Joinery
- Transportation
- Healthcare
- Electrical and Electronics
- Other End-user Industries
- By Substrate
- Paper and Paperboard
- Plastics and Films
- Wood and Composites
- Metals
- Glass and Ceramics
- Others
- By Geography
- Asia-Pacific
- China
- India
- Japan
- South Korea
- ASEAN
- Rest of Asia-Pacific
- North America
- United States
- Canada
- Mexico
- Europe
- Germany
- France
- United Kingdom
- Italy
- Spain
- NORDIC Countries
- Rest of Europe
- South America
- Brazil
- Argentina
- Rest of South America
- Middle East and Africa
- Saudi Arabia
- South Africa
- Rest of Middle East and Africa
- Asia-Pacific
Data Sources, Market Sizing, and Validation
Desk Research
Desk research was used to set the operating context for demand and pricing, and to make sure the model starts from repeatable external signals. We relied on public and official references such as national statistics offices, customs and trade data portals, environmental agencies that publish VOC and chemical guidance, and manufacturing production indices relevant to packaging, construction, and furniture.
Along with that, we reviewed company filings, investor presentations, technical data sheets shared publicly, and association websites that discuss adhesive and polymer emulsion trends. When needed, paid subscriptions for company financials, news and financials, patent databases, and shipment-level trade data were used to cross-check coverage, track capacity or expansion announcements, and sense-check directional pricing shifts. These are illustrative sources only, and many other references were also used for data collection, validation, and clarification during the work.
Primary Interviews and Surveys
Primary work focused on validating how water-borne adhesives are consumed and priced by key end users, including packaging converters, building materials players, and woodworking users, and then by distributors and formulators who typically notice mix changes early. We also used interviews to confirm what gets counted as water-borne in commercial practice, and to pressure-test adoption drivers such as low-VOC rules and substitution away from solvent systems across APAC, EMEA, and the Americas.
Distribution of primary research fieldwork respondents
| Company type | Respondent position | Region |
|---|---|---|
| Top tier: 31% | CXOs: 12% | APAC: 44% |
| Mid tier: 48% | Functional/Unit leaders: 35% | EMEA: 30% |
| Smaller Players: 21% | Managers: 53% | Americas: 26% |
Market-Sizing & Forecasting
Sizing starts with a top-down build where production and trade signals for adhesives and relevant downstream industries are translated into an addressable demand pool, then filtered through water-borne penetration by application. Once that structure is in place, selective bottom-up checks are used, such as sampling average selling price by resin family and mapping it to estimated consumption volumes in packaging, construction, and woodworking, followed by channel checks on mix shifts.
Key inputs used in the model include packaging output and flexible packaging demand indicators, construction activity and renovation cycles, furniture and woodworking production trends, water-borne substitution rates versus solvent-borne systems, and observed pricing movement for common water-borne chemistries (for example, acrylic and PVA emulsion based systems). Where direct volume signals are thin, gaps are handled through proxy indicators such as end-use output indices and interview-led share ranges, and then reconciled at the regional level.
For forecasting, scenario analysis is used around a base case, where demand variables are projected and adjusted using expert views on regulation-driven low-VOC adoption and expected pricing progression. When main drivers move in different directions, the model is re-run so the final trajectory remains explainable and consistent with real operating conditions.
Data Validation & Update Cycle
Outputs are validated through multiple checks, including comparing implied consumption intensity against downstream activity levels and reviewing whether price and volume movements align in a practical way. Outliers are flagged, worked back to the underlying assumption, and then either corrected or documented, and experts are re-contacted when a variance cannot be explained with the available evidence.
Before sign-off, the work goes through step-by-step analyst review so definitions, conversions, and regional totals line up. Reports are refreshed annually, with interim updates when material events occur, and a final pre-delivery pass is completed so clients receive the latest view available at the time.
Mordor Intelligence's Water Borne Adhesives Market Size Measured Against Other Published Estimates
Published numbers for water-borne adhesives often differ because each publisher draws the product line a little differently, and then applies different pricing and adoption assumptions to convert that scope into revenue. Timing also matters because base years, currency conversions, and the way inflation is handled can move a value up or down even when the demand story sounds similar.
The main gap comes from whether broader water-based adhesive categories are folded in, where Mordor Intelligence counts only water-carried adhesive formulations and leaves out hot-melt, UV-cured, reactive two-part chemistries, and finished pressure-sensitive tape rolls, which can inflate totals in other estimates.
Benchmark comparison
| Source | Market Size | Gaps in Research Methodology |
|---|---|---|
| Mordor Intelligence | USD 9.08 B (2026) | |
| Industry Publisher A | USD 22.60 B (2024) | Uses a wider definition that can resemble the full water-based adhesives space, with a different base year and broader application capture, which can pull in adjacent technologies beyond water-borne formulations. |
| Research Platform B | USD 25.46 B (2025) | Appears to apply high adoption assumptions across large end uses and may include mixed adhesive technologies under a water-borne label, and differences in pricing progression and currency timing can further widen the gap. |
Seen together, the spread is mainly explained by scope choices and the way adoption and pricing are carried through the math. By keeping inclusions tied to defined water-borne chemistries and then validating the implied demand with end-use activity signals, the resulting figure stays traceable to clear inputs and can be refreshed consistently year after year.
Key Questions Answered in the Report
What is the current value of the water-borne adhesives market?
The market size is estimated at USD 9.08 billion in 2026 and is projected to reach USD 12.23 billion by 2031.
Which region leads global demand?
Asia-Pacific accounts for 40.45% of global revenue and shows the fastest 6.92% CAGR through 2031.
Which resin type is growing fastest?
Polyurethane dispersions are expanding at a 6.71% CAGR due to rising automotive and footwear adoption.
Why are VOC regulations important for adhesive selection?
Caps of 30-50 g/L in major economies effectively eliminate many solvent-borne products, pushing users toward low-emission water-borne chemistries.
How do water-borne adhesives improve vehicle performance?
Replacing 55 pounds of mechanical fasteners with just 2.2 pounds of PU dispersion cuts curb weight and boosts fuel economy by about 3%.
What are the key challenges for water-borne formulations?
Heat-resistance limitations above 120 °C and higher capex for specialized production lines restrict penetration in high-temperature and price-sensitive applications.