
Market Overview
| Study Period | 2020 - 2031 |
|---|---|
| Market Size (2026) | USD 69.08 Billion |
| Market Size (2031) | USD 92.58 Billion |
| Growth Rate (2026 - 2031) | 6.03 % |
| Fastest Growing Market | Asia Pacific |
| Largest Market | Asia Pacific |
| Market Concentration | Low |
Major Players *Disclaimer: Major Players sorted in no particular order Image © Mordor Intelligence. Reuse requires attribution under CC BY 4.0. | |
Water And Wastewater Treatment Technologies Market Analysis by Mordor Intelligence
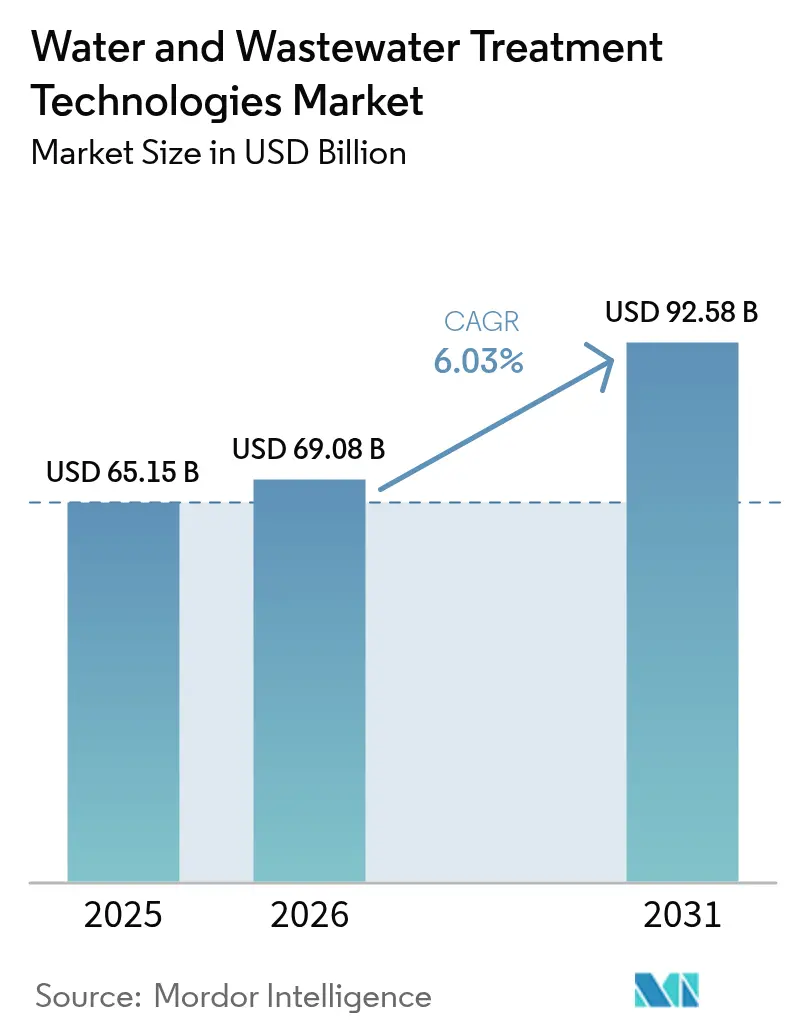
The Water And Wastewater Treatment Technologies Market size was valued at USD 65.15 billion in 2025 and estimated to grow from USD 69.08 billion in 2026 to reach USD 92.58 billion by 2031, at a CAGR of 6.03% during the forecast period (2026-2031). Robust growth flows from tightening environmental rules, rising zero-liquid-discharge expectations, and aggressive infrastructure upgrades that are unfolding in tandem across mature and emerging economies. Municipal utilities are front-loading investments to replace aging networks, while industrial users in water-stressed regions deploy advanced systems to secure permits and reclaim resources. Concurrently, artificial-intelligence tools are optimizing chemical dosing and asset uptime, turning operational savings into organic demand drivers. Consolidation is also reshaping competitive dynamics as integrated platforms emerge through mega-mergers, intensifying the innovation race in specialized niches such as PFAS destruction and microplastics removal.
Key Report Takeaways
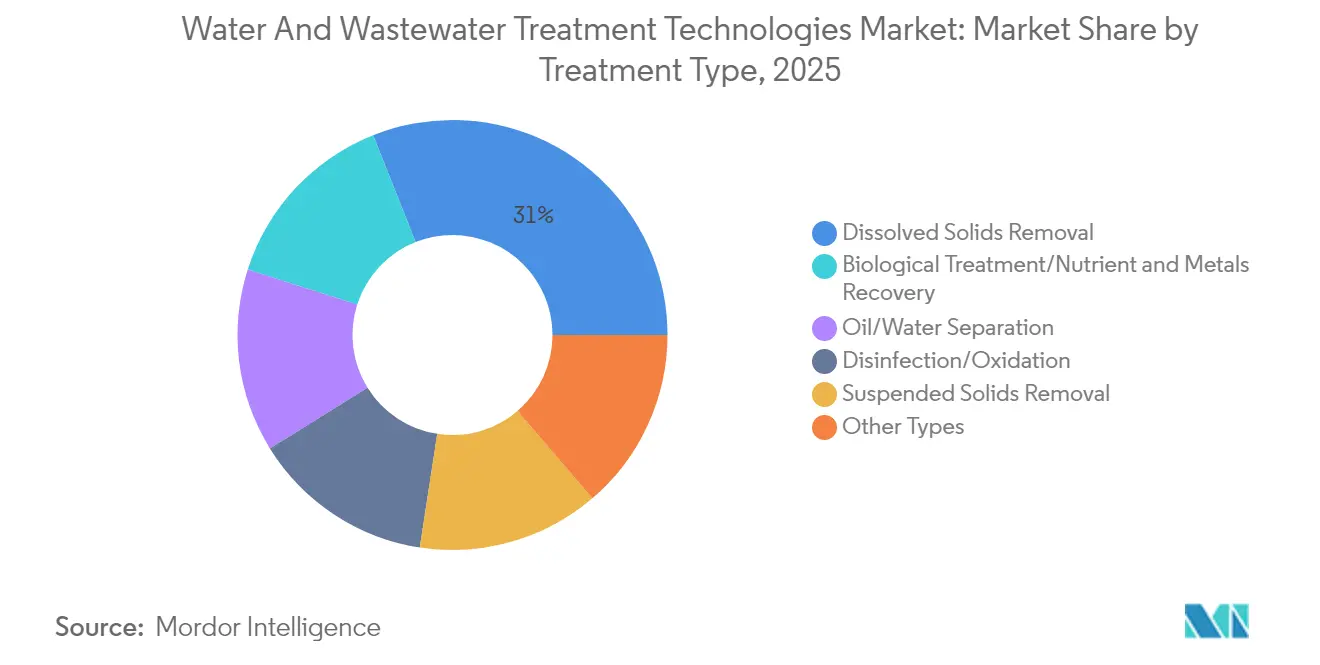
- By treatment type, dissolved solids removal technologies led with 31.02% of water and wastewater treatment technologies market share in 2025, whereas biological treatment and nutrient recovery is advancing at a 7.04% CAGR through 2031.
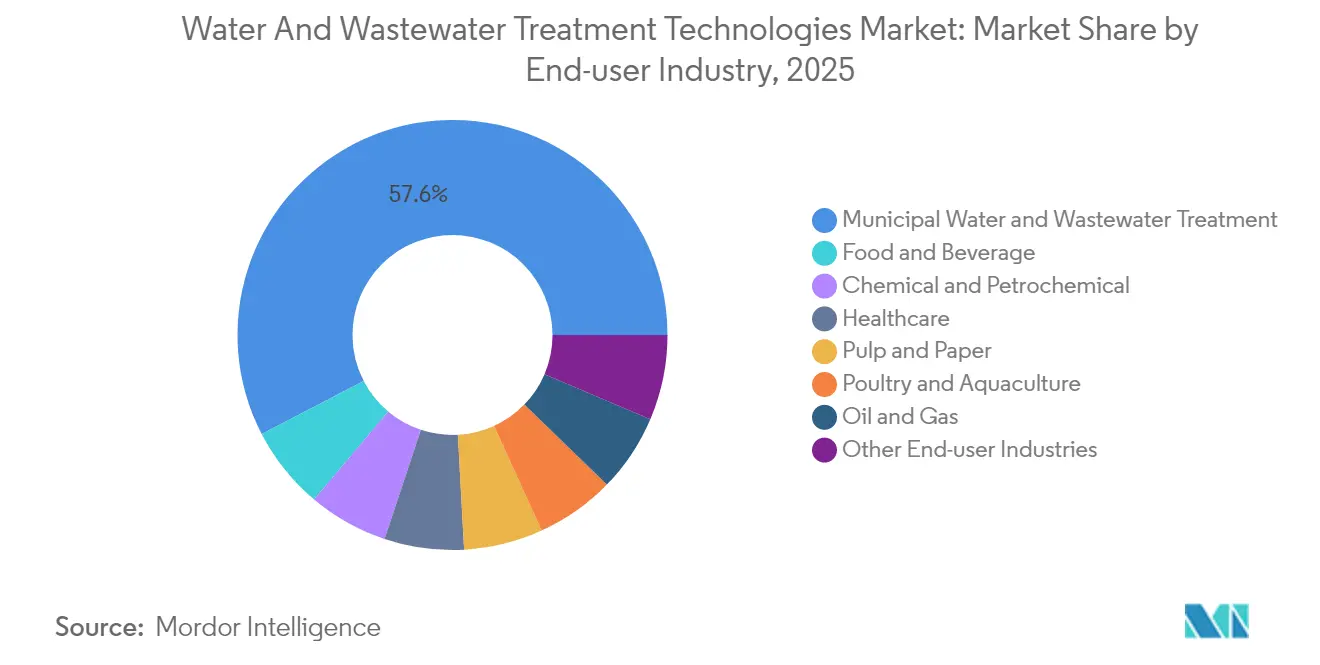
- By end-user industry, municipal applications accounted for 57.62% share of the water and wastewater treatment technologies market size in 2025, while food and beverage facilities are expanding at a 7.55% CAGR to 2031.
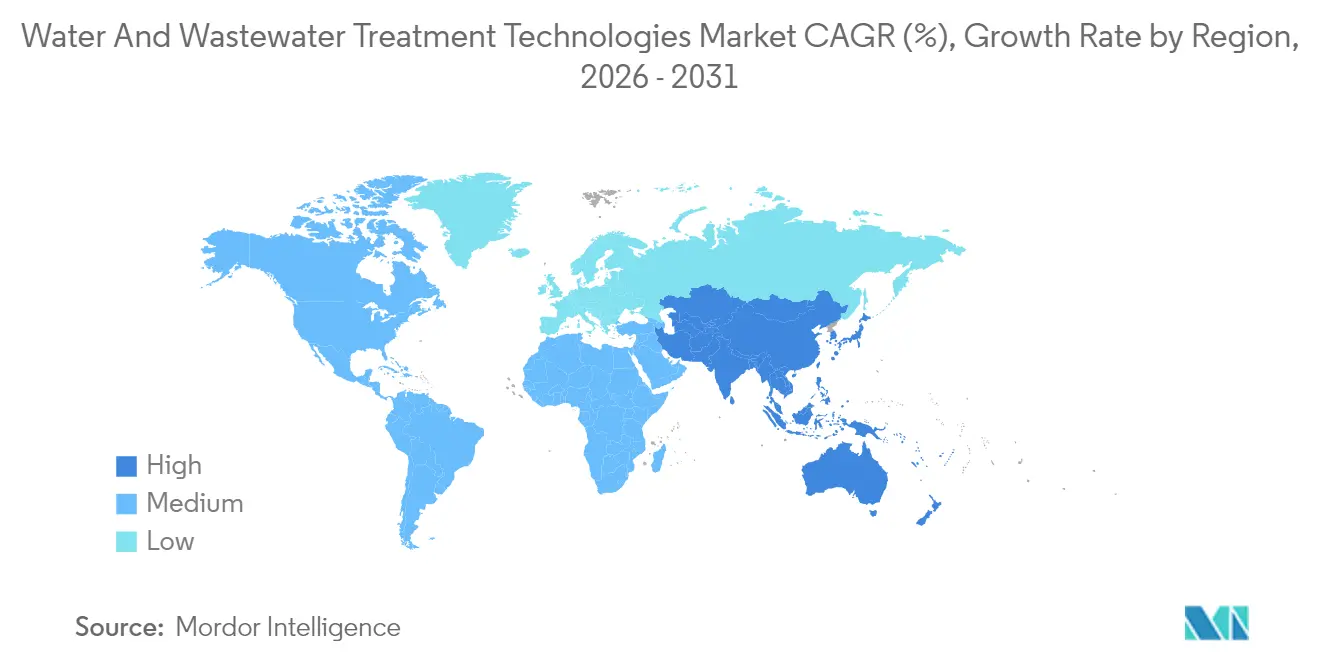
- By geography, Asia-Pacific commanded 34.55% of 2025 revenue in the Water And Wastewater Treatment Technologies Market and is climbing at the fastest 8.43% CAGR through 2031.
Note: Market size and forecast figures in this report are generated using Mordor Intelligence’s proprietary estimation framework, updated with the latest available data and insights as of 2026.
Market Trends and Insights
Drivers Impact Analysis of Water And Wastewater Treatment Technologies Market*
| Drivers | (~) % Impact on CAGR Forecast | Geographic Relevance | Impact Timeline |
|---|---|---|---|
| Stricter zero-liquid-discharge (ZLD) mandates | +1.8% | Global, with concentrated impact in Asia-Pacific and Middle East | Medium term (2-4 years) |
| Growth in decentralized modular treatment plants | +1.2% | North America and Europe, expanding to APAC | Long term (≥ 4 years) |
| Rising industrial reuse quotas in water-stressed regions | +1.5% | APAC core, Middle East, spill-over to Latin America | Short term (≤ 2 years) |
| Surge in capex for shale-based produced-water reuse | +1.0% | North America core, expanding to Argentina and Australia | Medium term (2-4 years) |
| AI-enabled smart metering and predictive maintenance | +0.9% | Global, with early adoption in North America and Europe | Medium term (2-4 years) |
| Source: Mordor Intelligence | |||
Stricter Zero-Liquid-Discharge Mandates
Heightened enforcement in power, petrochemical, and mining sectors is converting compliance budgets into strategic capital as facilities install integrated thermal evaporation, crystallization, and membrane lines that recover salts and minerals while driving near-zero discharge[1]. Early adopters are leveraging recovered by-products to offset part of their capex, widening the cost gap for laggards that still rely on basic physicochemical treatment. The mandate’s force is greatest in Asia and the Gulf, where new permits increasingly require ZLD readiness as a pre-condition for operation. Investors therefore view ZLD capability as a proxy for long-term license security, pushing equipment backlogs higher across the value chain. Over the medium term these rules are expected to lift the water and wastewater treatment technologies market by roughly 1.8 percentage points of CAGR.
Growth in Decentralized Modular Treatment Plants
Rapid urban sprawl is outstripping the pace at which centralized facilities can be sited and financed, heightening interest in containerized systems that can be delivered in months rather than years. Modular lines allow phased capacity additions that synchronize with real estate development cycles, ensuring utilities avoid stranded investment in oversize assets. The approach lowers entry barriers for small and midsize municipalities that lack access to bond funding for mega-plants, opening new addressable pockets for equipment suppliers. Europe and North America pioneered pilots, but replicability in densely populated Asian corridors is scaling volumes. Over a long-term horizon the trend contributes 1.2 percentage points to growth in the water and wastewater treatment technologies market.
Rising Industrial Reuse Quotas in Water-Stressed Regions
Mandatory reuse percentages now appear in operating licenses across the Middle East, Australia, and parts of the United States, converting wastewater from a disposal cost into a strategic resource. Petrochemical, mining, and food processors are re-engineering circuits around membrane bioreactors and advanced-oxidation polishing to meet 80–95% reuse thresholds. Payback periods are shrinking because avoided freshwater withdrawal fees and lower discharge tariffs accumulate rapidly in arid markets. The near-term nature of these rules supplies an additional 1.5 percentage-point lift to the Water And Wastewater Treatment Technologies Market CAGR.
AI-Enabled Smart Metering and Predictive Maintenance
Digitally native utilities are embedding sensor arrays that feed cloud engines predicting fouling events days ahead, slashing unplanned downtime and chemical overruns by up to 30%. Feedback loops dynamically modulate aeration blowers and high-pressure pump speeds, shaving electrical loads in energy-intensive reverse-osmosis systems. As firmware costs fall and cyber-security frameworks mature, adoption in the Water And Wastewater Treatment Technologies Market is broadening into mid-tier facilities worldwide. The shift from reactive to proactive maintenance culture is projected to add 0.9 percentage points to market growth through 2029.
Restraints Impact Analysis of Water And Wastewater Treatment Technologies Market*
| Restraints | (~) % Impact on CAGR Forecast | Geographic Relevance | Impact Timeline |
|---|---|---|---|
| High total cost of ownership for advanced membranes | -1.1% | Global, particularly impacting emerging economies | Long term (≥ 4 years) |
| Limited Operation and Maintenance skill base in emerging economies | -0.8% | APAC emerging markets, Africa, Latin America | Long term (≥ 4 years) |
| PFAS regulation uncertainty delaying tech adoption | -0.7% | North America and Europe, with spillover effects globally | Short term (≤ 2 years) |
| Source: Mordor Intelligence | |||
High Total Cost of Ownership for Advanced Membranes
Operational economics, not upfront purchase price, limit uptake of nanofiltration and reverse-osmosis modules. Progressive fouling raises cleaning frequency, shortening useful life and driving recurrent capital outlays that surpass initial equipment cost over a typical 12-year horizon. Compounded by the elevated power draw of 60-bar feed pumps, the hurdle is steepest for small utilities in developing markets that cannot leverage bulk chemical procurement or reliable grid power. As a result, many facilities postpone upgrades or adopt hybrid flowsheets that dilute membrane duty cycles. This structural cost drag is expected to shave 1.1 percentage points from the water and wastewater treatment technologies market’s CAGR.
PFAS Regulation Uncertainty Delaying Technology Adoption
Evolving toxicology thresholds and testing methods keep utilities guessing on final effluent standards, leading boards to defer large contracts for ion-exchange, granular-activated-carbon, and plasma destruction systems. Vendors are racing to offer turnkey destruction, yet without a definitive federal benchmark, procurement committees hesitate to lock in 20-year assets. The stalemate particularly affects North American municipal budgets, creating a temporary 0.7 percentage-point headwind. Partnerships like AECOM–Aquatech’s DE-FLUORO deployment aim to de-risk decisions by delivering destruction rather than removal, but full-scale validations remain underway.
*Our forecasts treat driver/restraint impacts as directional, not additive. The impact forecasts reflect baseline growth, mix effects, and variable interactions.
Water And Wastewater Treatment Technologies Market Segment Analysis
By Treatment Type:
Membrane Leadership Under Pressure from Bio-Nutrient RecoveryDissolved-solids removal systems captured 31.02% of water and wastewater treatment technologies market share in 2025 as reverse-osmosis and nanofiltration cemented their place in seawater desalination, brackish water reclamation, and high-recovery industrial lines. The segment’s installed base continues to swell on the back of large municipal desalination projects such as Taiwan’s 100,000 m³/day plant that broke ground in mid-2024.
Yet growth momentum tilts toward biological treatment and nutrient recovery technologies in the Water And Wastewater Treatment Technologies Market, which are forecast to log a 7.04% CAGR by 2031, a full percentage point above the total market average, helped by regulatory incentives that turn recovered phosphorus into a tradable fertilizer credit. At process level, breakthroughs like Fe(III)-triggered partial dissimilatory nitrate reduction coupled with anammox have boosted nitrogen removal beyond 95% while slashing energy demand, decreasing the payback hurdle for municipal biosolids upgrades.

By End-User Industry:
Municipal Heft Meets Food-and-Beverage AgilityMunicipal utilities maintained 57.62% of 2025 revenue in the Water And Wastewater Treatment Technologies Market as city councils funneled stimulus money into plant expansions, direct potable reuse pilots, and supervisory control upgrades. The food-and-beverage channel, although smaller, is scaling fastest at a 7.55% CAGR as breweries, dairies, and protein processors embed water stewardship in brand equity narratives. Membrane makers such as ZwitterCo are shipping fouling-resistant chemistries that tolerate high oils, proteins, and organics, allowing reuse rates above 90% in clean-in-place loops or boiler-feed circuits.
Consumer scrutiny of resource footprints accelerates procurement of closed-loop wash-water systems that simultaneously reduce discharge fees and energy usage. Beyond food and beverage, chemicals, pharmaceuticals, and pulp mills collectively underpin steady baseline demand in the Water And Wastewater Treatment Technologies Market, but growth rates trail municipal and food and beverage segments as many large complexes have already completed first-wave upgrades earlier in the decade.
Geography Analysis
APAC Water and Wastewater Treatment Technologies Market
Asia-Pacific holds a commanding 34.55% share of 2025 revenue in the Water And Wastewater Treatment Technologies Market and simultaneously records the highest 8.43% CAGR, underscoring a dual leadership seldom observed in mature infrastructure arenas. China continues to commission mega-desalination lines along coastal industrial parks, while Taiwan’s mammoth seawater RO plant highlights how semiconductor clusters dictate municipal water policy.
North America Water and Wastewater Treatment Technologies Market
North America sustains robust replacement outlays tied to aging 1970s-era assets and advanced regulatory frameworks. The region’s early embrace of direct potable reuse and pending PFAS limits guide technology adoption patterns toward high-grade membranes, granular activated carbon, and novel electro-chemical destruction cells. Municipal water boards in Texas, Colorado, and California now require detailed life-cycle cost analyses that favor high-recovery architectures and AI-enabled monitoring, elevating software vendors within the water and wastewater treatment technologies market.
Europe Water and Wastewater Treatment Technologies Market
Europe remains a crucible for intellectual property, producing 40% of global water-related patents between 1992 and 2021, with PFAS remediation, resource-positive biosolids, and energy-neutral filtrations at the forefront.
Regulatory Landscape
Regulation is tightening around advanced contaminant removal and higher wastewater treatment performance, pushing utilities and industrial operators toward quaternary treatment, reuse, and specialized removal technologies such as PFAS. In the European Union, the recast Urban Wastewater Treatment Directive, Directive (EU) 2024/3019, introduces new requirements including quaternary treatment obligations for large plants (notably at and above 150,000 population equivalent) and risk-based triggers for smaller agglomerations. This is directly expanding demand for advanced oxidation, adsorption, membranes, and nutrient removal upgrades.
Policy is also reshaping who pays for upgrades and how quickly programs move. Directive (EU) 2024/3019 requires an Extended Producer Responsibility scheme to be in place by end-2028, with pharmaceutical and cosmetics producers covering at least 80% of quaternary treatment costs. That influence is likely to affect procurement models and vendor engagement beyond municipal budgets. In the United States, the EPA proposed the Sixth Unregulated Contaminant Monitoring Rule (UCMR 6) on July 1, 2026, covering 30 contaminants for monitoring in public water systems during 2028 to 2030. This raises near-term needs for monitoring, analytical capacity, and treatment planning, while EPA PFAS initiatives continue to steer technology selection even as some PFAS-related determinations remain in proposal stages.
Value Chain Analysis
The value chain spans upstream chemicals and materials (coagulants, resins, activated carbon, membrane polymers such as PVDF), equipment and system OEMs (membranes, pumps, blowers, controls), and engineering and integrators delivering EPC and design-build-operate (DBO) projects. Distribution is split between direct OEM sales for large municipal and industrial programs and specialist distributors for chemicals and consumables. Aftermarket services such as membrane replacement, cartridge change-outs, performance audits, and remote monitoring are increasingly anchoring lifecycle revenue as digital tools optimize dosing and uptime.
Recent activity points to localized manufacturing partnerships and full-cycle industrial contracting to reduce lead times and improve performance accountability. In April 2026, Ion Exchange (India) and MANN+HUMMEL initiated a technology collaboration to produce advanced PVDF ultrafiltration membranes and integrated systems at Ion Exchange's Goa facility, supporting faster regional supply for modular and packaged solutions. On the services side, Xylem expanded a long-term agreement with Dow in June 2026 to design, build, and operate advanced water systems at Fort Saskatchewan in Alberta, reinforcing a value-chain tilt toward bundled technology plus operations. Supply-chain risk management remains important, with utility-facing procurement constrained by compliance requirements such as NSF/ANSI standards for drinking water treatment chemicals, and by episodic raw material and logistics disruptions.
Competitive Landscape
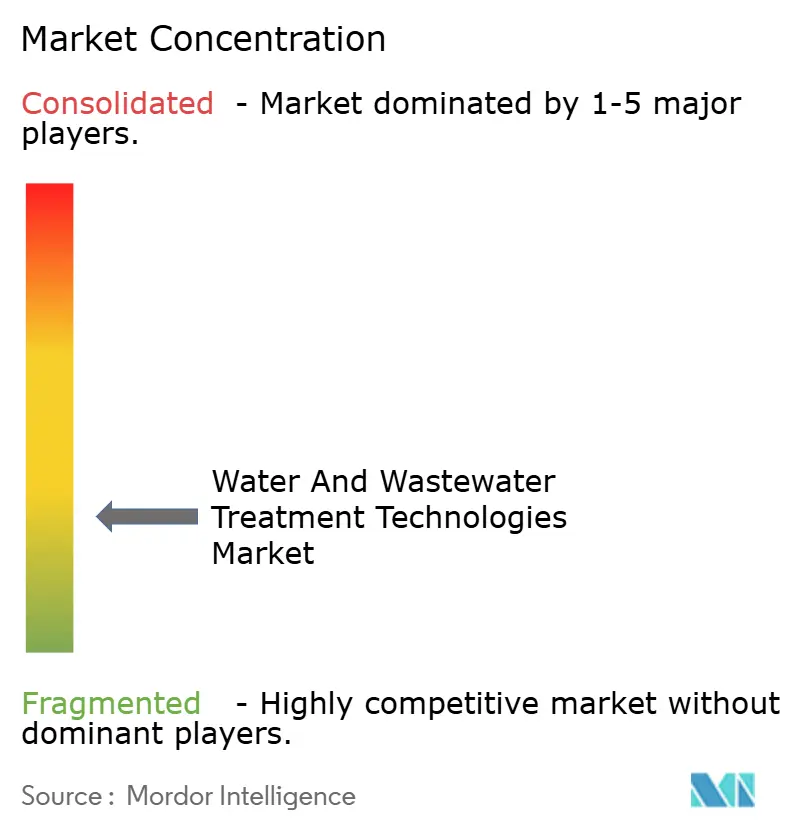
The water and wastewater treatment technologies market is highly fragmented but trending toward tighter concentration as cross-border acquirers assemble end-to-end portfolios. Hardware commoditization in standard membranes pushes incumbents to differentiate through AI-driven services, life-cycle performance contracts, and contaminant-specific solutions. PFAS has emerged as the hottest micro-segment, with entrants like AECOM, Aquatech, and emerging plasma-reactor providers racing to cement reference plants before final EPA thresholds crystallize. Microplastics mitigation is another nascent battleground, where CLEANR’s VORTX filtration module is piloting with apparel laundries and cruise vessels to intercept fibers at source.
Water And Wastewater Treatment Technologies Industry Leaders
-
Veolia
-
DuPont
-
Ecolab
-
Kurita Water Industries Ltd.
-
Xylem
- *Disclaimer: Major Players sorted in no particular order
Water And Wastewater Treatment Technologies Market Companies Covered in this Report
- AECOM
- Aquatech
- Black & Veatch Corporation
- Doosan Enerbility
- DuPont
- Ecolab
- HDO
- Hitachi, Ltd.
- Kurita Water Industries Ltd.
- Mott MacDonald
- Pentair
- REMONDIS SE & Co. KG
- Siemens
- SLB
- Thermax Limited
- Veolia
- WABAG
- Xylem
Read Analysis of Water And Wastewater Treatment Technologies Companies
Market Opportunities and Future Outlook
White-space is forming where emerging contaminant management, industrial reuse mandates, and municipal capacity expansion overlap, with technology choices extending beyond conventional treatment into PFAS removal and destruction, quaternary polishing, and modular deployment. In the United States, EPA actions in 2026 sharpen near-term demand signals for both monitoring and treatment planning, including draft guidance in July 2026 for managing PFOA and PFOS in biosolids from wastewater treatment plants and the proposed UCMR 6 monitoring framework. These steps are translating into concrete projects and supplier positioning, including De Nora being selected in July 2026 by Hampton Roads Sanitation District for a PFAS treatment system at the Nansemond Treatment Plant in Virginia, and the AECOM-Aquatech DE-FLUORO positioning referenced in the report context as utilities seek options beyond adsorption-only approaches.
Large, funded build-outs and modularization are also expanding the addressable market for membranes, oxidation, nutrient removal, and digital optimization. In April 2026, Austin Water began construction on a USD 1.5 billion expansion of the Walnut Creek Wastewater Treatment Plant (75 MGD to 100 MGD), and in June 2026 Onondaga County entered negotiations for a USD 1 billion industrial wastewater treatment plant tied to Micron Technology. This underscores how industrial reshoring and semiconductor clusters are pulling forward municipal and industrial treatment investments. Containerized and standardized systems are moving from pilots to procurement-ready offerings, including Acuriant Technologies launching a containerized ceramic ultrafiltration system in June 2026, while decarbonization-linked innovation is entering field trials, such as the ElecTrickle bioelectrochemical process at a Scottish Water site. Together, these developments broaden the technology funnel for utilities balancing compliance, energy, and lifecycle cost.
Recent Industry Developments in Water And Wastewater Treatment Technologies Market
- July 2026: Kurita Water Industries Ltd. and Membrane Group India established Kurita Membrane India Private Limited to provide water treatment, recycling, and resource recovery solutions for the electronics and semiconductor industry in India. The move localizes capabilities around high-spec industrial water demand and supports shorter lead times for advanced membrane-based systems in a fast-expanding end-user segment.
- June 2026: Xylem signed a long-term agreement with Dow to design, build, and operate advanced water systems at the Fort Saskatchewan industrial complex in Alberta, Canada. The agreement reinforces the shift toward performance-based, full water-cycle delivery models that bundle equipment, digital controls, and operations services under longer-duration contracts.
- January 2024: SUEZ, a subsidiary of Veolia, secured a design-build-operate contract for a 100,000 m3/day seawater reverse osmosis plant in Taiwan. This contract supports continued large-scale desalination build-out in Asia-Pacific and sustains demand for dissolved-solids removal equipment, high-pressure pumping, and associated pretreatment technologies.
Water And Wastewater Treatment Technologies Market Report Scope and Research Methodology
Market Definition and Coverage
This market covers the revenue generated from technologies used to treat raw water and wastewater so contaminants are removed and discharge or reuse standards are met, covering both municipal and industrial end users across major regions.
Scope exclusions: We exclude general civil construction spending and unrelated utility services unless they are directly tied to treatment technology supply and deployment.
Segments Covered in This Report
- By Treatment Type
- Oil/Water Separation
- Suspended Solids Removal
- Dissolved Solids Removal
- Biological Treatment/Nutrient and Metals Recovery
- Disinfection/Oxidation
- Other Types
- By End-user Industry
- Municipal Water and Wastewater Treatment
- Food and Beverage
- Pulp and Paper
- Oil and Gas
- Healthcare
- Poultry and Aquaculture
- Chemical and Petrochemical
- Other End-user Industries
- By Geography
- Asia-Pacific
- China
- India
- Japan
- South Korea
- ASEAN
- Rest of Asia-Pacific
- North America
- United States
- Canada
- Mexico
- Europe
- Germany
- United Kingdom
- France
- Italy
- Spain
- Russia
- Rest of Europe
- South America
- Brazil
- Argentina
- Rest of South America
- Middle-East and Africa
- Saudi Arabia
- South Africa
- Rest of Middle-East and Africa
- Asia-Pacific
Data Sources, Market Sizing, and Validation
Desk Research
Desk research was used to set the market boundary, build the first demand picture, and set assumptions that could be checked later in interviews. We leaned on public sources such as the US EPA, the European Environment Agency, UN-Water, the World Bank, and OECD water statistics to understand regulation direction, treatment needs, and funding cycles.
To anchor model inputs, we also reviewed national water utility dashboards, trade association publications, peer-reviewed journals on membrane and disinfection performance, and customs statistics for selected filtration and treatment equipment categories. Company annual reports, investor presentations, and reputable news coverage were then used to validate expansion plans, capacity additions, and order momentum. In parallel, we used paid database subscriptions for company financials and intelligence, patent searches, and shipment-level trade checks where they improved data consistency. These sources are illustrative and not exhaustive, and we also used other public documents to collect, validate, and clarify data points.
Primary Interviews and Surveys
Primary work focused on confirming what is counted as technology revenue, how projects are priced (equipment versus packaged solutions), and how replacement demand differs from new build activity. We spoke with technology suppliers, system integrators, municipal stakeholders, and industrial EHS and plant teams across major regions, then used feedback to tighten adoption rates, typical upgrade cycles, and regional spending patterns.
Distribution of primary research fieldwork respondents
| Company type | Respondent position | Region |
|---|---|---|
| Top tier: 39% | CXOs: 14% | APAC: 38% |
| Mid tier: 43% | Functional/Unit leaders: 38% | EMEA: 37% |
| Smaller Players: 18% | Managers: 48% | Americas: 25% |
Market-Sizing & Forecasting
Sizing started with a top-down build where public water spending signals, treatment capacity additions, and industrial compliance intensity were used to reconstruct the addressable technology demand pool by region. Once that structure was set, we cross-checked results with selective bottom-up approximations, including sampled supplier revenue splits, typical project bill-of-material shares, and volume times average selling price checks for key unit operations.
Several market fingerprints were treated as key inputs because they move demand in a visible way, including municipal capex cycles, non-revenue water and leakage reduction programs that pull filtration and disinfection upgrades, wastewater discharge limits that drive tertiary treatment, and industrial expansion in water-intensive sectors. We also tracked replacement and retrofit timing for aging plants, which is often steadier than new build demand. For forecasting, scenario analysis was used to reflect different infrastructure funding speed, tightening regulation timelines, and industrial output paths, then the final trajectory was aligned with what primary respondents see in project backlogs and tender activity. Where bottom-up data was thin in smaller countries, gaps were handled through proxy indicators like population served, connected wastewater coverage, and typical capex per cubic meter benchmarks, followed by regional consistency checks.
Data Validation & Update Cycle
Outputs were validated through triangulation across demand signals, supplier commentary, and trade and macro indicators, then checked for outliers at the segment and regional level. When a variance looked too large, we revisited assumptions and, where needed, triggered follow-up calls to re-check pricing, mix, or timing.
Before sign-off, the model goes through multi-step analyst reviews where totals are reconciled against independent markers such as water and wastewater investment plans and procurement cadence. Reports are refreshed annually, and interim updates are made when material events occur, including major regulatory shifts or large municipal funding announcements. Right before delivery, an analyst performs a final pass so clients receive the latest updated view.
Mordor Intelligence's Water and Wastewater Treatment Technologies Market Size Measured Against Other Published Estimates
Published market sizes for water and wastewater treatment technologies often do not match because the counted scope can shift, and the assumed pricing and project mix can change the total quickly. Differences also come from how firms treat municipal versus industrial demand, and whether they include chemicals, services, or only equipment and technology packages.
By tracking treatment-capacity additions, equipment price bands, and retrofit cycles, Mordor Intelligence keeps the estimate centered on technology revenues, instead of expanding the scope into broad utility operations or chemical consumption. In some public estimates, totals rise mainly because wider process coverage is used (for example, folding in chemicals and ongoing services), and in others the forecast path is driven by a more aggressive funding and regulation timeline assumption.
Benchmark comparison
| Source | Market Size | Gaps in Research Methodology |
|---|---|---|
| Mordor Intelligence | USD 69.08 B (2026) | |
| Industry Research House A | USD 108.75 B (2026) | The scope appears broader, where chemicals and a wider set of process offerings are counted alongside technologies, which pushes the total above a technology-focused definition. |
| Industry Research House B | USD 350.70 B (2025) | The number is closer to the overall water and wastewater treatment market, where municipal and industrial spending across multiple offerings is aggregated, making it less comparable to a technology-only revenue boundary. |
The table shows that the main spread comes from scope boundaries first, and then from how pricing and demand drivers are carried into the forecast year. When the counted items are kept consistent and checked against practical indicators like capacity additions and upgrade cycles, the market size becomes easier to reproduce and explain in a client discussion.
Key Questions Answered in the Report
What is the projected value of the water and wastewater treatment technologies market by 2031?
The market is forecast to reach USD 92.58 billion by 2031, reflecting a 6.03% CAGR over the projection period (2026-2031).
Which region is expected to grow fastest through 2031?
Asia-Pacific leads growth with an 8.43% CAGR, driven by urbanization and stringent regulations.
Which treatment type currently holds the largest market share?
Dissolved-solids removal, mainly reverse-osmosis systems, accounts for 31.02% of 2025 revenue.
Why is the food and beverage sector attracting attention in water treatment?
Sustainability mandates and water-footprint targets are pushing food and beverage facilities to adopt advanced reuse systems, resulting in a 7.55% CAGR to 2031.
How are AI tools influencing water treatment operations?
AI-powered metering and predictive maintenance slash chemical usage and unplanned downtime by up to 30%, improving efficiency across facilities.