
Warfarin Sensitivity Test Market Size and Share
Market Overview
| Study Period | 2020 - 2031 |
|---|---|
| Forecast Data Period | 2026 - 2031 |
| Historical Data Period | 2020 - 2024 |
| Growth Rate | 5.03 % |
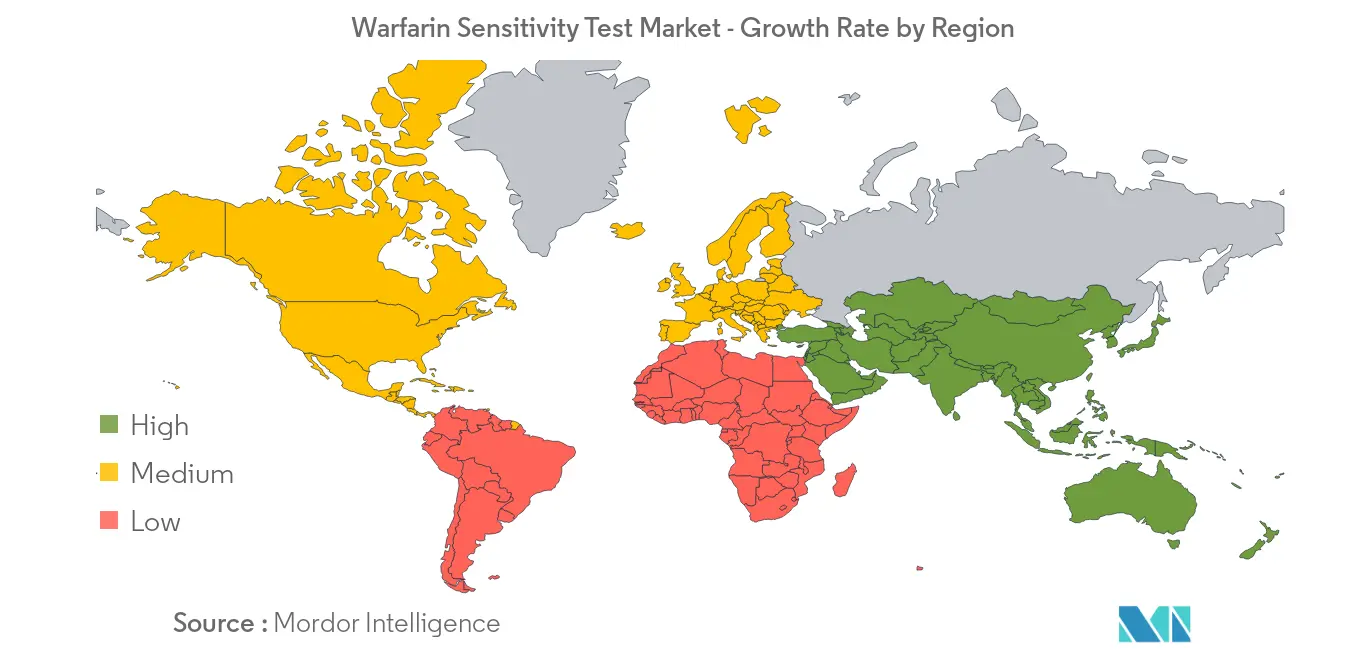
| Fastest Growing Market | Asia Pacific |
| Largest Market | North America |
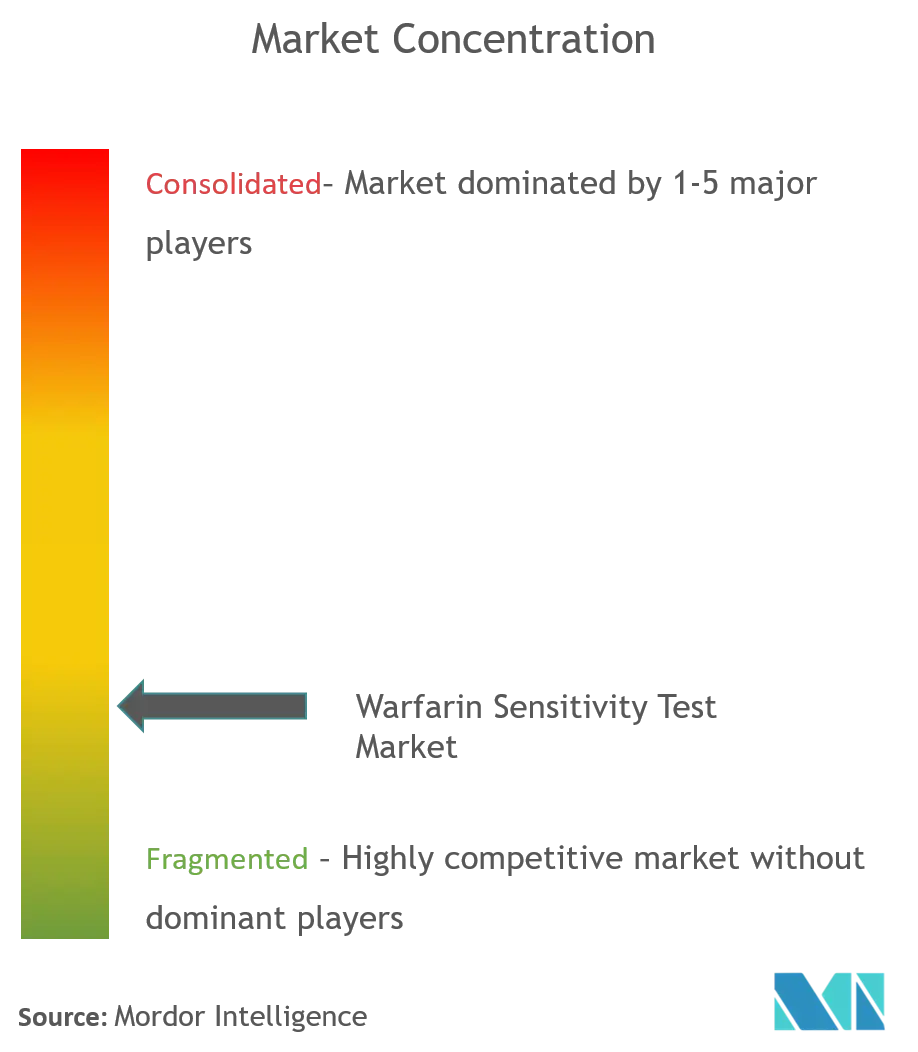
| Market Concentration | Low |
Major Players *Disclaimer: Major Players sorted in no particular order Image © Mordor Intelligence. Reuse requires attribution under CC BY 4.0. | |
Warfarin Sensitivity Test Market Analysis by Mordor Intelligence
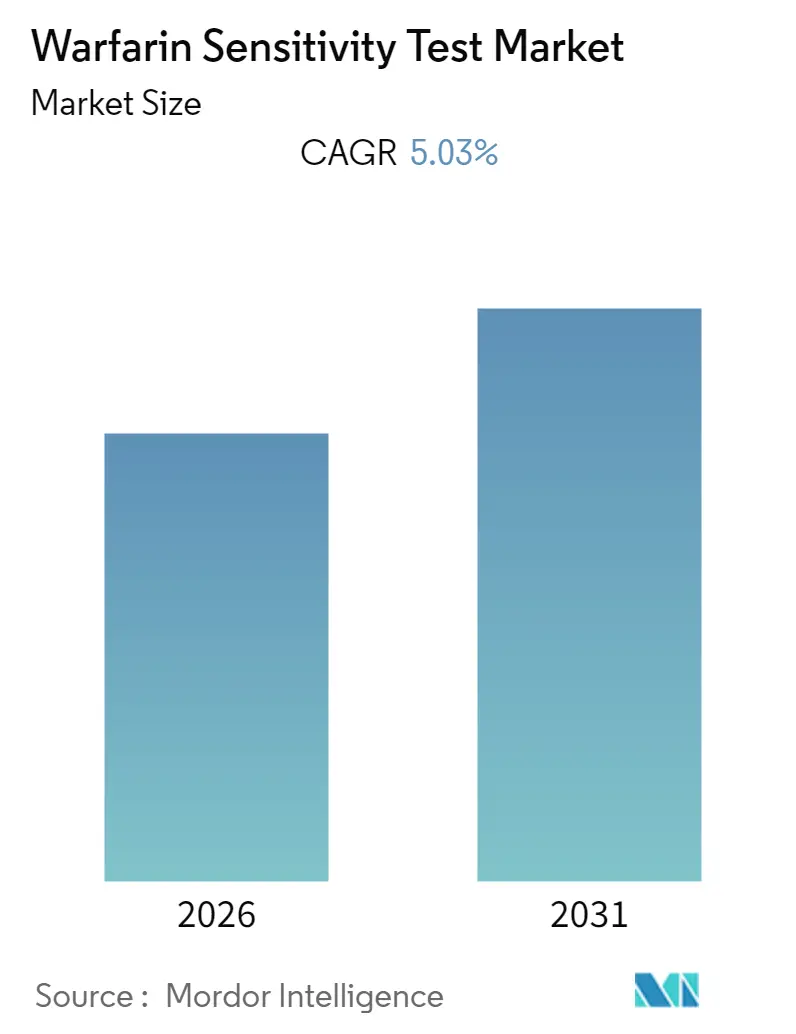
The Warfarin Sensitivity Test Market size is expected to register a CAGR of 5.03% during the forecast period.
- Thrombosis refers to the condition wherein a clot is formed in a blood vessel. According to the International Society of Thrombosis and Haemostasis, around one out of four people die due to thrombosis globally each year.
- Furthermore, according to the Center for Disease Control and Prevention, in 2020, between 60,000 to 100,000 people died due to thrombosis in the United States, and approximately 5 % to 8 % of the population has a genetic defect.
- The treatment for these disorders involves warfarin drug, and hence, the warfarin sensitivity test market is expected to witness high growth over the forecast period.
Note: Market size and forecast figures in this report are generated using Mordor Intelligence’s proprietary estimation framework, updated with the latest available data and insights as of 2026.
Global Warfarin Sensitivity Test Market Trends and Insights
Genetic Testing Segment is Expected to Hold a Major Market Share in the Warfarin Sensitivity Test Market
- Warfarin is the most widely used anticoagulant for the treatment of thrombosis. However, the sensitivity toward it can cause serious complications, such as heart stroke, peptic diseases, and uncontrolled blood pressure, among others. The sensitivity depends upon the number of copies of the altered gene in the cell. According to the study published by BMC Medicine, in 2019, the accurate dose of warfarin was determined in the patients with the help of a point-of-care genotyping information approach.
- In addition, according to the data published by the International Society on Thrombosis and Haemostasis Inc., every year, the United States experiences an approximate number of 100,000 to 300,000 deaths related to venous thromboembolism, while in Europe, it has been observed to be at approximately 554,000 deaths.
- Furthermore, according to the National Institute of Health, approximately 2 million people have been prescribed warfarin annually, and around 35,000 to 45,000 people visit the hospital for adverse events due to warfarin. Therefore, the aforementioned factors are expected to fuel the market growth in this segment.

North America is Expected to Hold a Significant Share in the Market and Expected to do Same in the Forecast Period
North America is expected to hold a major market share in the global warfarin sensitivity test market due to the rise in the aging population and the associated bleeding disorders. The geriatric population is at a higher risk of warfarin sensitivity. The elder population has decreased metabolic activities, which alter the pharmacokinetics of the drug, and hence, higher sensitivity is observed in the geriatric population. According to the data published by the US Census Bureau, in 2018, there were around 52 million people living at the age of 65 and above. Furthermore, according to the Center for Disease Control and Prevention, at least 900,000 people are likely to suffer from venous thromboembolism. Hence, these factors are expected to propel the warfarin sensitivity test market growth.
Regulatory Landscape
Regulation and adoption of warfarin sensitivity testing are influenced more by clinical guidance and reimbursement policy than by mandatory requirements. In the United States, FDA-approved warfarin labeling includes pharmacogenomic information (notably CYP2C9 and VKORC1 variants) describing their impact on dose requirements, but it does not require pharmacogenetic testing as a condition of use.
Coverage policy remains a gating factor for routine uptake. A key constraint is the US Centers for Medicare and Medicaid Services (CMS) National Coverage Determination pathway for warfarin pharmacogenomic testing, which limits reimbursement to patients initiating warfarin who are enrolled in qualifying clinical studies measuring outcomes such as major bleeding or thromboembolic events. Clinical implementation is also supported by established dosing guidance, including the Clinical Pharmacogenetics Implementation Consortium (CPIC) guideline (2017 update), and by broader European frameworks where the European Medicines Agency (EMA) provides scientific guidance on use of pharmacogenomic methodologies in drug evaluation and pharmacovigilance, reinforcing the need for clinical validity evidence when pharmacogenomic biomarkers are incorporated into labeling or monitoring.
Competitive Landscape
The companies have been constantly focused on developing new products related to warfarin sensitivity test, in order to grow their presence in the market. For instance, in 2019, Eurolyser DIagnostica Gmbh added bidirectional connectivity to the 'CUBE' series to enhance the data management software. Some of the companies, which are currently dominating the market, are AutoGenomics, Abbott, Eurolyser Diagnostica GmbH, TrimGen Corporation, Generi Biotech, F. Hoffmann-La Roche Ltd, Acon Laboratories Inc., and Coagu Sense Inc.
Warfarin Sensitivity Test Industry Leaders
-
Abbott
-
Hoffmann-La Roche Ltd.
-
Eurolyser Diagnostica GmbH
-
AutoGenomics
-
Trimgen Corporation
- *Disclaimer: Major Players sorted in no particular order
Market Opportunities and Future Outlook
Market opportunities for warfarin sensitivity testing center on making genotype-informed dosing actionable at the point of prescribing, rather than treating genotyping as a standalone lab result. The CPIC guideline provides a standardized interpretation framework across key markers (CYP2C9, VKORC1, and additional variants such as CYP4F2 and rs12777823), which gives test vendors and healthcare providers a practical basis for embedding genotype-based starting dose ranges and alerts into electronic health records and clinical decision support workflows.
There is also room for faster turnaround testing models aligned to warfarin initiation, including rapid or point-of-care genotyping that can support early dose selection and reduce titration burden. Recent peer-reviewed evidence continues to refine algorithmic approaches that combine genetics with clinical covariates and Bayesian modeling. For instance, publications in 2026 reported reduced dose titrations during the first 14 days of treatment in certain Asian patient cohorts using pharmacogenetic or individualized (genetics plus Bayesian) strategies, which shows how early-phase dosing efficiency can be improved. At the same time, variability in payer policy and mixed conclusions across large-scale trials keeps demand concentrated in health systems and regions that actively operationalize pharmacogenomics, including pre-emptive genotyping programs supported by local pharmacogenetics working groups. This dynamic favors solutions that bundle testing with interpretive software and workflow integration.
Recent Industry Developments
- July 2026: Roche updated its professional and patient education content around PT/INR testing and patient self-testing within the CoaguChek ecosystem. The continued emphasis on point-of-care workflows and self-testing support reinforces demand for connected coagulation monitoring alongside warfarin management programs.
- March 2025: TrimGen continued offering its Mutector Warfarin Genotyping Kit (RUO), designed to detect CYP2C9*2, CYP2C9*3, and VKORC1 (-1639G>A) variants in a single-tube format. Sustained availability of targeted genotyping kits supports labs and researchers building or validating genotype-guided dosing pathways.
- February 2024: The FDA maintained its public listing of cleared or approved companion diagnostic devices as part of its in vitro diagnostics resources. While warfarin pharmacogenetic testing is not positioned as a companion diagnostic requirement, the ongoing federal emphasis on transparent IVD categorization underlines the importance of clear intended use, analytical validation, and labeling claims for test developers.
Research Methodology Framework and Report Scope
Market Definition and Coverage
This market covers revenue generated from tests used to guide warfarin dosing by assessing patient sensitivity, mainly through genetic markers such as CYP2C9 and VKORC1 and the related testing workflows. It includes instruments and consumables used to run and report these tests in clinical settings.
Scope exclusions: It excludes warfarin drug sales, routine INR monitoring consumables that are not linked to sensitivity testing, and broader pharmacogenomics panels where warfarin is not a defined reportable output.
Segmentation Overview
- By Product Type
- Instrument
- Consumable
- By Test Type
- Genetic
- Non-genetic
- Geography
- North America
- United States
- Canada
- Mexico
- Europe
- Germany
- United Kingdom
- France
- Italy
- Spain
- Rest of Europe
- Asia-Pacific
- China
- Japan
- India
- Australia
- South Korea
- Rest of Asia-Pacific
- Middle East & Africa
- GCC
- South Africa
- Rest of Middle East & Africa
- South America
- Brazil
- Argentina
- Rest of South America
- North America
Data Sources, Market Sizing, and Validation
Desk Research
Desk work starts with public clinical and testing signals so the model is not built only from vendor narratives. We refer to sources such as the US FDA device and safety databases, NIH and NLM resources (including clinical trials and genetics references), CDC and other public health publications, and OECD and World Bank health indicators to understand spending and access context.
We also scan peer reviewed papers on pharmacogenetic dosing, laboratory medicine journals, and association materials to understand where sensitivity testing is routinely used and where it is still limited. Company annual reports, investor presentations, and reputable press releases are used to map product availability and track launch timing. Where needed, paid subscriptions for company financials and patent databases are used to confirm product footprint and technology direction. These desk sources are not exhaustive, and many other public references are also used for cross-checking and clarification.
Primary Interviews and Surveys
Primary inputs are taken from interviews and structured surveys with diagnostic lab leaders, hospital pharmacy and anticoagulation clinic stakeholders, and test supply side experts who track ordering patterns. Because this is a global market, we also validate adoption differences across major regions, and then use the feedback to refine test mix assumptions, pricing bands, and the share of patients actually routed to sensitivity testing.
Distribution of primary research fieldwork respondents
| Company type | Respondent position | Region |
|---|---|---|
| Top tier: 34% | CXOs: 12% | APAC: 38% |
| Mid tier: 47% | Functional/Unit leaders: 40% | EMEA: 37% |
| Smaller Players: 19% | Managers: 48% | Americas: 25% |
Market-Sizing & Forecasting
The core build uses a top-down approach where the patient demand pool is reconstructed from warfarin use in relevant care pathways, then filtered by the share eligible for sensitivity testing and the share that actually gets tested in real practice. To keep it grounded, we corroborate the totals with selective bottom-up approximations, such as sampled test volume discussions from labs, channel checks on kit usage, and a price per test range applied to realistic throughput.
Key model inputs include warfarin prescription and patient exposure trends, the proportion of testing that is single gene versus combined gene reporting, typical turnaround time and ordering workflows (which affects whether testing is repeated), average selling price by technology type (PCR, microarray, sequencing), and region-wise reimbursement and guideline adoption signals. When bottom-up checks show gaps, we do not force full coverage, and instead apply conservative fill rates based on comparable lab utilization and confirmed distribution presence.
For forecasting, scenario analysis is used because clinical adoption can change with guideline updates, reimbursement shifts, and lab capacity. Growth rates are adjusted using expert consensus on expected testing penetration, technology mix shift, and pricing pressure, and then rechecked against implied test volumes so the trajectory stays realistic year by year.
Data Validation & Update Cycle
Outputs are validated through cross-checks against independent signals, such as implied tests per warfarin exposed patient and the expected share of genetic testing within anticoagulation management. Outliers are flagged, assumptions are re-opened, and respondents may be re-contacted when pricing, reimbursement, or adoption differs materially from earlier inputs.
Before sign-off, the model and narrative go through multi-step analyst review so definitions, math, and regional splits stay consistent. The report is refreshed on an annual cycle, and interim updates are done when material events occur, including major regulatory changes or notable shifts in clinical practice. Right before delivery, a final pass is completed so clients receive the most current view available.
Mordor Intelligence's Warfarin Sensitivity Test Market Sizing Compared With Other Published Estimates
Published estimates for this market often do not line up because the scope is defined differently across studies, and assumed testing penetration varies by region and care setting. Another common driver is whether the estimate is built from a patient eligible pool, or from a broader genetic testing spend view that can pull in adjacent panels.
The main gap comes from whether broad pharmacogenomics panels and non-warfarin genetic assays are counted. Mordor Intelligence only counts warfarin sensitivity related testing output tied to dosing decisions, then prices it using technology-specific test mix rather than a single blended ASP. Differences also come from base year choices, currency timing, and how fast adoption is assumed to rise when reimbursement is uneven, which can push numbers higher or lower depending on the scenario used.
Benchmark comparison
| Source | Market Size | Gaps in Research Methodology |
|---|---|---|
| Mordor Intelligence | USD 0.00 B (2024) | |
| Global Consultancy A | USD 1.12 B (2024) | Often reflects a wider warfarin sensitivity testing definition that can include broader genotyping assay revenues and related services, and it may use a faster adoption curve without rechecking implied tests per warfarin exposed patient. |
| Industry Publisher B | USD 1.54 B (2025) | Typically anchors on a later base year and can apply higher growth assumptions by treating multi-gene testing as the default, which lifts ASP and may overstate near-term penetration in regions with limited reimbursement. |
Looking across the three figures, the spread is mostly explained by what is included in the test revenue pool and how quickly the model moves patients from eligibility to real testing. By keeping assumptions tied to practical ordering behavior, technology mix, and region-wise access checks, our estimate stays traceable and easier to reproduce when inputs are updated.
Key Questions Answered in the Report
What is the current Warfarin Sensitivity Test Market size?
The Warfarin Sensitivity Test Market is projected to register a CAGR of 5.03% during the forecast period (2026-2031)
Who are the key players in Warfarin Sensitivity Test Market?
Abbott, Hoffmann-La Roche Ltd., Eurolyser Diagnostica GmbH, AutoGenomics and Trimgen Corporation are the major companies operating in the Warfarin Sensitivity Test Market.
Which is the fastest growing region in Warfarin Sensitivity Test Market?
Asia Pacific is estimated to grow at the highest CAGR over the forecast period (2026-2031).
Which region has the biggest share in Warfarin Sensitivity Test Market?
In 2025, the North America accounts for the largest market share in Warfarin Sensitivity Test Market.
What years does this Warfarin Sensitivity Test Market cover?
The report covers the Warfarin Sensitivity Test Market historical market size for years: 2019, 2020, 2021, 2022, 2023 and 2024. The report also forecasts the Warfarin Sensitivity Test Market size for years: 2026, 2027, 2028, 2029, 2030 and 2031.