
Market Overview
| Study Period | 2020 - 2031 |
|---|---|
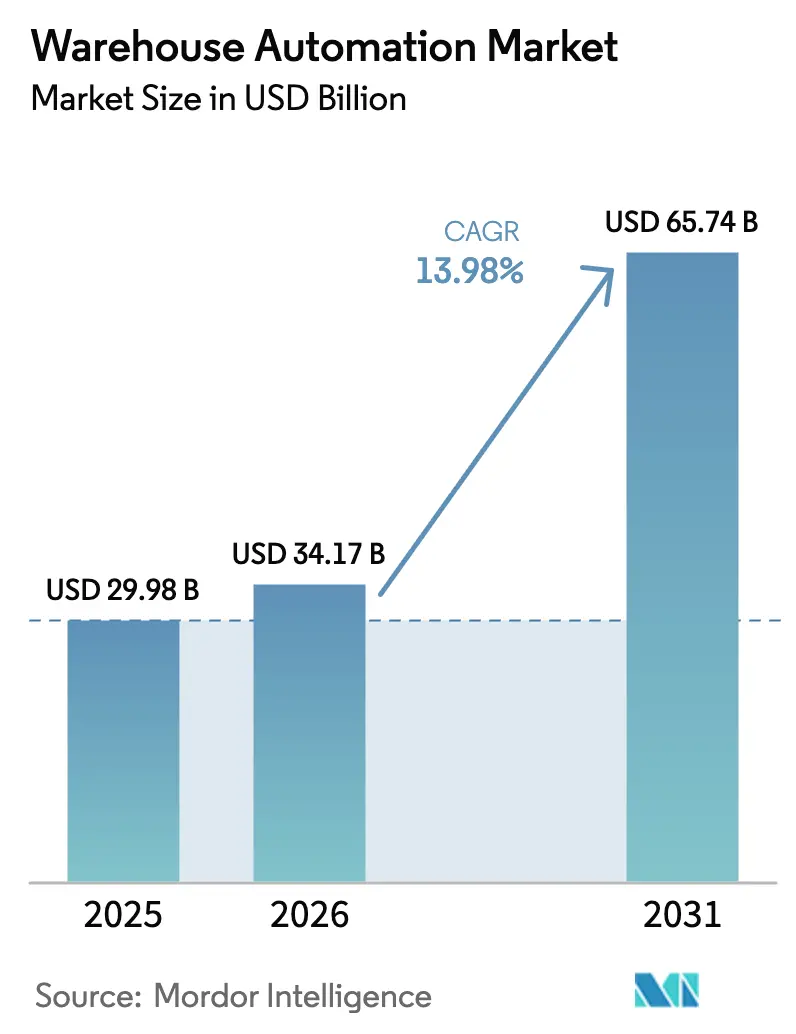
| Market Size (2026) | USD 34.17 Billion |
| Market Size (2031) | USD 65.74 Billion |
| Growth Rate (2026 - 2031) | 13.98% CAGR |
| Fastest Growing Market | Asia-Pacific |
| Largest Market | North America |
| Market Concentration | Medium |
Major Players
*Disclaimer: Major Players sorted in no particular order Image © Mordor Intelligence. Reuse requires attribution under CC BY 4.0. |
|
Warehouse Automation Market Analysis by Mordor Intelligence
The Warehouse Automation Market size is expected to increase from USD 29.98 billion in 2025 to USD 34.17 billion in 2026 and reach USD 65.74 billion by 2031, growing at a CAGR of 13.98% over 2026-2031. Persistent labor shortages, rising urban last-mile expectations, and rapid returns on plug-and-play robotics, rather than cyclical e-commerce spikes, anchor this growth trajectory. Structural wage inflation in logistics, coupled with shrinking delivery windows, forces operators to substitute capital for labor while prioritizing systems that can be re-configured in days instead of months. Subscription-based robotics models accelerate adoption by converting capital outlays into operating expenses, allowing mid-tier firms to deploy fleets that once required investment-grade credit. Energy-efficiency regulations in Europe and North America add another tailwind, because most retrofits bundle automation with LED lighting, solar canopies, and regenerative-braking conveyors to satisfy ESG scorecards. Competitive intensity is rising as modular platform providers undercut incumbent integrators on speed-to-value, pushing vendors to marry hardware with cloud-native orchestration software and predictive maintenance analytics.
Key Report Takeaways
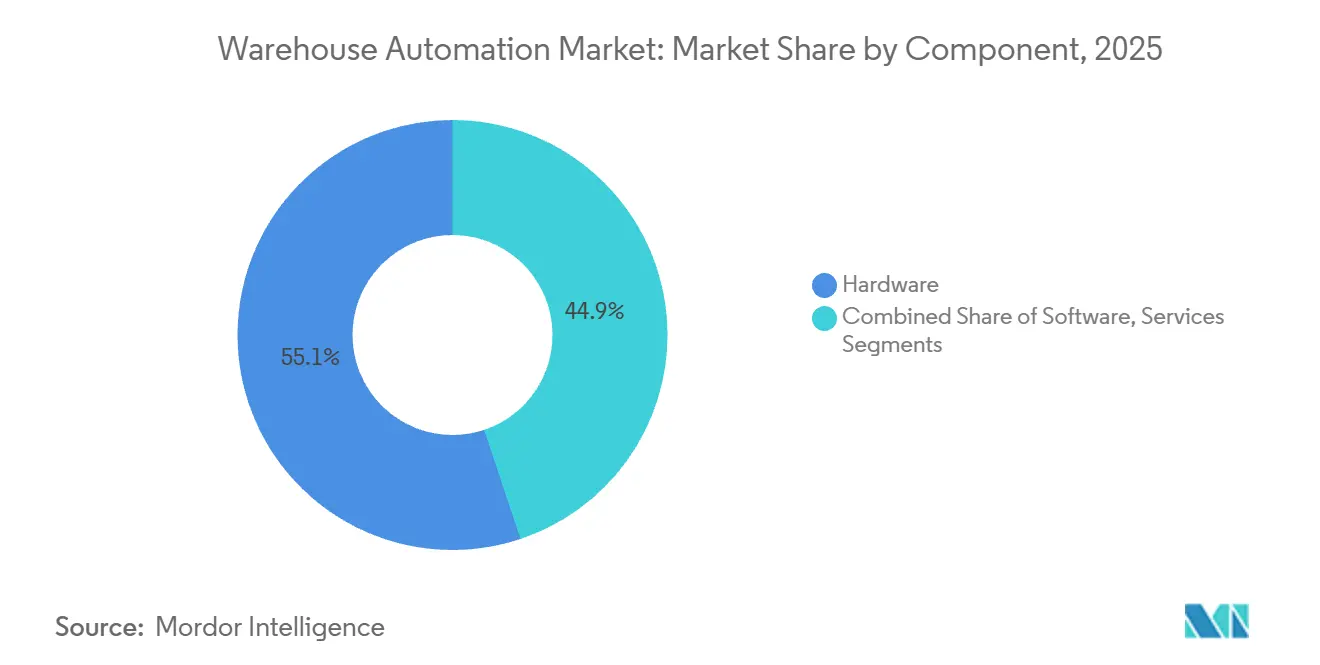
- By component, hardware led with 55.12% revenue share in 2025, while software is set to expand at a 14.87% CAGR through 2031.
- By technology, mobile robots captured 41.36% of warehouse automation market share in 2025; piece-picking robots are forecast to post the fastest 15.27% CAGR to 2031.
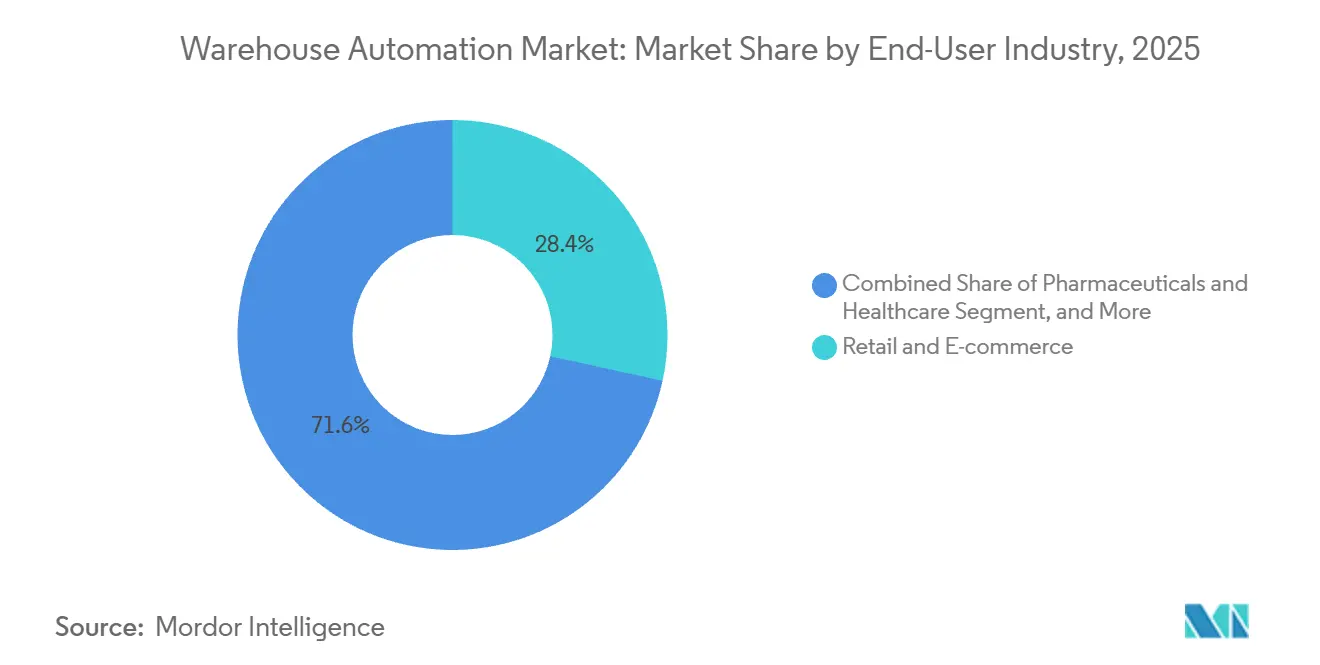
- By end-user industry, retail and e-commerce held 28.41% of spending in 2025, whereas pharmaceuticals and healthcare will advance at a 14.73% CAGR through 2031.
- By warehouse size, medium-sized facilities accounted for 36.78% of revenue in 2025; small sites under 50,000 square feet will grow at a 15.19% CAGR through 2031.
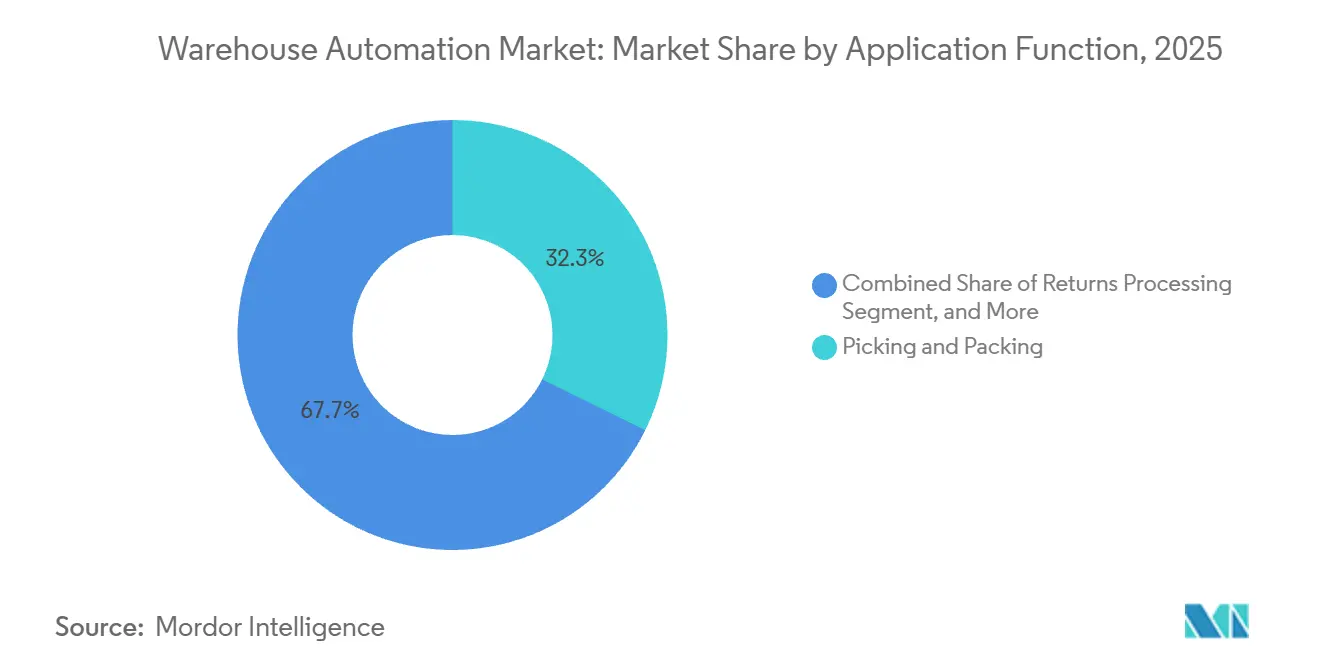
- By application function, picking and packing led with 32.31% share in 2025, while returns processing will accelerate at a 14.19% CAGR through 2031.
- By ownership model, third-party logistics providers held 38.96% of spending in 2025, and government and defense installations will show a 14.16% CAGR through 2031.
- By geography, North America commanded 35.51% revenue in 2025, and Asia-Pacific is expected to rise at a 15.91% CAGR through 2031.
Note: Market size and forecast figures in this report are generated using Mordor Intelligence’s proprietary estimation framework, updated with the latest available data and insights as of January 2026.
Global Warehouse Automation Market Trends and Insights
Drivers Impact Analysis*
| Driver | (~) % Impact on CAGR Forecast | Geographic Relevance | Impact Timeline |
|---|---|---|---|
| E-commerce Boom and Last-Mile Expectations | +2.8% | Global, with concentration in North America, Europe, and Asia-Pacific urban clusters | Short term (≤ 2 years) |
| Labor Shortages and Rising Wage Inflation | +3.1% | North America and Europe core, spillover to Australia and high-wage ASEAN markets | Medium term (2-4 years) |
| Rapid ROI from Plug-and-Play AMR and AGV Fleets | +2.5% | Global, with early adoption in North America, Europe, and Japan | Short term (≤ 2 years) |
| Robotics-as-a-Service Lowering Cap-Ex Hurdles | +1.9% | Global, particularly benefiting mid-tier operators in North America, Europe, and emerging Asia-Pacific markets | Medium term (2-4 years) |
| ESG-Linked Energy-Efficiency Mandates | +1.6% | Europe leading, followed by North America and select Asia-Pacific jurisdictions | Long term (≥ 4 years) |
| Reshoring-Driven Mega-Hubs Needing High-Density Automation | +2.2% | North America (United States and Mexico), Europe (Central and Eastern Europe), and select Asia-Pacific manufacturing corridors | Long term (≥ 4 years) |
| Source: Mordor Intelligence | |||


E-commerce Boom And Last-Mile Expectations
Quarterly U.S. e-commerce sales reached USD 310.3 billion in Q3 2025, but the strategic hinge lies in compressing order-to-door intervals to two hours or less. Retailers now locate inventory within 10 miles of demand clusters, fragmenting networks into micro-fulfillment nodes that cannot house traditional conveyor grids.[1]U.S. Census Bureau, “Quarterly Retail E-Commerce Sales, 3rd Quarter 2025,” census.gov Vertical shuttle arrays and tote-retrieval robots reclaim floor area, processing 500-1,000 orders per hour from footprints under 20,000 square feet. Last-mile economics therefore reward capital intensity over labor flexibility, reversing the historic low-automation model. Grocery and quick-commerce operators lead adoption by repurposing retail basements and parking decks into automated hubs that bypass zoning constraints on new industrial builds.
Labour Shortages And Rising Wage Inflation
Logistics wages in North America advanced 3.8% over the twelve months ending September 2025, eclipsing the 3.6% average for all civilian workers, while voluntary turnover slid below 2%. Autonomous mobile robot fleets priced at USD 2,000–4,000 per unit per month reach payback in as little as 12 months, effectively replacing 2.5–3 full-time equivalents per robot. Operators in Scandinavia, Switzerland, and urban Japan now automate cross-docking and kitting because the opportunity cost of unfilled jobs outweighs capital risk. Wage-driven automation also neutralizes the labor cost edge once enjoyed by mid-tier U.S. cities, homogenizing fulfillment economics regionally.
Rapid ROI From Plug-And-Play AMR And AGV Fleets
Return on investment periods of 12–24 months align with annual budgeting cycles, eliminating multi-year approval hurdles. Floor-agnostic navigation allows robots to be redeployed across buildings during seasonal peaks, and pilot fleets of 10 units can scale to triple digits without layout redesign. Vendors such as Locus Robotics bundle hardware, software, and maintenance into fixed monthly fees, turning automation into a tactical lever akin to hiring temporary labor. Consequently, small and mid-sized operators now treat robots as variable capacity rather than immovable assets, enhancing resilience during demand spikes.
Robotics-As-A-Service Lowering Cap-Ex Hurdles
Subscription pricing shifts capital risk to vendors and lets operators ramp fleets up or down with 30–90 day notice. Providers assume maintenance and software updates, cutting total cost of ownership by up to 30% compared with outright purchase. The model also democratizes advanced automation for regional 3PLs and emerging-market firms that lack investment-grade credit, shrinking the technology gap between tier-one and tier-two operators. Liability frameworks shaped by ISO 3691-4 prompt vendors to carry product-liability insurance, making RaaS contracts attractive even for risk-averse industries.
Restraints Impact Analysis*
| Restraint | (~) % Impact on CAGR Forecast | Geographic Relevance | Impact Timeline |
|---|---|---|---|
| High Upfront CapEx and Long Payback for Fixed Systems | -2.4% | Global, with acute impact in capital-constrained emerging markets and mid-tier operators | Medium term (2-4 years) |
| Legacy IT and WMS Integration Complexity | -1.8% | Global, particularly affecting operators with monolithic ERP systems in North America and Europe | Short term (≤ 2 years) |
| Cyber-Security Vulnerabilities of Connected Devices | -1.3% | Global, with heightened concern in regulated industries and critical infrastructure sectors | Medium term (2-4 years) |
| Stricter Li-ion Battery Fire-Safety Regulations for AMRs | -1.1% | North America and Europe leading, with spillover to Asia-Pacific jurisdictions adopting NFPA and UL standards | Short term (≤ 2 years) |
| Source: Mordor Intelligence | |||
High Upfront Capex And Long Pay-Back For Fixed Systems
A single aisle of crane-based automated storage can exceed USD 2 million, with payback stretching beyond five years if throughput misses design targets by 15%–20%. Such capital intensity bifurcates the market into incumbents able to finance greenfield mega-hubs and challengers confined to mobile robots. The risk rises in apparel and consumer electronics, where SKU volatility renders fixed systems inflexible because re-configuring crane heights may require multi-week shutdowns. Consequently, mid-tier operators favor modular solutions that preserve optionality, even when long-run efficiency is lower than purpose-built conveyor grids.
Legacy IT And WMS Integration Complexity
Many WMS platforms written in the early 2000s lack modern APIs, forcing middleware bridges that add latency and single points of failure. Integration projects often overrun budgets by 30% and timelines by up to 12 months, delaying automation returns. Operators postpone robotics deployments until ERP refreshes, opening multi-year windows in which competitors leapfrog their capabilities. Cloud-native execution systems promise weekly release cycles, but data-cleansing and parallel-run requirements divert scarce IT resources, further stretching project schedules.[2]Manhattan Associates, “Warehouse Management and Execution Systems,” manhattanassociates.com
*Our forecasts treat driver/restraint impacts as directional, not additive. The impact forecasts reflect baseline growth, mix effects, and variable interactions.
Segment Analysis
By Component: Software Orchestration Outpaces Hardware Deployments
Software revenue is projected to post a 14.87% CAGR between 2026 and 2031, even though hardware controlled 55.12% of spending in 2025. Operators deploy cloud-native execution layers that lift throughput by 15% to 25% from existing conveyors, favoring code updates that arrive weekly over physical retrofits that can idle docks for days. Subscription pricing folds maintenance and analytics into the license, cutting unscheduled downtime 30% and trimming service truck rolls. Venture capital follows the margin profile, pushing software firms to acquire niche workflow applications and bundle them into unified orchestration suites.
Hardware remains vital for greenfield mega-hubs exceeding 500,000 square feet, where custom conveyors and high-bay cranes amortize efficiently across 20-year leases. Services revenue concentrates in brownfield projects that need installers to work overnight shifts and avoid order-cutoff disruption. Mobile robot suppliers now preload fleet software that self-calibrates on arrival, limiting integrator hours and shifting profit pools from wrench work to data services. The net result is a gradual migration of spending toward software while hardware remains the anchor in high-throughput facilities, preserving balance within the overall warehouse automation market.


By Technology: Piece-Picking Robots Redefine Item-Level Handling
Piece-picking robots are forecast to grow at 15.27% CAGR because new grippers and vision reduce mis-pick rates below 0.5%. This removes the historical need to restrict robots to the top 20% of fast movers, unlocking automation for apparel, cosmetics, and mixed grocery orders. Autonomous mobile robots, which captured 41.36% of 2025 spend, now integrate with pick arms to create end-to-end goods-to-robot loops that shrink travel by 70%.
Automated storage and retrieval systems retain a stronghold in cold chain sites where ±2°C accuracy is mandatory, while conveyor and sortation equipment dominates parcel hubs running 10,000 units per hour. Automatic identification and data capture equips every technology layer with real-time inventory truth, feeding orchestration engines that choose the optimal robot for each task. Together these advances expand the warehouse automation market share held by advanced robotics within multi-technology system sales.
By End-User Industry: Pharmaceuticals Demand Serialization And Cold-Chain Rigor
Pharmaceuticals and healthcare will log the fastest 14.73% CAGR because the Drug Supply Chain Security Act and EU serialization rules require unit-level scanning at every handoff.[3]U.S. Food and Drug Administration, "Good Distribution Practices for Medical Devices," fda.gov Operators add zone-controlled shuttle systems, backup chillers, and redundant power to satisfy audits. These compliance-driven projects often bundle vision inspection and weight verification to eliminate manual checks that carry 0.1% to 0.5% error rates.
Retail and e-commerce, holding 28.41% of 2025 spend, matures toward a replacement cycle in which firms swap older conveyors for software that cuts dwell time without adding square footage. Apparel brands test soft-goods grippers that avoid fabric snags, while food and beverage facilities deploy wash-down robots that meet sanitation codes. This diversity of needs sustains broad demand across the warehouse automation market.
By Warehouse Size: Small Facilities Embrace Modular Micro-Fulfillment
Small sites under 50,000 square feet will grow at a 15.19% CAGR as retailers chase two-hour delivery cutoffs in dense cities. Cubic storage grids and rack-climbing robots pack 400-600 bins per 1,000 square feet, letting operators repurpose basements and old retail boxes. These projects often recoup investment in under three years because transportation savings offset premium urban rents.
Medium facilities between 50,000 and 200,000 square feet retained 36.78% revenue in 2025, balancing SKU breadth and trucking efficiency. Mega-hubs still pursue fixed cranes where volume justifies 20-year payback windows, yet their relative slice of the warehouse automation market size is easing as capital shifts toward proximity nodes that trim last-mile miles.
By Application Function: Returns Processing Gains Strategic Priority
Returns processing is expected to advance at 14.19% CAGR, reflecting recommerce growth and extended producer responsibility laws. Vision stations grade inbound items in seconds, while rule engines decide repair, recycle, or restock paths. Faster triage frees working capital and reduces markdowns on seasonal goods.
Picking and packing still accounted for 32.31% of 2025 spend and remains the cost-center focus in large e-commerce sites. Automation penetration exceeds 50% in many hubs, so operators now refine pick path software rather than add conveyors. Inbound receiving, storage, and outbound loading see incremental robotics that fill labor gaps during peak season without expanding permanent headcount.
By Ownership Model: Government And Defense Modernize Strategic Stockpiles
Government and defense installations are projected to grow at a 14.16% CAGR because pandemic stockpile gaps exposed manual count delays. RFID portals and mobile shuttles now feed real-time dashboards that commanders query during crisis drills. Budget approvals accelerate when readiness metrics improve, allowing sole-source fast tracks that bypass multiyear tender cycles.
Third-party logistics providers, holding 38.96% spend in 2025, pursue flexible automation they can redeploy among client contracts. E-commerce pure plays plateau as they outgrow single-tenant megacenters and lean on 3PL partners for surge capacity. Company-owned warehouses invest steadily but avoid speculative footprints, preserving a balanced demand stream across the warehouse automation industry.
Geography Analysis
North America held 35.51% of revenue in 2025, anchored by the United States and Mexico’s nearshoring boom. The region added 500 million square feet of warehouses from 2020-2024, but growth cools as large-site penetration peaks. Mexico attracted USD 20 billion in nearshoring investment during 2024-2025, spawning automated hubs in Monterrey and the Bajío region to synchronize manufacturing with U.S. demand. Canada focuses on cold-chain automation around Toronto and Vancouver to support pharmaceutical and grocery fulfillment.
Asia-Pacific will expand at a 15.91% CAGR, the fastest globally. China targets 70% automation penetration in tier-one city logistics parks by 2030 under its smart-logistics guidelines. Japan counters a shrinking labor pool by subsidizing robotics, despite 15%-20% higher costs for seismic compliance. India’s GST reforms foster mega-hubs, while Australia automates export-oriented cold chains.
Europe remains a mature stronghold yet faces regulatory capex diversion as the Energy Performance of Buildings Directive mandates retrofits before capacity additions. Middle East and Africa adoption centers on UAE and Saudi Arabia free zones, whereas South America battles currency volatility that inflates imported equipment costs by up to 50%.


Regulatory Landscape
Warehouse automation deployments fall under a tightening mix of machinery safety, workplace safety, and AI governance requirements that shape how AMRs, AS/RS, conveyors, and the software that coordinates them are designed and commissioned. In the United States, OSHA continues enforcement focus on warehousing and distribution center operations through its National Emphasis Program, keeping attention on powered industrial trucks, machine guarding, and ergonomics that affect facility automation layouts and rollout.
In Europe, the EU Machinery Regulation (EU) 2023/1230 replaces the Machinery Directive and applies from January 2027, increasing conformity and documentation expectations for safety components, including those that use AI. Standards activity adds another compliance layer: ISO 10218-2:2025 updates safety requirements for industrial robot applications and cells, while IEC PAS 63277:2026 (published June 2026) sets safety and interoperability protocols relevant to warehouse robotics. Together, these standards influence CE and UKCA strategies, notified-body engagement, and procurement requirements for traceability from hazard analysis through validation.
Value Chain Analysis
The value chain starts with upstream components and sub-systems (industrial-grade microcontrollers and sensors, Li-ion battery packs and BMS, drives, safety scanners, conveyors and shuttles, and grippers), then moves to OEMs and platform vendors supplying mobile robots, AS/RS, sortation, and AIDC devices. System integrators and software providers (WES/WCS layers and cloud orchestration) configure, simulate, integrate with WMS/ERP, and commission solutions, while service partners handle lifecycle support such as spares, on-site maintenance, uptime guarantees, and software updates.
On the demand side, retailers and e-commerce operators, 3PLs, manufacturers, and regulated sectors such as pharmaceuticals set requirements for unit-level scanning and auditability, which feeds into automation specifications. Bottlenecks concentrate in electronics availability and compliance-driven materials qualification, which can stretch project schedules and shift buyer preferences toward modular deployments that bring software orchestration online ahead of hardware phases. The constraint shows up in longer lead-time ranges for AS/RS in 2026 and in software's growing role in raising throughput on existing assets. Large operators such as Amazon also highlight next-generation mobile robotics in live fulfillment environments, for example Proteus showcased in the United Kingdom in June 2026, illustrating how scale buyers can pull innovation from R&D through production validation and rollout.
Competitive Landscape
The competitive field shows moderate concentration because the ten largest vendors hold roughly half of global revenue. Incumbents such as Dematic, Daifuku, and Swisslog leverage extensive service networks and long-running OEM ties to secure multi-year automotive and pharmaceutical contracts that demand uptime above 99.9%. Disruptors including AutoStore, Exotec, and Symbotic win small-format and retrofit projects by delivering go-live timelines under eight weeks and charging by throughput, not hardware.
Intellectual-property activity is rising quickly. United States Patent and Trademark Office data indicates a 40% increase in robotics and vision filings from 2023-2025, centered on gripping mechanics, sensor fusion, and motion planning. Vendors use these patents both defensively and as licensing assets that open secondary revenue streams. Software-rich platforms command gross margins above 50%, attracting private equity that funds aggressive geographic expansion through local assembly plants and service outposts.
Strategic moves in 2025-2026 pivot around portfolio breadth and regional manufacturing. Daifuku’s EUR 80 million (USD 92.77 million) software acquisition extends orchestration depth, while Dematic’s USD 150 million Michigan plant trims North American lead times by a third. Symbotic’s USD 300 million capital raise will finance its second U.S. factory and new Asia-Pacific service hubs. Together, these initiatives illustrate how scale, software capability, and local production underpin competitive advantage in the warehouse automation market.
Warehouse Automation Industry Leaders
-
Dematic Group (Kion Group AG)
-
Daifuku Co. Limited
-
Swisslog Holding AG (KUKA AG)
-
Jungheinrich AG
-
Honeywell Intelligrated
- *Disclaimer: Major Players sorted in no particular order


Market Opportunities and Future Outlook
Brownfield modernization and software-led orchestration create whitespace for operators seeking faster benefits without multi-year rebuilds, especially in medium and small facilities focused on picking, packing, and returns processing. Platform layers that coordinate heterogeneous fleets (AMRs, shuttles, sortation, and AIDC) and provide audit-ready process traceability align with regulated end users and with operators constrained by integration requirements from legacy WMS environments. This supports demand for vendor-agnostic analytics, simulation, and execution software as a purchase driver alongside hardware.
Visible capital programs also point to near-term addressable expansion around automated distribution centers and robotics-equipped nodes across regions. In March 2026, A.P. Moller - Maersk opened World Gateway II in Singapore as a fully automated global and regional distribution center featuring Multi-Shuttle systems, AS/RS, and autonomous case-handling robots, indicating deeper automation penetration in 3PL-led networks. Retail and fulfillment operators continue to industrialize robotics deployments in new builds and retrofits, including Amazon Australia announcing a robotics-equipped fulfillment center investment in Queensland (March 2026) and Lululemon operationalizing an AutoStore installation with 525 robots in Brampton, Ontario (June 2026). These announcements support opportunities in scalable goods-to-person systems, high-density storage, and lifecycle services.
Recent Industry Developments
- June 2026: Dematic partnered with Pattison Food Group to automate a 485,000-square-foot grocery fulfillment center in Langley, British Columbia, using Dematic RapidPick and Multishuttle systems. The project highlights continued investment in high-throughput grocery automation and reinforces shuttle-based AS/RS as a core design choice for dense SKU profiles. It also strengthens Dematic's position in North American food retail and e-commerce fulfillment programs.
- April 2026: Honeywell introduced the Intelligrated Momentum Core warehouse software platform and the IntelliSort Irregulars Sorter for handling non-conveyable parcels. The launch expands Honeywell's ability to sell software and sortation as a combined stack, addressing a common pain point in parcel networks where irregular items reduce line efficiency. It also increases competitive pressure on integrators to bundle orchestration and exception-handling into standard deployments.
- January 2024: KION Group opened a new automated warehouse automation center in Italy, investing over USD 25 million to expand capabilities in AMR integration, sortation, and WMS/WCS orchestration. The project signals a deeper commitment to European consolidation of robotics solutions.


Research Methodology Framework and Report Scope
Market Definition and Coverage
We size warehouse automation as the revenue generated from equipment, control systems, and integrated software that automate how inventory moves into, within, and out of warehouses and distribution centers.
Scope exclusions: We exclude stand-alone WMS sold without associated material-handling hardware and any warehouse building or civil construction work.
Segmentation Overview
-
By Component
- Hardware
- Software
- Services
-
By Technology
- Mobile Robots (AGV, AMR)
- Automated Storage and Retrieval Systems (AS/RS)
- Conveyor and Sortation Systems
- Palletizing / Depalletizing Robotics
- Piece-Picking Robots
- Automatic Identification and Data Collection (AIDC)
-
By End-User Industry
- Food and Beverage
- Post and Parcel
- Retail and E-commerce
- Apparel and Footwear
- Manufacturing (Durable and Non-Durable)
- Pharmaceuticals and Healthcare
- 3PL / Contract Logistics
- Other End-User Industries
-
By Warehouse Size
- Small (Less than 50 k sq ft)
- Medium (50-200 k sq ft)
- Large (200-500 k sq ft)
- Mega (More than 500 k sq ft)
-
By Application Function
- Inbound Handling
- Storage and Buffering
- Picking and Packing
- Sorting and Consolidation
- Outbound Loading
- Returns Processing
-
By Ownership Model
- Company-Owned Warehouses
- 3PL / Contract Warehouses
- E-commerce Pure-Plays
- Government / Defence
-
By Geography
-
North America
- United States
- Canada
- Mexico
-
South America
- Brazil
- Argentina
- Chile
- Rest of South America
-
Europe
- Germany
- United Kingdom
- France
- Italy
- Spain
- Netherlands
- Russia
- Rest of Europe
-
Asia Pacific
- China
- Japan
- South Korea
- India
- ASEAN
- Australia
- New Zealand
- Rest of Asia Pacific
-
Middle East
- GCC
- Turkey
- Israel
- Rest of Middle East
-
Africa
- South Africa
- Nigeria
- Kenya
- Rest of Africa
-
North America
Data Sources, Market Sizing, and Validation
Desk Research
Desk work starts by mapping demand signals for warehousing activity and the practical triggers for automation spend, and then linking those signals to the technologies counted in this market. Public sources such as the US Census Bureau (wholesale, retail, and e-commerce activity), the US Bureau of Labor Statistics (wages and labor availability), Eurostat (logistics and industry indicators), and UN Comtrade trade flows (material-handling and automation-related equipment categories) help us frame the pace of warehouse expansion and modernization.
We also review sources such as the International Federation of Robotics for context on robotics adoption, plus company annual reports, investor decks, and reputable press to understand product mix shifts and backlog behavior. Where needed, we use paid subscriptions for selected company financials and shipment-level import-export databases to cross-check supplier exposure and trade movements by major equipment categories. These examples are not exhaustive, and many other public and paid sources were also referenced for data collection, validation, and clarification.
Primary Interviews and Surveys
Primary inputs are collected through expert interviews and structured surveys with automation solution providers, material-handling integrators, warehouse operators, and logistics service teams, so we can confirm what is being bought and how projects are priced. Coverage is kept global across mature and fast-growing warehouse regions, and the interviews help refine gaps around ASP movement, typical deployment footprints, and the split between new sites and retrofit projects.
Distribution of primary research fieldwork respondents
| Company type | Respondent position | Region |
|---|---|---|
| Top tier: 33% | CXOs: 13% | APAC: 40% |
| Mid tier: 51% | Functional/Unit leaders: 34% | EMEA: 33% |
| Smaller Players: 16% | Managers: 53% | Americas: 27% |
Market-Sizing & Forecasting
The core build uses a top-down approach where warehouse activity and automation adoption signals are converted into an addressable spend pool, then filtered by what technologies are counted in scope. To keep the estimate grounded, we corroborate the totals with selective bottom-up approximations, such as sampled system ASPs multiplied by shipment and installation volumes for key equipment groups, and we cross-check these using channel checks with integrators.
Inputs used in the model include the pace of e-commerce fulfillment expansion, labor cost pressure in warehousing, average project size by facility type, replacement and upgrade cycles for conveyors and sorters, and the adoption curve for mobile robots and AS/RS in new versus retrofit sites. Where a variable is not available consistently by country, we bridge the gap using regional ratios validated by interviews, then re-check that the implied spend per warehouse stays realistic. Forecasting is done using scenario analysis anchored on macro demand drivers and industry capacity plans, and then adjusted using expert consensus on lead times, pricing movement, and implementation constraints.
Data Validation & Update Cycle
Outputs are checked against independent signals like trade flows, supplier revenue exposure to warehouse automation, and order trend commentary, before the numbers are finalized. Variance checks are performed across regions and technology groups, so unusually high growth, sudden price steps, or mismatched penetration assumptions are flagged and reviewed in follow-up calls.
Our process includes multi-step analyst reviews, and re-contact is triggered when a major data point shifts, a large project pipeline changes, or a new regulation or labor constraint alters the adoption pattern. Reports are refreshed annually, with interim updates when a material event affects demand or pricing, and a final freshness pass is completed before delivery so clients get the latest view.
Mordor Intelligence's Warehouse Automation Market Sizing Compared With Other Published Estimates
Published market sizes for warehouse automation often vary because the boundaries are not always drawn the same way, and because the revenue counted can shift between hardware, software, and services depending on the author. Timing also matters, since backlogs, installation cycles, and currency conversion choices can move a single-year value by a noticeable amount.
By tracking bundled WMS or WES revenue only when it is attached to a physical automation deployment, Mordor Intelligence keeps the 2026 total tied to systems that directly automate inventory movement, which narrows scope versus broader counts that include stand-alone software or adjacent warehouse digitization spend.
Benchmark comparison
| Source | Market Size | Gaps in Research Methodology |
|---|---|---|
| Mordor Intelligence | USD 34.17 B (2026) | |
| Industry Publisher A | USD 20.19 B (2024) | Uses an earlier base year and does not clearly separate bundled automation software from stand-alone WMS, which can shift what is counted as warehouse automation revenue. |
| Trade Outlet B | USD 21.71 B (2024) | Applies a broader solution set with limited stated exclusions, and the longer forecast window can lean on higher adoption assumptions without the same year-specific installation and pricing checks. |
The spread in the table is mainly explained by scope boundaries, base-year timing, and how software is treated versus equipment. When the counted revenue is anchored to deployable systems, and the year aligns to the same demand cycle, the result becomes easier to trace back to clear variables and repeatable steps.


Key Questions Answered in the Report
What is the current value of the warehouse automation market?
The warehouse automation market size is USD 34.17 billion in 2026.
How fast is warehouse automation spending growing?
Global spending is projected to expand at a 13.98% CAGR, reaching USD 65.74 billion by 2031.
Which technology segment is growing the quickest?
Piece-picking robots are forecast to rise at a 15.27% CAGR because improved vision and gripping now handle varied SKUs.
Why are small urban warehouses automating rapidly?
Facilities under 50,000 square feet require modular systems that fit tight footprints and cut last-mile delivery radii to under 10 miles, supporting same-day service.
What drives automation demand in pharmaceuticals?
Unit-level serialization and strict cold-chain rules compel automated storage and verification systems that minimize human error.
How does robotics-as-a-service change investment decisions?
Subscription pricing converts capital outlays to operating expenses, shortens payback to about 12 months, and lets operators flex robot fleet sizes with demand.
Page last updated on:


