
VR Content Creation Services Market Size and Share
Market Overview
| Study Period | 2020 - 2031 |
|---|---|
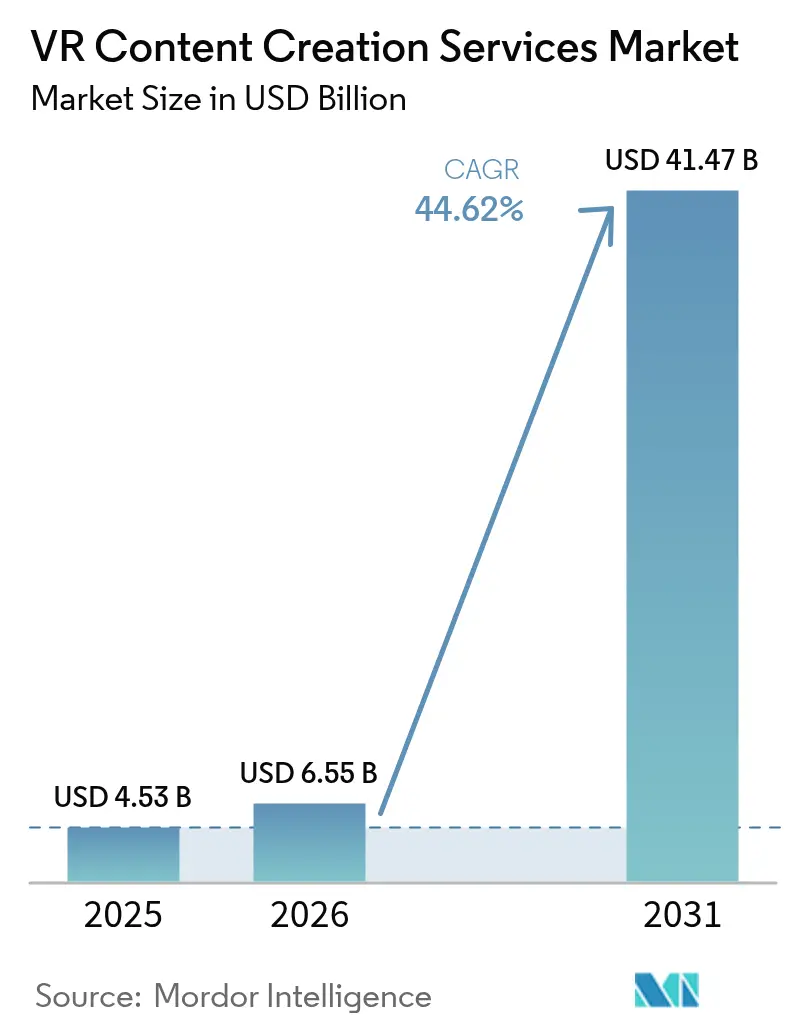
| Market Size (2026) | USD 6.55 Billion |
| Market Size (2031) | USD 41.47 Billion |
| Growth Rate (2026 - 2031) | 44.62 % |
| Fastest Growing Market | Asia-Pacific |
| Largest Market | North America |
| Market Concentration | Medium |
Major Players *Disclaimer: Major Players sorted in no particular order Image © Mordor Intelligence. Reuse requires attribution under CC BY 4.0. | |
VR Content Creation Services Market Analysis by Mordor Intelligence
The VR Content Creation Services market size is expected to grow from USD 4.53 billion in 2025 to USD 6.55 billion in 2026 and is forecast to reach USD 41.47 billion by 2031 at 44.62% CAGR over 2026-2031. Momentum stems from falling headset prices, edge-cloud rendering that smooths latency, and corporate procurement teams treating immersive assets as productivity investments rather than pilots. Intel documented a 300% return on investment for VR soft-skills training, prompting finance departments to green-light higher content budgets. Government incentives across Asia-Pacific now reimburse up to 30% of approved metaverse production costs, widening the commissioning base for small and mid-sized studios. Simultaneously, 5G standalone rollouts enable photorealistic streaming to untethered headsets, unlocking on-the-go enterprise and consumer use cases. Rapid advances in AI-driven procedural asset generation further compress production timelines, supporting double-digit margin expansion for early adopters.
Key Report Takeaways
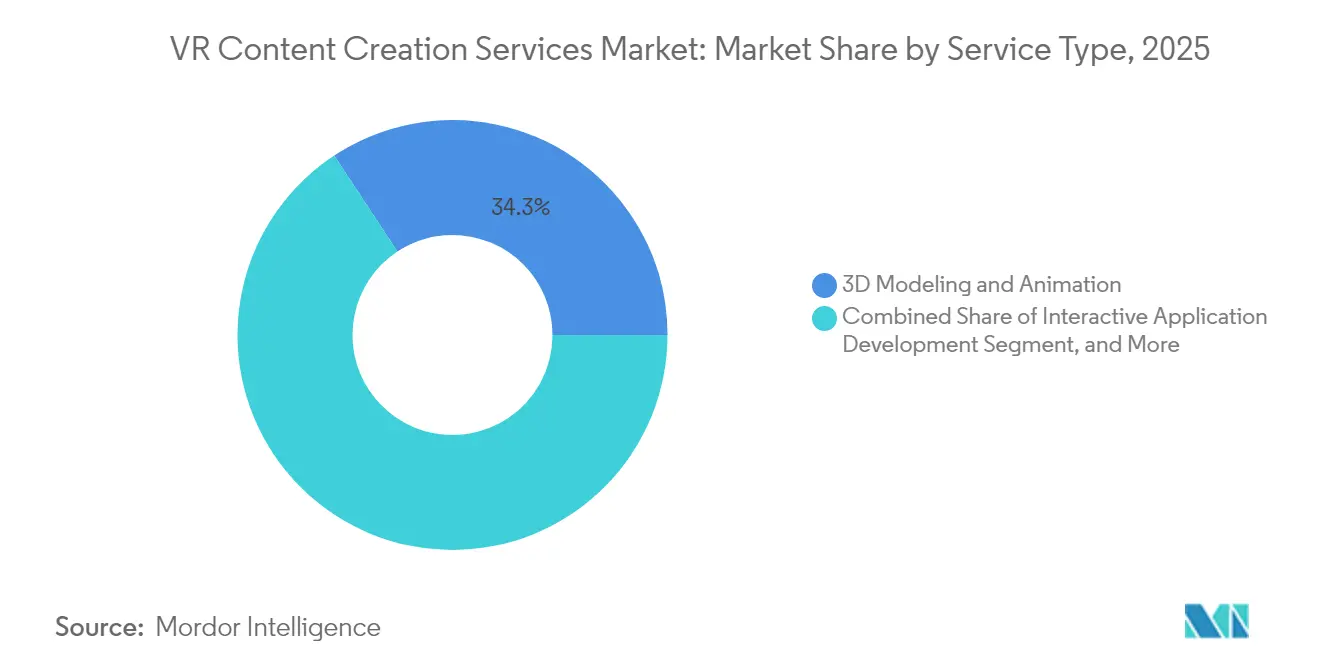
- By service type, 3D modeling and animation led with 34.28% of the VR content creation services market size in 2025, while interactive application development is forecast to expand at a 46.38% CAGR through 2031.
- By content type, entertainment accounted for 41.05% of the VR content creation services market size in 2025, whereas healthcare visualization is projected to advance at a 46.41% CAGR through 2031.
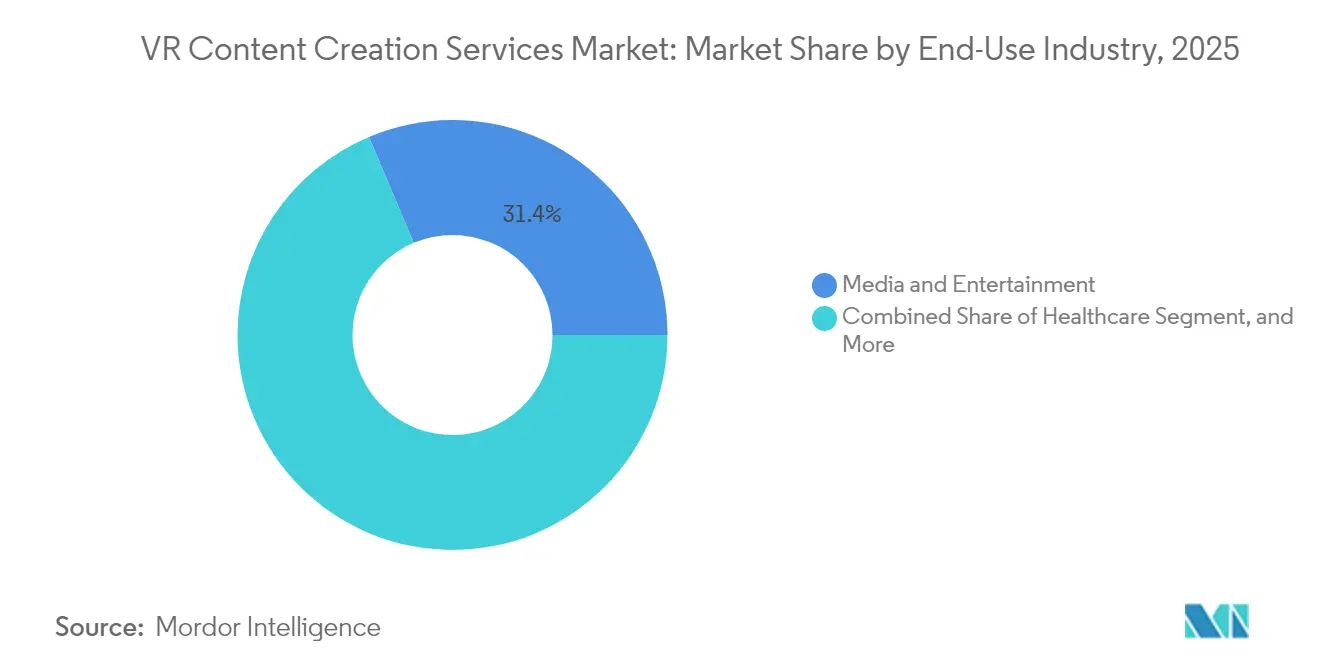
- By end-use industry, the media and entertainment sector held a 31.35% of the VR content creation services market size in 2025, and the healthcare sector is set to grow at a 46.72% CAGR over the forecast period.
- By platform, PC-based VR accounted for 39.12% of the VR content creation services market size in 2025; however, WebXR is poised for a 45.98% CAGR through 2031.
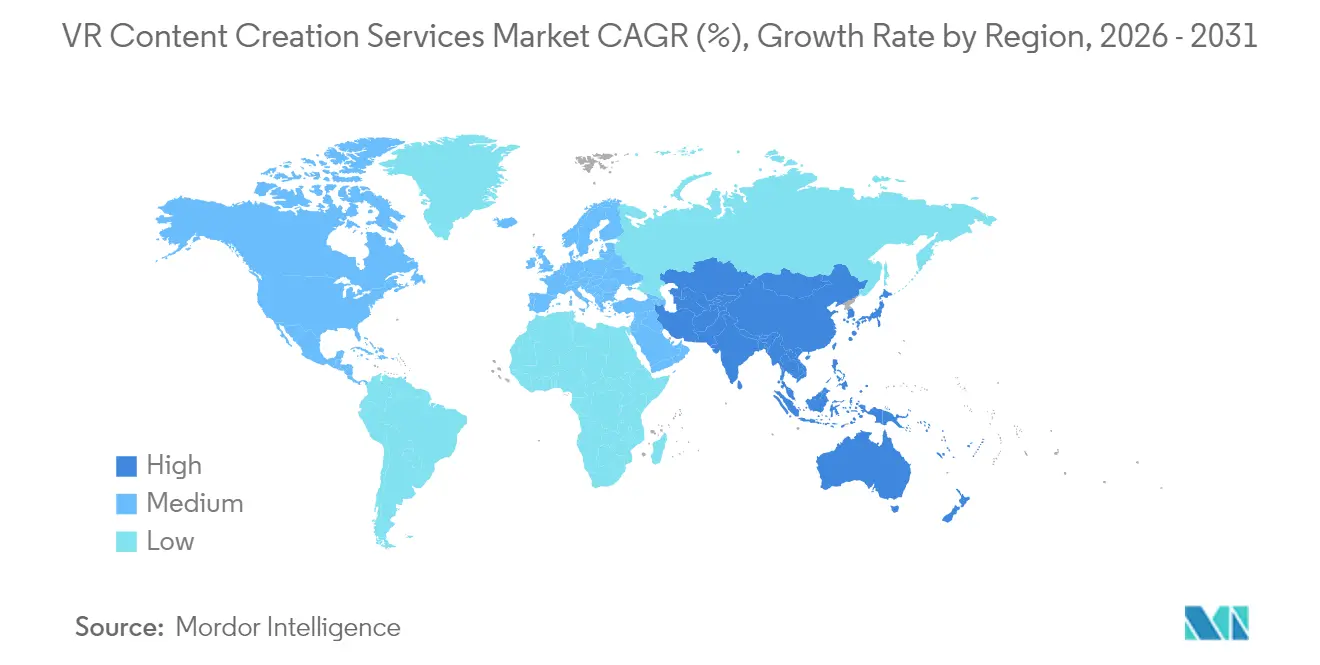
- By geography, North America generated 43.05% of the VR content creation services market size in 2025, while the Asia-Pacific region is expected to post a 46.33% CAGR through 2031.
Note: Market size and forecast figures in this report are generated using Mordor Intelligence’s proprietary estimation framework, updated with the latest available data and insights as of 2026.
Market Trends and Insights
Drivers Impact Analysis of VR Content Creation Services Market*
| Driver | (~) % Impact on CAGR Forecast | Geographic Relevance | Impact Timeline |
|---|---|---|---|
| Proliferation of Affordable 6DoF VR Headsets | +8.2% | Global, strongest in North America and Asia-Pacific | Short term (≤ 2 years) |
| Corporate Upskilling Demand for Immersive Training Modules | +9.1% | North America and Europe, expanding to Asia-Pacific | Medium term (2-4 years) |
| Integration of AI-Driven Procedural Content Generation | +7.8% | Global, early adoption in North America and Europe | Medium term (2-4 years) |
| Expansion of 5G Standalone Networks Enabling Mobile VR Streaming | +7.3% | Asia-Pacific and Middle East, selective North America metros | Medium term (2-4 years) |
| Edge-Cloud Rendering Networks Reducing Latency | +6.5% | Asia-Pacific core, spill-over to Middle East and North America | Long term (≥ 4 years) |
| Government Subsidies for Metaverse Ecosystems in Emerging Asian Markets | +5.9% | China, South Korea, Japan, Singapore | Long term (≥ 4 years) |
| Source: Mordor Intelligence | |||
Proliferation of Affordable 6DoF VR Headsets
Headsets, once priced above USD 1,000, now retail for below USD 500, led by the Meta Quest 3, which shipped 2.4 million units in 2024.[1]Meta Platforms, “Meta Quest 3 Product Specifications,” META.COM Apple Vision Pro carved out a premium enterprise tier at USD 3,499, encouraging studios to bid on higher-margin photorealistic projects. A larger installed base lets platform holders offer seat-based licensing, lowering the threshold for corporate training programs.
Corporate Upskilling Demand for Immersive Training Modules
It is expectecd that VR learners completed soft-skills courses more faster than classroom cohorts and reported 275% greater confidence.[2]PricewaterhouseCoopers, “VR Training Effectiveness Study 2024,” PWC.COM Walmart rolled out VR Academies to 4,700 stores, while Boeing cut 737 MAX wiring-harness training time by 75%. Quantified time savings justify multi-year content contracts that underpin the VR Content Creation Services market.
Integration of AI-Driven Procedural Content Generation
Platforms such as Unity Muse and Epic Games' Unreal Engine 5.4 auto-generate 3D meshes and dialogue trees, reducing manual modeling hours by 60%. Stanford’s VRCopilot prototype achieved 85% approval from designers for AI-assembled scenes.[3]Stanford University, “VRCopilot Research Prototype,” STANFORD.EDU Faster workflows enable boutique studios to compete for enterprise bids that were once reserved for large post-production houses.
Expansion of 5G Standalone Networks Enabling Mobile VR Streaming
3GPP Release 17 guarantees sub-10 millisecond motion-to-photon latency for XR traffic. China Mobile deployed 200 private 5G networks for location-based entertainment in 2024. Verizon and AWS edge trials demonstrated 90+ FPS cloud-rendered VR in U.S. metro zones. Always-connected streaming shifts content economics from one-off sales to recurring subscriptions.
Restraints Impact Analysis of VR Content Creation Services Market*
| Restraint | (~) % Impact on CAGR Forecast | Geographic Relevance | Impact Timeline |
|---|---|---|---|
| High Cost of Photorealistic Content Production Pipelines | -4.7% | Global, most acute in North America and Europe | Short term (≤ 2 years) |
| Fragmented Platform Standards Hindering Asset Reusability | -3.9% | Global, with highest friction in multi-device enterprise fleets | Medium term (2-4 years) |
| Motion Sickness and User-Safety Concerns Limiting Session Duration | -3.2% | Global consumer markets, pronounced in gaming and entertainment hubs | Short term (≤ 2 years) |
| Talent Shortage of Advanced Game-Engine Developers | -2.8% | North America and Europe, emerging in Asia-Pacific | Medium term (2-4 years) |
| Source: Mordor Intelligence | |||
High Cost of Photorealistic Content Production Pipelines
Volumetric capture stages exceed USD 1 million in capital expenditure, and cinematic projects at firms such as Framestore often require USD 500,000 to USD 2 million per deliverable. Real-time ray-traced rendering doubles cloud costs compared with flat video, pricing small enterprises out of bespoke experiences.
Fragmented Platform Standards Hindering Asset Reusability
OpenXR enhances baseline portability; however, Apple Vision Pro relies on RealityKit, and PlayStation VR2 requires separate shader optimization. Studios must maintain four or more asset pipelines, which can inflate development costs by up to 50% and force many buyers to standardize on a single platform.
*Our forecasts treat driver/restraint impacts as directional, not additive. The impact forecasts reflect baseline growth, mix effects, and variable interactions.
VR Content Creation Services Market Segment Analysis
By Service Type:
Interactive Applications Outpace Static AssetsInteractive application development is projected to grow at a 46.38% CAGR, eclipsing static 3D modeling’s 34.28% 2025 share. Corporations are increasingly requesting branching logic, physics-based simulations, and multi-user collaboration, thereby elevating the complexity of software engineering. Unity reported that 68% of enterprise projects now incorporate interactivity, up from 42% in 2022. AI-powered asset generators enable artists to focus on gameplay logic, reinforcing this trend.
3D modeling remains foundational, yet margin pressure rises as tools like Infinigen automate the creation of background props. 360-degree video production has evolved into a niche live-event broadcasting, while post-production services are being commoditized amid the expansion of Adobe Premiere VR toolsets. Studios with Unreal Engine expertise command premium rates, but talent shortages persist as animation veterans retrain on game-engine workflows.


By Content Type:
Healthcare Visualization Surges on Clinical ValidationEntertainment retained a 41.05% share in 2025, benefiting from the extension of blockbuster intellectual property. The VR Content Creation Services market size for healthcare visualization is forecast to expand at a 46.41% CAGR, driven by FDA Digital Health initiatives that endorse the use of VR for surgical planning. Johns Hopkins reported a 38% cut in operating-room time after VR rehearsal for complex orthopedic surgeries.
Training and simulation secure steady defense contracts, while marketing applications leverage immersive showrooms from automakers such as Audi and BMW. Architecture tours are continuing to build momentum post-pandemic, thanks to Matterport’s spatial data platform. Education adoption lags due to budget constraints, but receives incremental boosts from STEM grants.
By End-Use Industry:
Media Dominates, Healthcare AcceleratesMedia and entertainment captured 31.35% of 2025 spending, driven by streaming platforms commissioning immersive concerts and documentaries. Healthcare is forecast to grow at a 46.72% CAGR, propelled by insurer reimbursement for VR-assisted pain therapy. Retail brands utilize VR to shorten product discovery cycles, while manufacturing clients employ immersive training to reduce assembly errors.
Real estate firms are replacing physical model homes with VR previews; Matterport’s Property Intelligence compresses listing preparation time from days to hours. Tourism boards produce destination previews that lift booking conversions. Public-sector uptake encompasses law enforcement de-escalation drills and municipal planning visualizations.
By Platform:
WebXR Gains as Friction DropsPC-based VR led with 39.12% share in 2025, favored for high-fidelity engineering workflows. WebXR is forecast to have a 45.98% CAGR, thanks to W3C standards that enable one-click browser access. Mozilla’s Wolvic added hand-tracking support, and Wonderland Engine cut bundle sizes below 5 MB, enabling three-second loads on 4G.
Mobile VR thrives on Meta Quest's convenience, although its graphics fidelity lags behind that of PC rigs. Console VR remains gaming-centric, with Sony’s exclusive-title strategy slowing content diversification. WebXR’s distribution advantage appeals to marketing clients; however, inconsistent eye-tracking support limits its adoption for advanced analytics applications.
Geography Analysis
North America VR Content Creation Services Market
North America generated 43.05% of global revenue in 2025, supported by Fortune 500 training budgets, Hollywood volumetric capture, and USD 1.2 billion in venture funding for immersive startups. The United States Department of Defense earmarked USD 150 million for VR training in fiscal 2024, underwriting a stable pipeline for simulation providers. Canada’s CAD 25 million (USD 18.5 million) immersive-media fund fosters export-ready productions, while Mexico’s automotive suppliers adopt VR for assembly training.
APAC VR Content Creation Services Market
Asia-Pacific is forecast to post the fastest 46.33% CAGR through 2031. China aims to target CNY 250 billion (USD 35 billion) in metaverse output by 2026, offering tax rebates to content studios. South Korea’s Digital New Deal set aside KRW 220 billion (USD 165 million) for immersive content, and Singapore launched a SGD 30 million (USD 22 million) grant program. Japan funds VR eldercare training under its Society 5.0 vision, while India pilots corporate upskilling programs in tech hubs.
Europe, Middle East and South America VR Content Creation Services Market
Europe benefits from automotive and aerospace digital-twin adoption. Germany’s Fraunhofer Institute collaborates with Siemens and BMW on reviewing VR prototypes. The United Kingdom now offers a 25% creative-industries tax rebate for VR production, and France invests EUR 12 million (USD 13 million) in immersive co-productions. Middle East growth is concentrated in Saudi Arabia and the United Arab Emirates, where sovereign funds are bankrolling mixed-reality tourism. South America remains in its early stages, with Brazil deploying VR showrooms despite bandwidth constraints.

Regulatory Landscape
Regulation affecting VR content creation services is converging around platform governance, user safety, and technical production standards. In the European Union, the Digital Services Act (Regulation (EU) 2022/2065) extends due-diligence and transparency obligations to intermediaries that can include immersive environments where user-generated or distributed VR experiences are hosted. That shift raises compliance expectations for moderation processes, ad disclosures, and traceability across VR delivery channels.
Standards bodies are also shaping service requirements for production workflows and interoperability. In China, GB/T 44465-2024 (effective March 1, 2025) standardizes VR/AR content production processes, and the National Film Administration issued DY/Z 14.1-2026 (released January 29, 2026) with general technical requirements for VR film systems and content production. In the United States, NIST IR 8557 (2025) highlights usable cybersecurity and privacy priorities for immersive technologies, including identity management and content provenance, which aligns with how enterprise deployments increasingly weigh security, watermarking, and auditability in vendor selection.
Value Chain Analysis
The value chain starts with content commissioning (enterprise training, industrial simulation, media/entertainment, healthcare visualization) and requirements definition, then moves into pre-production (storyboarding, interaction design, and UX safety considerations) and asset creation (3D modeling, animation, volumetric capture, photogrammetry/Gaussian splats). Core production runs through game engines and real-time toolchains (Unity, Unreal, WebXR pipelines), while GPUs, cloud/edge infrastructure, and digital-twin platforms supply the compute and rendering and ingest engineering data. Distribution and delivery cover headset app stores, PC VR deployments, and browser-based WebXR, and downstream integration with learning-management systems, PLM, and enterprise IAM is typically required.
Upstream dependencies are shifting toward industrial virtual-twin ecosystems and open interchange formats as enterprises ask for physics-aware, simulation-ready assets. For example, Dassault Systemes and NVIDIA formed a long-term partnership around Virtual Twin technologies and NVIDIA AI infrastructure (February 2026), and OMRON partnered with Dassault Systemes to connect 3DEXPERIENCE and Sysmac automation for virtual validation of production lines (April 2026). Toolchain bottlenecks remain centered on interoperability (OpenXR/WebXR and OpenUSD adoption), performance optimization (LOD streaming for massive 3D data), and network efficiency for immersive video. Platforms such as Nokia RXRM, for instance, point to bandwidth-reduction approaches that are relevant to industrial teleoperation and remote collaboration workflows.
Competitive Landscape
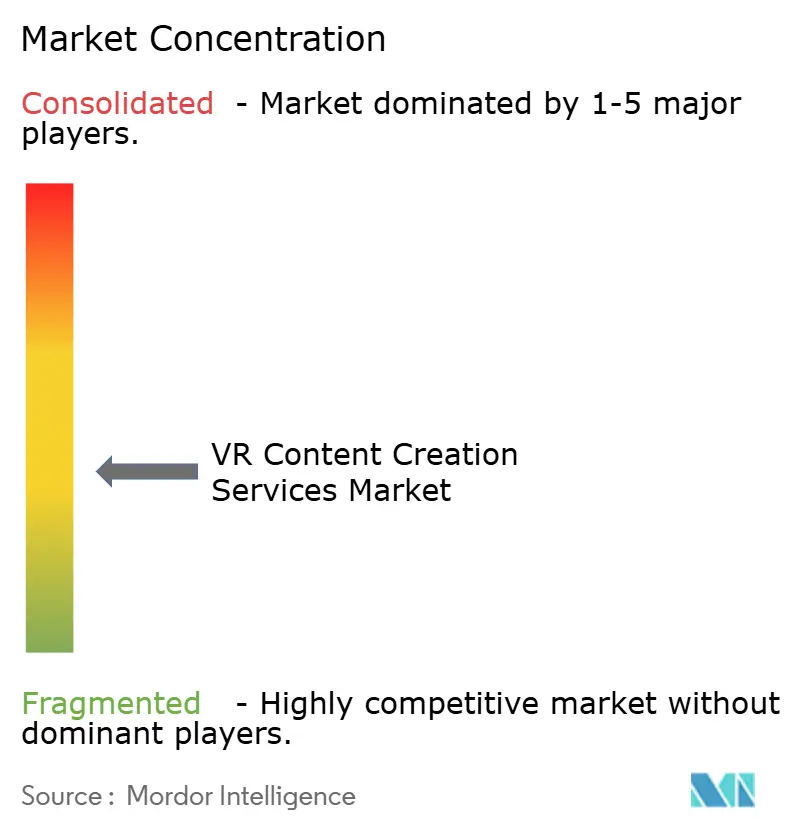
The VR Content Creation Services market is highly fragmented, with no studio holding a major global share. Boutiques such as Felix and Paul Studios and Magnopus compete on creative differentiation, while integrated post-houses like Framestore leverage in-house volumetric stages for turnkey delivery. Game-engine specialists, including Innoactive and Subvrsive, embed learning-management analytics into enterprise projects.
AI-driven procedural tools represent an emerging white space. Startups are patenting volumetric-video compression and gaze-contingent rendering, areas where Meta, Apple, and Sony filed over 200 XR patents in 2024. WebXR frameworks lower distribution barriers, allowing agencies to launch immersive storefronts without app-store fees. Small studios form consortia to share motion-capture facilities, amortizing capital costs and improving bid competitiveness.
Technology capability is the main differentiator. Teams mastering Unreal Engine 5’s Nanite geometry and Lumen lighting deliver near-cinematic realism on consumer hardware, while Unity DOTS expertise secures mobile performance gains. Matterport’s AI-enabled Property Intelligence showcases how incumbents extend platforms through machine-learning add-ons. Salary premiums of 20-30% for Unreal or Unity developers accentuate the talent crunch, prompting internal upskilling initiatives and offshore expansion.
VR Content Creation Services Industry Leaders
Voxel Digital Studios Inc.
Groove Jones LLC
Innoactive GmbH
Wevr Inc.
Trigger XR Inc.
- *Disclaimer: Major Players sorted in no particular order
VR Content Creation Services Market Companies Covered in this Report
- Voxel Digital Studios Inc.
- Groove Jones LLC
- Innoactive GmbH
- Wevr Inc.
- Trigger XR Inc.
- Future Visual Ltd.
- Zengalt LLC
- Subvrsive Inc.
- REWIND FX Ltd.
- Visualise Creative Ltd.
- PixelWhip Studios Pty Ltd.
- CreamVR Inc.
- B2Studio Sp. z o.o.
- VR Vision Group LLC
- Lucid Reality Labs LLC
- Metastage Inc.
- The Virtual Reality Company Inc.
- Framestore Ltd.
- Felix and Paul Studios Inc.
- Magnopus LLC

Market Opportunities and Future Outlook
Enterprise-grade authoring simplification is broadening the addressable buyer base for VR content services, especially in training and simulation. EON Reality's April 2026 release of EON Genesis 3.0 uses a no-code, conversational approach to create immersive training scenarios. That model shifts parts of content development toward subject-matter-expert-led production while still creating demand for studios that can package, validate, and integrate experiences into corporate systems and compliance workflows.
Production-cycle compression and higher-fidelity world capture are also opening service whitespace in modular pipelines that blend generative and reconstruction techniques with real-time engines. Groove Jones documented a June 2026 workflow integrating ComfyUI and Gaussian splats to reconstruct complex environments for standalone VR, and Foveate described a May 2026 case where 360-degree content timelines were reduced by moving previs into a collaborative live-3D environment. On the post-production side, Metaverse Stage described June 2026 use of DaVinci Resolve Studio VR180 stabilization and PanoMap tools to bring immersive finishing closer to standard cinematic pipelines, supporting demand for specialized VR post services that can deliver repeatable quality, color, and stabilization outcomes without bespoke hardware-heavy rigs.
Recent Industry Developments in VR Content Creation Services Market
- June 2026: Innoactive GmbH announced updates to its Innoactive Spatial platform, including support for Apple's Spatial Accessories framework and improved object tracking for 1:1 scale workflows. The company targets high-precision automotive and industrial design reviews, where tighter physical-digital alignment increases the value of premium VR content, interaction design, and validation services.
- September 2025: Meta introduced the Quest 3S at a USD 299 price point, positioning it as a lower-cost 6DoF headset with mixed-reality passthrough. The larger affordable hardware base expands the reachable audience for enterprise training and education deployments, supporting higher volumes of standardized VR modules and refresh cycles for content studios.
- February 2024: Epic Games released Unreal Engine 5.4 with updates that strengthen real-time content creation workflows used in VR production. The release reinforced engine-led pipelines for interactive applications and helped studios push more cinematic lighting and dense geometry into real-time experiences, increasing demand for specialized Unreal development talent across service providers.


VR Content Creation Services Market Report Scope and Research Methodology
Market Definition and Coverage
This market covers paid services used to plan, design, produce, and optimize virtual reality content for commercial and institutional use, including interactive builds and immersive media work delivered as projects or ongoing service retainers.
Scope exclusions: We exclude VR hardware sales, headset software operating systems, and pure platform subscription revenue that is not directly tied to content creation service delivery.
Segments Covered in This Report
- By Service Type
- 3D Modeling and Animation
- Interactive Application Development
- 360-Degree Video Production
- 360-Degree Photography
- Post-Production Services
- By Content Type
- Entertainment
- Training and Simulation
- Marketing and Advertising
- Education
- Healthcare Visualization
- Architecture and Real Estate Virtual Tours
- By End-Use Industry
- Media and Entertainment
- Healthcare
- Education
- Retail and Ecommerce
- Manufacturing
- Real Estate and Construction
- Tourism and Hospitality
- By Platform
- PC-Based VR
- Mobile VR
- Console VR
- WebXR
- By Geography
- North America
- United States
- Canada
- Mexico
- Europe
- Germany
- United Kingdom
- France
- Italy
- Rest of Europe
- Asia-Pacific
- China
- Japan
- India
- South Korea
- Australia
- Rest of Asia-Pacific
- Middle East and Africa
- Middle East
- Saudi Arabia
- United Arab Emirates
- Rest of Middle East
- Africa
- South Africa
- Egypt
- Rest of Africa
- Middle East
- South America
- Brazil
- Argentina
- Rest of South America
- North America
Data Sources, Market Sizing, and Validation
Desk Research
Desk research was used to set clear scope lines and to collect stable inputs that can be tracked year to year. We relied on public sources such as the US Bureau of Labor Statistics, US Census Bureau service indicators, OECD digital economy datasets, World Bank macro series, and ITU connectivity statistics to sense demand capacity and price pressure over time.
We also reviewed company annual reports, earnings decks, and credible press coverage to understand service mix changes, hiring intensity, and typical project cycles. Patent databases were referenced selectively to spot shifts in content pipelines, including volumetric capture and real time rendering methods, that can change service effort and billing. The sources listed here are illustrative, and many other public documents and datasets were also used for data collection, validation, and clarification.
Primary Interviews and Surveys
Primary work was used to pressure test assumptions on billable hours, project pricing, rework rates, and how often content is refreshed by end users. We spoke with a spread of service providers, studios, platform focused implementers, and buyer side teams across training, marketing, and entertainment, then used follow ups to reconcile gaps that desk inputs could not fully explain.
Distribution of primary research fieldwork respondents
| Company type | Respondent position | Region |
|---|---|---|
| Top tier: 28% | CXOs: 14% | APAC: 44% |
| Mid tier: 54% | Functional/Unit leaders: 41% | EMEA: 33% |
| Smaller Players: 18% | Managers: 45% | Americas: 23% |
Market-Sizing & Forecasting
The model starts with a top-down build where enterprise and consumer VR adoption signals are translated into a realistic content demand pool, and then converted into service revenue through average project size and refresh frequency. For example, training and simulation rollouts were treated differently from marketing pilots, since content update cycles and user counts do not follow the same pattern.
To keep totals grounded, we corroborated the output using selective bottom-up checks, such as sampled studio revenue bands, channel partner inputs, and a simple price times volume view for common deliverables like 360-degree video, interactive modules, and post-production. Where coverage was thin for smaller studios or freelance-heavy work, we applied a controlled uplift based on interview feedback and publicly visible capacity signals like hiring and project announcements.
Forecasts were developed using scenario analysis supported by a short set of drivers that respondents agreed are most predictive. These included installed base growth of VR devices, enterprise training budgets, average service pricing by content type, the share of projects shifting from one-off builds to retainer models, and regional rollout pace in education and healthcare. A quicker price decline was not assumed automatically, because higher complexity work (interactive and real time content) can offset unit price compression even when basic production becomes more efficient.
Data Validation & Update Cycle
Validation was done in steps, starting with cross checks against independent signals like VR device shipments, developer activity trends, and broad IT services spending direction by region. Outliers were flagged when growth moved beyond what the adoption and budget indicators could reasonably support, and then assumptions were revisited with follow up calls and internal peer review.
Before sign-off, we run variance checks across regions and key end uses so one segment is not overstated due to an unrealistic price or penetration input. Reports are refreshed annually, with interim updates when material events change adoption or pricing, and a final pre-delivery review is completed so clients receive the most current view available.
Mordor Intelligence's Vr Content Creation Services Market Size Measured Against Other Published Estimates
Published market sizes for VR content creation services often differ because the scope line between services, tools, and broader XR activity is not drawn the same way, and because pricing and project volume assumptions can change quickly. We also see differences when one estimate uses an aggressive scenario for enterprise rollouts, and another stays closer to confirmed budgets and delivery capacity.
Some published figures fold in adjacent XR software tools, platform subscriptions, or even parts of a headset ecosystem revenue. For Mordor Intelligence, revenue is counted only when it reflects paid service delivery for creating and producing VR content, such as interactive development, 3D assets, 360-degree production, and post-production, while hardware or standalone platform fees are kept out even if they support the workflow.
Benchmark comparison
| Source | Market Size | Gaps in Research Methodology |
|---|---|---|
| Mordor Intelligence | USD 6.55 B (2026) | |
| Global Consultancy A | USD 9.80 B (2026) | This figure appears to be built on a broader definition of VR content creation that can include content tools, enabling software, or wider XR workflows, which lifts the revenue pool beyond service-only delivery. |
| Regional Consultancy B | USD 0.57 B (2025) | This estimate seems narrower and closer to content creation activity rather than service revenue, and it can also be anchored to a different base year with limited inclusion of enterprise training and simulation programs. |
The spread is mainly explained by what is counted as service revenue, how enterprise use cases are treated, and the year used for currency and pricing assumptions. By tying the model to project frequency, typical deliverables, and buyer budget signals that can be rechecked, our sizing stays traceable and practical to update when adoption patterns shift.


Key Questions Answered in the Report
How large is the VR Content Creation Services market in 2026?
The VR Content Creation Services market size is USD 6.55 billion in 2026.
What is the forecast CAGR for VR content services through 2031?
The market is projected to expand at a 44.62% CAGR between 2026 and 2031.
Which content type is growing fastest?
Healthcare visualization leads with a projected 46.41% CAGR as clinical validation and reimbursement expand.
Why are enterprises prioritizing interactive applications over static assets?
Interactive modules deliver measurable gains such as 75% faster technical training and 275% higher learner confidence, driving ROI-focused procurement.
What makes WebXR attractive to marketers?
Browser-based delivery removes app-store friction, enabling three-second load times and link-based distribution while avoiding revenue-sharing fees.
Which region is expected to see the highest growth?
Asia-Pacific is forecast to record a 46.33% CAGR, supported by sizable government subsidies and widespread 5G deployment.
Page last updated on:


 Your data is secure and never sold or shared.


