
Volumetric Display Market Size and Share
Market Overview
| Study Period | 2020 - 2031 |
|---|---|
| Market Size (2026) | USD 359.76 Million |
| Market Size (2031) | USD 736.79 Million |
| Growth Rate (2026 - 2031) | 15.42 % |
| Fastest Growing Market | Middle East and Africa |
| Largest Market | Asia Pacific |
| Market Concentration | Low |
Major Players *Disclaimer: Major Players sorted in no particular order Image © Mordor Intelligence. Reuse requires attribution under CC BY 4.0. | |
Volumetric Display Market Analysis by Mordor Intelligence
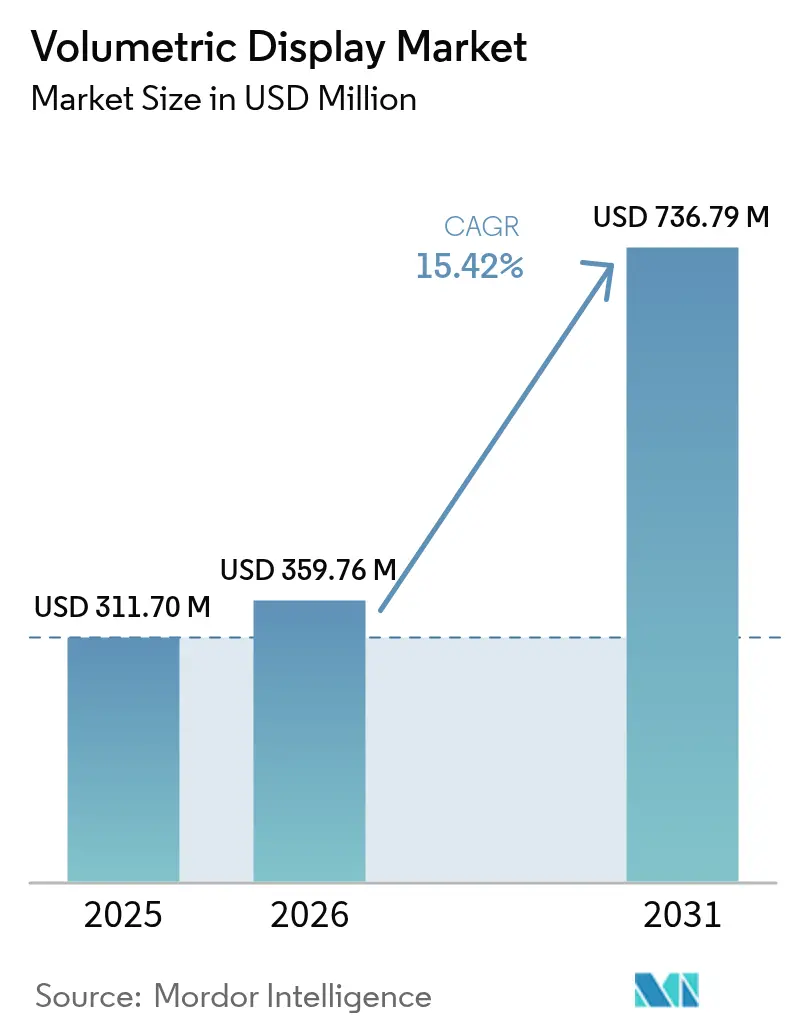
The volumetric display market size was valued at USD 311.7 million in 2025 and estimated to grow from USD 359.76 million in 2026 to reach USD 736.79 million by 2031, at a CAGR of 15.42% during the forecast period (2026-2031). Over the forecast period the technology shifts from experimental novelty toward a core visualization platform across operating rooms, command centers, and advanced cockpits. Strong demand for 3D anatomical imaging, growing defense procurement of glass-free situational-awareness consoles, and automotive moves toward full-windshield 3D clusters underpin this climb. In parallel, projector costs per lumen keep falling while real-time hologram processors shorten latency, making premium user experiences available at lower total cost of ownership. Intensifying software innovation is tilting competitive advantage toward firms that control rendering engines and content ecosystems rather than only optical hardware, rewriting the basis of differentiation inside the volumetric display market.
Key Report Takeaways
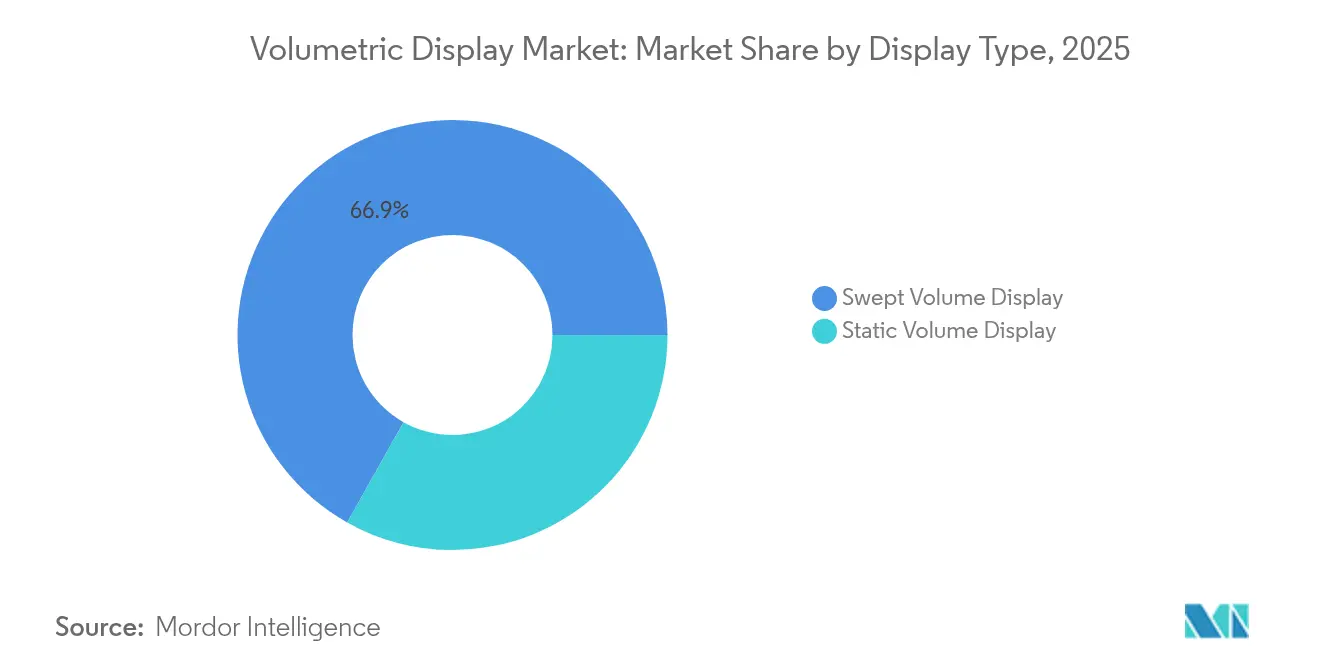
- By display type, swept-volume systems led with 66.85% revenue share in 2025; static-volume technology is forecast to advance at a 17.48% CAGR through 2031.
- By component, projectors and laser modules held 36.52% of the volumetric display market share in 2025, while rendering software & GPU hardware post the quickest growth at 16.31% CAGR to 2031.
- By display size, 24-40 inch 360-degree tables accounted for 50.05% share of the volumetric display market size in 2025; installations above 40 inch cubes are set to grow at an 18.01% CAGR.
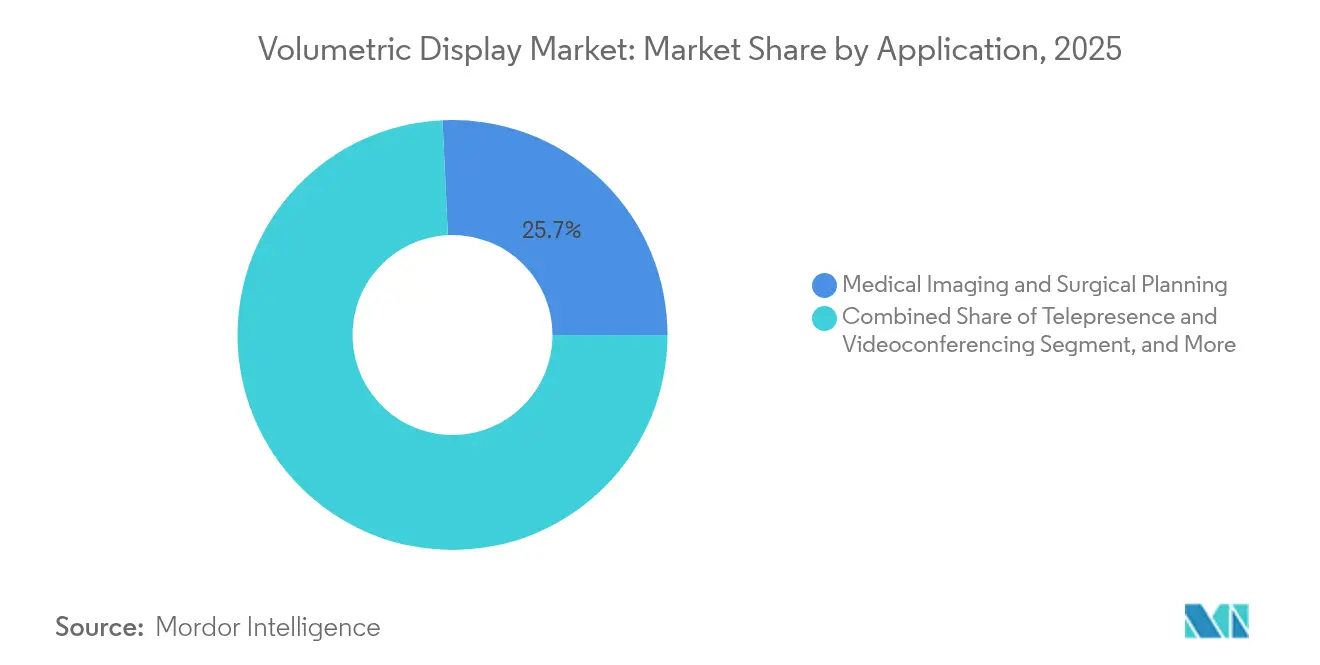
- By application, medical imaging captured 25.74% of the volumetric display market size in 2025, whereas telepresence is projected to rise at 17.22% CAGR.
- By end-user industry, healthcare providers held 23.96% share in 2025; media, sports & entertainment venues record the fastest CAGR at 15.63%.
- By geography, Asia-Pacific commanded 32.78% of the volumetric display market in 2025, while the Middle East & Africa expands most rapidly at a 16.92% CAGR.
Note: Market size and forecast figures in this report are generated using Mordor Intelligence’s proprietary estimation framework, updated with the latest available data and insights as of 2026.
Market Trends and Insights
Drivers Impact Analysis of Volumetric Display Market*
| Driver | (~) % Impact on CAGR Forecast | Geographic Relevance | Impact Timeline |
|---|---|---|---|
| Adoption of 3D anatomical visualization in minimally invasive surgeries | +3.2% | North America & Europe | Medium term (2-4 years) |
| Defense demand for glass-free 360° situational-awareness systems | +2.8% | Middle East, spillover to APAC | Short term (≤ 2 years) |
| Automotive HUD evolution toward in-cabin 3D instrument clusters | +2.1% | Germany, Japan, global reach | Medium term (2-4 years) |
| Media & entertainment pivot to location-based holographic attractions | +1.9% | Asia core, global rollout | Long term (≥ 4 years) |
| Falling projection cost per lumen via solid-state lasers | +2.4% | Global | Short term (≤ 2 years) |
| Telecom 5G rollout enabling real-time volumetric telepresence | +1.8% | United States & South Korea | Medium term (2-4 years) |
| Source: Mordor Intelligence | |||
Adoption of 3D Anatomical Visualization in Minimally Invasive Surgeries
Hospitals integrate volumetric displays to overcome the spatial constraints of flat monitors. Systems such as RealView Imaging’s Holoscope-i project interactive 3D/4D holograms that surgeons can inspect from any angle, lowering eye strain and shortening procedure times.[1] Multi-institutional studies show surgical teams preferred holographic planning in 61% of cases over 2D images, reinforcing clinical momentum. As fluorescence-guided surgery merges with holographic output, the platform evolves from simple viewer to integrated surgical console. Purchasing patterns indicate the equipment will be standard in complex surgery suites by 2027, lifting annual hardware demand inside the volumetric display market.
Defense Demand for Glass-Free 360° Situational-Awareness Systems
Armed forces in the Middle East deploy volumetric displays inside command posts to let multiple officers share the same 3D battlespace view without headsets.[2] Tests funded by the US Air Force Research Lab confirm quicker target recognition and mission-planning cycles compared with tiled 2D maps. Budget allocations for ISR upgrades now earmark glass-free 3D tables, signaling steady procurement through 2026. As OEMs certify mil-spec housing and sand-dust tolerance, defense orders form a reliable revenue stream for the volumetric display market.
Automotive HUD Evolution Toward In-Cabin 3D Instrument Clusters
OEMs move beyond basic head-up overlays toward full-windshield holographic clusters that embed speed, ADAS alerts, and navigation cues at true depth. Hyundai Mobis previewed an all-windshield unit that sections the glass into separate viewing zones, proving scalability to mass-production lines. Eye-tracking fine-tunes parallax, cutting driver distraction and enabling passenger-specific content. European and Japanese regulators are drafting harmonized guidelines, clearing the legal road for series production in 2027. Resulting design-in contracts elevate the volumetric display market’s automotive pipeline.
Media and Entertainment Pivot to Location-Based Holographic Attractions
Asian theme parks install volumetric displays to offer immersive exhibitions that home media cannot replicate. Multi-user holographic stages boost dwell time and premium ticket tiers, raising venue EBITDA. Operators report social-media amplification that lifts secondary spend on merchandise. As solid-state lasers shrink capex, mid-tier attractions adopt the format, broadening addressable demand. This leisure wave brings repeat unit orders and steady content-refresh contracts into the volumetric display market.
Restraints Impact Analysis of Volumetric Display Market*
| Restraint | (~) % Impact on CAGR Forecast | Geographic Relevance | Impact Timeline |
|---|---|---|---|
| Persistent sub-HD native resolution limiting clinical diagnostics | -2.1% | Global, acute in North America & Europe | Medium term (2-4 years) |
| High acquisition cost versus competing 3D visualization tools in SMEs | -1.8% | Global, stronger in emerging markets | Short term (≤ 2 years) |
| Limited content authoring ecosystem hindering mass adoption | -1.5% | Global | Long term (≥ 4 years) |
| Safety regulations around high-intensity laser sources | -1.2% | EU core, ripple to other regions | Medium term (2-4 years) |
| Source: Mordor Intelligence | |||
Persistent Sub-HD Native Resolution Limiting Clinical Diagnostics
Most current volumetric systems fall below the pixel density clinicians need for micro-vascular inspection or pathology review. Lower lateral resolution becomes more pronounced on large collaborative tables, forcing radiologists to revert to CT workstations for fine detail.[3] Research into color-aware holographic optimization is closing the gap, yet diagnostic-grade prototypes remain in labs. Until pixel pitches match digital microscopy thresholds, the volumetric display market must rely on surgical planning rather than diagnostics for medical revenue.
High Acquisition Cost versus Competing 3D Visualization Tools in SMEs
For resource-constrained manufacturers and design studios, a full volumetric setup-hardware, rendering licenses, and service contracts-can exceed the total cost of ownership of VR headsets by an order of magnitude. ROI calculations are further stretched by the limited pool of turnkey content developers. Government programs such as NIST’s additive-manufacturing data initiatives aim to simplify file pipelines, but cost parity with mid-range 3D monitors sits several years away.[4] This gap weighs on near-term unit volumes in the volumetric display market outside Fortune 1000 buyers.
*Our forecasts treat driver/restraint impacts as directional, not additive. The impact forecasts reflect baseline growth, mix effects, and variable interactions.
Volumetric Display Market Segment Analysis
By Display Type:
Swept-Volume Dominance and Static-Volume MomentumSwept-volume architectures capture 66.85% volumetric display market share in 2025 thanks to mature production tooling and field-proven reliability. Rotational persistence of vision enables bright images inside compact footprints, ideal for medical and defense consoles. Static-volume units, though smaller today, post the strongest 17.48% CAGR as holographic-laser-excited graphics eliminate moving parts, slashing maintenance cycles.
Recent demonstrations of color static-volume cubes show excellent environmental robustness, enticing laboratories that cannot tolerate mechanical vibration. As holographic materials scale, static-volume systems are forecast to erode swept-volume dominance, pushing the volumetric display market size for static architectures past USD 228.6 million by 2031. Vendors that master both paths hedge against future customer preference swings.

By Component:
Software Rendering as the New Growth DriverOptical hardware-projectors and laser engines-retains 36.52% share because brightness and color gamut still depend on photon efficiency. Yet rendering software and high-bandwidth GPUs accelerate at 16.31% CAGR, outpacing optics as buyers demand real-time 4K holograms. The volumetric display market size for compute subsystems is forecast to nearly double between 2026 and 2031 as processors with hologram-specific instruction sets reach commercial boards.
In response, hardware-centric firms form alliances with game-engine vendors to bundle SDKs, while pure-play software houses license IP blocks to projector manufacturers. The shift recasts value capture toward algorithms that compress interference patterns without visual artifacts, setting the next competitive battleground inside the volumetric display industry.
By Display Size:
Large-Format Installations Capture Premium SpendThe 24-40 inch 360° table remains the workhorse holding 50.05% share in 2025 because it balances immersion with desktop ergonomics. Enterprise road-mapping sessions and surgical planning benches gravitate to this footprint. Conversely, installations above 40 inch cubes race ahead at 18.01% CAGR, adding scale for team-of-ten collaboration and auditorium demonstrations. A single 60 inch cube can replace multiple monitors, justifying loftier price points and service contracts that lift the volumetric display market size in the top tier.
Below 24 inch cubes stay relevant in education kits and concept demos, but face competition from lenticular 3D laptops. Suppliers therefore tailor optical-engine line-ups across three size tiers, preventing margin leakage when customers migrate upward.
By Application:
Medical Imaging Leadership and Telepresence AccelerationMedical imaging secured 25.74% volumetric display market size in 2025 as hospitals approved capital budgets to cut operating-room time through clearer depth cues. Neuro and cardiac specialists cite shorter planning loops and lower joystick manipulation fatigue. Telepresence delivers the quickest 17.22% CAGR on the back of 5G rollouts and rising hybrid-work norms. Live 3D calls let remote experts orbit around physical prototypes or patient avatars, removing the isolation found in VR headsets.
Advertising, engineering visualization, and defense command rooms round out demand. Each vertical values the same light-field core but diverges on brightness, field-of-view, and API openness. This variety insulates the volumetric display market from single-sector slowdowns.
By End-User Industry:
Healthcare Providers Set the PaceHospitals and surgical centers accounted for 23.96% volumetric display market share in 2025, proving willingness to fund new visualization when outcome metrics improve. Capital budget committees find that a single volumetric console amortizes across multiple surgical departments. Entertainment venues, including esports arenas and theme parks, post the fastest 15.63% CAGR as operators seek social-media-ready spectacles that command premium ticket pricing.
Automotive design studios, aerospace primes, and academic labs together sustain a diversified demand base. As leading carmakers lock in windshield contracts, the automotive tier alone could represent more than USD 92.4 million of incremental volumetric display market size by 2031. Cross-industry adoption lessens cyclical risk and encourages component suppliers to standardize interfaces.
Geography Analysis
APAC Volumetric Display Market
Asia-Pacific led with 32.78% share of the volumetric display market in 2025, anchored by Japanese, Chinese, and South-Korean conglomerates that combine semiconductor strength with large domestic entertainment spend. Japan’s decision to embed holographic portraits in new banknotes signals mainstream acceptance, catalyzing local optics suppliers. South-Korea’s telcos demonstrated live 5G hologram calls, drawing enterprise pilot projects. The region’s dense supplier base keeps lead-times short, accelerating refresh cycles.
North America Volumetric Display Market
North America ranks second, propelled by US surgical-robot makers and defense labs that integrate volumetric consoles into C2 suites. Federal funding for advanced manufacturing testbeds exposes SMEs to the technology, expanding mid-market prospects. Canada’s med-tech clusters in Ontario and British Columbia add clinical validation sites, reinforcing regional credibility.
Europe Volumetric Display Market
Europe remains focused on automotive integration. German Tier-1s partner with optics specialists to engineer windshield-embedded holograms compliant with UN ECE glare rules. EU laser-safety norms slow deployments but ultimately raise baseline quality, building export appeal once certificates are issued.
MEA and LATAM Volumetric Display Market
The Middle East and Africa register the highest 16.92% CAGR through 2031 as defense ministries procure glass-free 360° tables for joint-ops centers. Sovereign funds in the Gulf finance entertainment complexes that feature holographic attractions, further boosting unit flow. Latin America shows nascent adoption, with Brazil’s universities piloting volumetric labs for industrial design curricula, seeding future demand across the continent.

Regulatory Landscape
Regulatory landscape for volumetric displays relies mainly on established safety and interoperability standards rather than bespoke rules. Laser-based illumination is typically governed by IEC 60825-1 (laser product safety) as a baseline, with IEC 62368-1 covering system-level electrical and thermal safety. For immersive and near-eye use cases, ANSI/CAN/UL 8400 (2023) applies to MR/VR equipment, while ISO/IEC 5927:2024 provides enterprise guidance for safe professional use of immersive devices. Imaging and content pipelines also connect to standards such as ISO/IEC 21794-5:2024 (JPEG Pleno) for plenoptic content.
Standardization efforts continue to expand. In February 2026, IEC published IEC TR 62629-1-3:2026, which offers guidance on depth perception and 3D object positioning on non-physical screens, informing content placement and viewing comfort for volumetric systems. The IEC 62629 series also supports shared terminology and optical measurement methods for 3D and virtual-image displays, complementing JPEG Pleno and other enterprise workflows.
Value Chain Analysis
The value chain starts with core photonics and precision components such as laser engines, optical elements, and holographic materials. For swept-volume architectures, this is followed by subsystem assembly, including control electronics and thermal management, then system integration, calibration, and software enablement (rendering engines, SDKs, and GPU-accelerated hologram processing). Japan and South Korea remain important hubs for high-precision components, while China contributes heavily to volume manufacturing and system integration, creating a dual-sourcing dynamic for risk management. Lead times for specialty optics can extend 20 to 36 weeks, which constrains project schedules and spares planning.
Downstream, go-to-market mixes direct enterprise selling (healthcare, defense, automotive studios) with pro-AV and digital-signage distribution. After installation, deployments depend on content onboarding, then multi-year maintenance. Software and content tooling sit in the middle of the chain because content conversion and real-time rendering drive deployment speed. Evidence of scaling includes plans to mass-produce 86-inch 4K Hololuminescent Displays in mid-2026 through partnerships with Looking Glass and faytech, pointing to more repeatable commercial-grade deployments.
Competitive Landscape
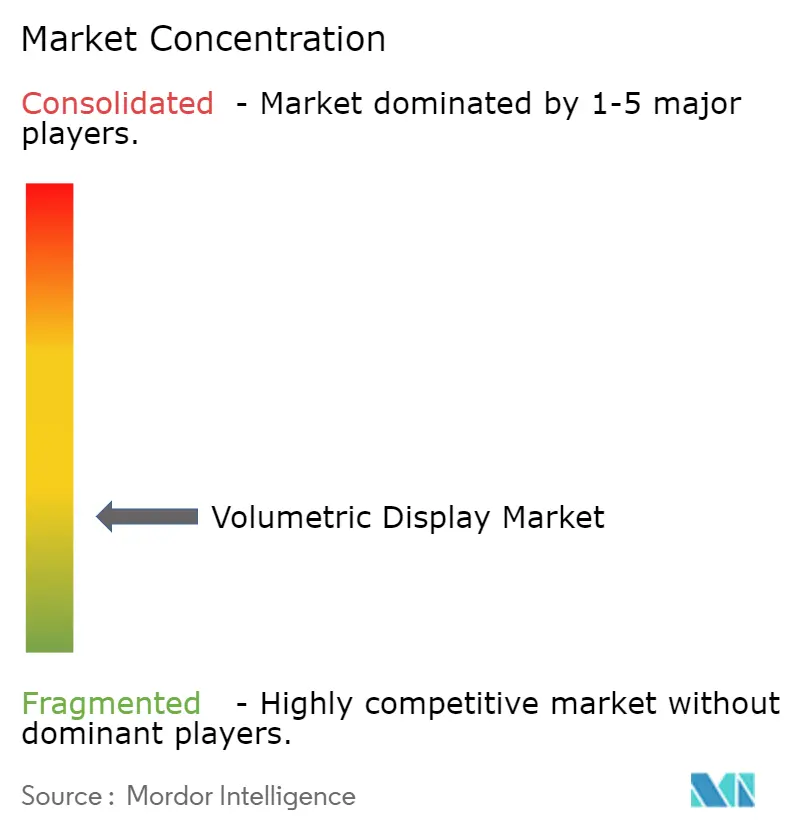
The sector exhibits moderate concentration: top five vendors collectively hold about 48% revenue, leaving room for specialists to differentiate. Sony blends proprietary micro-displays with a growing spatial-reality SDK, allowing content studios to port assets from existing pipelines. Microsoft leverages its mixed-reality software stack to position volumetric consoles as natural complements to HoloLens development kits.
Pure-plays such as Voxon Photonics and Looking Glass Factory sustain high innovation cadence by focusing on single-purpose volumetric engines. Voxon’s newest swept-volume core improved brightness by 35% while halving noise levels, addressing surgical-theater requirements. Looking Glass ships 16-inch and 32-inch light-field panels bundled with an easy-to-use Unity plug-in, reducing developer friction.
Strategic alliances rise in frequency. Optical-component maker Luminit partners with automotive Tier-1s to supply holographic windshield films, while GPU leaders collaborate with research institutes to co-design hologram-optimized instruction sets. Patent filings for diffractive optical elements and algorithmic compression soared 22% year-on-year, foreshadowing both defensive litigation and licensing revenue within the volumetric display market.
Volumetric Display Industry Leaders
-
Coretec Group Inc.
-
Voxon Photonics
-
Looking Glass Factory Inc.
-
Sony Corporation
-
LightSpace Technologies
- *Disclaimer: Major Players sorted in no particular order
Volumetric Display Market Companies Covered in this Report
- Voxon Photonics
- Looking Glass Factory Inc.
- Coretec Group Inc.
- Seekway Technology Ltd.
- Burton Inc.
- Leia Inc.
- LightSpace Technologies
- HoloTech Studios
- SeeReal Technologies
- Sony Corporation
- Magic Leap Inc.
- Google LLC
- Microsoft Corporation
- RealView Imaging Ltd.
- WayRay AG
- zSpace Inc.
- Deepsky Corporation
- Alioscopy
- Holoxica Ltd.
- The 3rd Dimension Technologies
- VividQ
- ForwardX Robotics
- Shenzhen Giant Real Technology
Market Opportunities and Future Outlook
A key opportunity sits at the intersection of enterprise visualization and content workflows, specifically faster conversion from 3D data to volumetric output. Hospitals and command centers already value multi-user glasses-free 3D collaboration, and adoption gains traction when conversion and authoring align with existing photo, video, and CAD pipelines. Looking Glass has pushed simpler content conversion (March 2026) and positions Hololuminescent Displays for broader manufacturing compatibility, widening the addressable market for light-field volumetric experiences in professional AV, retail demonstrations, and design reviews.
A second opportunity centers on tactile and interaction-forward volumetric experiences for training, exhibitions, and simulation. In June 2026, Blaise Photonics announced a free-space, touchable mid-air volumetric display platform concept, pointing to new interface options for public-facing environments. Across applications, modular architectures that decouple display engines from content pipelines, along with voxel-centric toolchains used by vendors such as Voxon Photonics, create room for integrators to package end-to-end solutions and monetize recurring content refresh and support alongside initial installations.
Recent Industry Developments in Volumetric Display Market
- June 2026: Looking Glass and faytech commenced mass production and deployment of 86-inch 4K Hololuminescent Displays, signaling scale-up from pilots to commercial-grade deployments. Deployment targets enterprise environments and multi-user collaboration contexts, expanding access to high-brightness light-field content.
- March 2026: Looking Glass Factory unveiled musubi, a consumer holographic photo and video frame, and opened pre-orders. The release broadens exposure to consumer use cases and accelerates content tooling, distribution, and price-point learning that can feed enterprise demand.
- November 2024: Voxon Photonics introduced the VX2-XL volumetric display, a large-format platform with a 512 mm diameter by 256 mm height display volume and support for up to 16 million color voxels. Scaling the installed base of larger displays strengthens visibility for multi-user applications such as live demonstration, training, and collaborative visualization.
Volumetric Display Market Report Scope and Research Methodology
Market Definition and Coverage
For this study, the volumetric display market is defined as revenue generated from 3D display systems that create a viewable image volume, along with the key software and services that enable the display to operate in end-use settings.
Scope exclusions: We exclude adjacent 3D visualization tools that do not create a true volumetric image in space, along with general AR/VR headsets and standard 2D and stereoscopic displays.
Segments Covered in This Report
- By Display Type
- Swept Volume Display
- Static Volume Display
- By Component
- Projectors and Laser Modules
- Display Panels and Optical Elements
- Rendering Software and GPU Hardware
- Holographic Materials
- Other Components
- By Display Size
- Below 360° Viewing Volume (Sub 24 inch cube)
- 360° Table-Top (24 inch-40 inch cube)
- Large-Format (Above 40 inch cube)
- By Application
- Medical Imaging and Surgical Planning
- Telepresence and Videoconferencing
- Education and Training Simulations
- Advertising and Digital Signage
- Entertainment and Gaming
- Engineering and Design Visualization
- Defence and Security Command Centers
- Other Applications
- By End-user Industry
- Healthcare Providers
- Automotive and Transportation
- Media, Sports and Entertainment Venues
- Industrial and Manufacturing
- Aerospace and Defence
- Academic and Research Institutes
- Others
- By Geography
- North America
- United States
- Canada
- Mexico
- Europe
- Germany
- United Kingdom
- France
- Nordics
- Rest of Europe
- South America
- Brazil
- Rest of South America
- Asia-Pacific
- China
- Japan
- India
- South-East Asia
- Rest of Asia-Pacific
- Middle East and Africa
- Middle East
- Gulf Cooperation Council Countries
- Turkey
- Rest of Middle East
- Africa
- South Africa
- Rest of Africa
- Middle East
- North America
Data Sources, Market Sizing, and Validation
Desk Research
Desk research is used to build the starting structure of the model and to make sure our definitions match how the industry is discussed in public sources. We rely on non-paywalled references such as US Census Bureau trade statistics, UN Comtrade data, IEEE and other peer-reviewed publication portals, WIPO patent filings, and standards and guidance notes from bodies such as ISO or IEC when they are relevant to display safety and performance.
We also review annual reports, investor presentations, product datasheets, conference proceedings, and credible press coverage to capture product roadmaps and typical pricing logic. Where available, we use paid databases for company financials and intelligence, patent databases, and shipment-level import and export data to sanity-check supplier activity and commercialization timing. These examples are not exhaustive, and additional public and paid sources are also referenced for data collection, validation, and clarification during the work.
Primary Interviews and Surveys
Primary work is used to pressure-test the demand pool and the price points that are practical in real deployments, particularly where public data is thin for early-stage technologies. We speak with a mix of display component suppliers, system integrators, distributors, and end-user buyers across APAC, EMEA, and the Americas, so the final assumptions reflect regional adoption patterns and procurement cycles.
Distribution of primary research fieldwork respondents
| Company type | Respondent position | Region |
|---|---|---|
| Top tier: 33% | CXOs: 13% | APAC: 47% |
| Mid tier: 50% | Functional/Unit leaders: 35% | EMEA: 30% |
| Smaller Players: 17% | Managers: 52% | Americas: 23% |
Market-Sizing & Forecasting
Sizing is built using a top-down approach where adoption is reconstructed from application-level demand pools and then translated into value using realistic price ladders. In practice, the model starts with the installed base potential in target settings such as medical imaging visualization, defense and aerospace simulation, automotive design reviews, and advertising displays, and then applies penetration rates refined through interviews.
To keep totals grounded, we corroborate outputs with selective bottom-up approximations, including supplier roll-ups for active product lines, sampled average selling price (ASP) by display size class, and channel checks on typical project volumes. Key inputs tracked in the model include the mix of swept-volume versus static-volume systems, average unit pricing shifts as components move from prototypes to small-batch production, the share of revenue captured by software and integration, procurement lead times for enterprise and government buyers, and the pace of pilot-to-rollout conversions.
For forecasting, scenario analysis is used because the market remains sensitive to commercialization timing and budget cycles in a few core end-use industries. Growth paths are adjusted using expert views on manufacturing scale-up, component availability, and expected ASP compression, and then the final trajectory is checked to keep it consistent with observed deployment and ordering signals.
Data Validation & Update Cycle
Validation is done through multiple checks that look for mismatches between modeled revenue and independent signals, and then the drivers are reworked before sign-off. We compare implied unit volumes, ASP bands, and application penetration against what respondents describe as feasible, and any large variances are escalated for a second analyst review.
Anomalies are also tested against trade movements, patenting intensity, and product release timing so the totals do not drift away from practical market readiness. Reports are refreshed annually, and interim updates are made when there are material events such as major launches, regulatory shifts, or supply constraints. Before delivery, a final analyst pass is completed so clients receive an updated view based on the most recent validated inputs.
Mordor Intelligence's Volumetric Display Market Size Measured Against Other Published Estimates
Published market sizes for volumetric displays often vary because the category is still emerging, and small differences in what gets counted can move the final number by a lot. The biggest swings usually come from how studies treat system revenue versus related software and integration, which year is used for currency conversion, and how fast ASPs are assumed to fall as production scales.
A refresh-led difference is common in this market because product availability and pricing can change quickly between a pilot and a commercial rollout. When quarterly price quotes, deal-level discounting, and currency timing are updated through validation calls, the resulting estimate can look more conservative than projections built on older list prices, which is why the 2026 figure referenced in Mordor Intelligence aligns to an ASP schedule that is rechecked close to publication.
Benchmark comparison
| Source | Market Size | Gaps in Research Methodology |
|---|---|---|
| Mordor Intelligence | USD 359.76 M (2026) | |
| Global Consultancy A | USD 726.96 M (2026) | Uses a higher 2026 starting point that appears to reflect faster commercialization and less ASP compression, and it may include a broader bundle of software, content, and integration revenue in the same market total. |
| Industry Publisher B | USD 549.97 M (2024) | Anchors on an earlier base year and then applies a steep growth curve, which can magnify differences if currency conversion timing and early-stage pilot pricing are not revalidated as deployments move toward scaled procurement. |
Across the three figures, the spread is mainly explained by the assumed pace of price decline, what is bundled into the market boundary, and how recently the inputs were refreshed. By keeping the model tied to clear demand pools, realistic ASP steps, and repeatable validation checks, the resulting number stays easier to trace and update as the market matures.
Key Questions Answered in the Report
What is the current value of the volumetric display market?
The market is valued at USD 359.76 million in 2026 and is projected to reach USD 736.79 million by 2031 at a 15.42% CAGR.
Which application leads revenue today?
Medical imaging holds 25.74% of the volumetric display market size in 2025, benefiting from measurable surgical-outcome gains.
Which regional market grows fastest through 2031?
The Middle East & Africa advance at a 16.92% CAGR, propelled by defense spending on glass-free 360° command-center consoles.
How are software advances influencing competition?
Rendering engines and GPU-based hologram processors are the fastest-growing component block at 16.31% CAGR, shifting value capture toward firms with algorithmic IP.
What major technological hurdle still restricts adoption?
Sub-HD native resolution limits diagnostic-grade use cases, constraining medical imaging expansion until pixel density improves.
Are volumetric displays viable for small businesses?
High acquisition and content-creation costs remain barriers for SMEs, though falling projection prices and open-source authoring tools are expected to narrow the gap over the next two years.