
Volleyball Equipment Market Size and Share
Market Overview
| Study Period | 2021 - 2031 |
|---|---|
| Market Size (2026) | USD 3.89 Billion |
| Market Size (2031) | USD 5.08 Billion |
| Growth Rate (2026 - 2031) | 5.47 % |
| Fastest Growing Market | Asia-Pacific |
| Largest Market | Middle East and Africa |
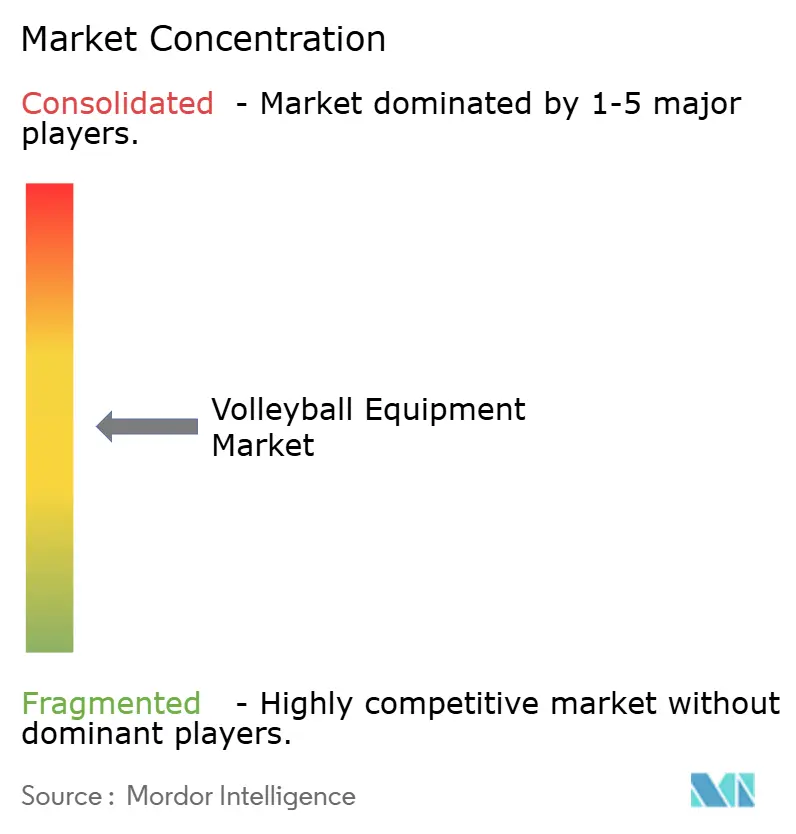
| Market Concentration | Medium |
Major Players *Disclaimer: Major Players sorted in no particular order Image © Mordor Intelligence. Reuse requires attribution under CC BY 4.0. | |
Volleyball Equipment Market Analysis by Mordor Intelligence
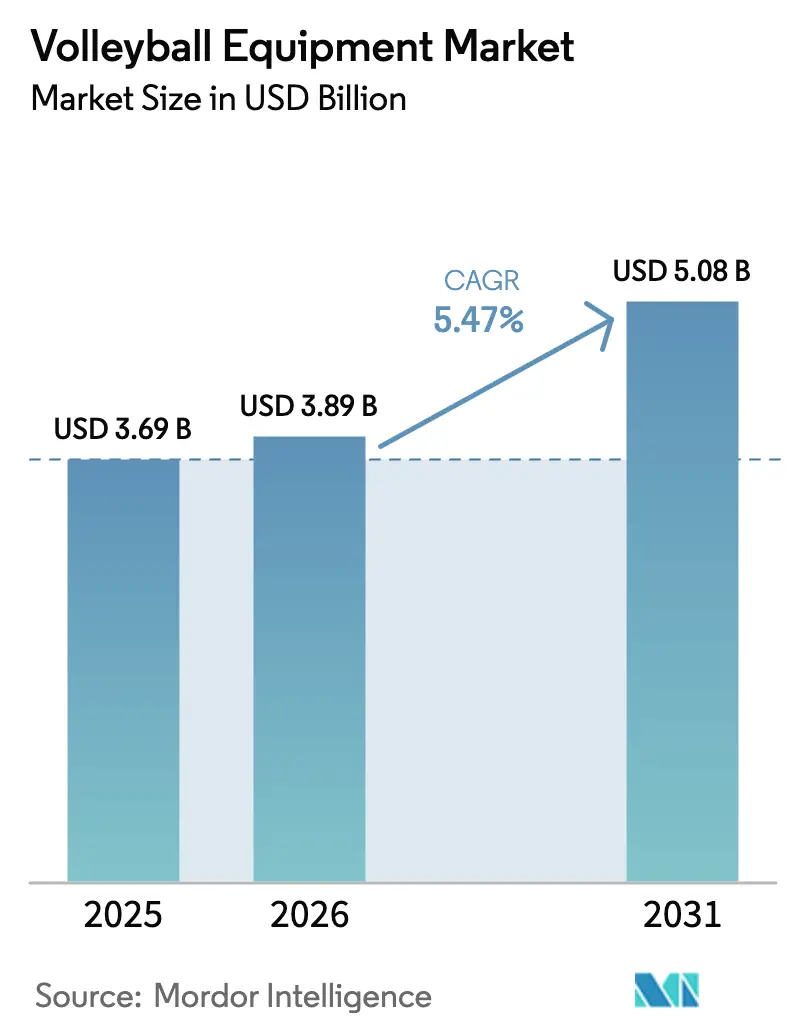
The volleyball equipment market size in 2026 is estimated at USD 3.89 billion, growing from 2025 value of USD 3.69 billion with 2031 projections showing USD 5.08 billion, growing at 5.47% CAGR over 2026-2031. Persistently rising global participation, federation-backed prize purses, and a push to professionalize regional leagues lift baseline demand for certified balls, net systems, and court infrastructure. Institutional spending is amplified by the Fédération Internationale de Volleyball’s USD 44 million Volleyball Empowerment program and its commitment to return 70% of income as prize money by 2028, a policy that cascades procurement across 222 member federations[1]. Asia-Pacific retained leadership with a 35.71% revenue share in 2024 on the back of China’s 4.6 million sports venues and India’s bolstered Khelo India budget, while the Middle East and Africa are growing fastest at 7.16% thanks to Qatar-hosted FIVB events and the UAE’s Special Olympics success. At a product level, volleyballs accounted for 44.84% of revenue in 2024, while sensor-enabled training gear was the fastest-growing category at 6.85%, as clubs seek data-rich coaching aids. Offline retail still accounts for 67.43% of global turnover, but online channels are advancing at a 7.43% CAGR.
Key Report Takeaways
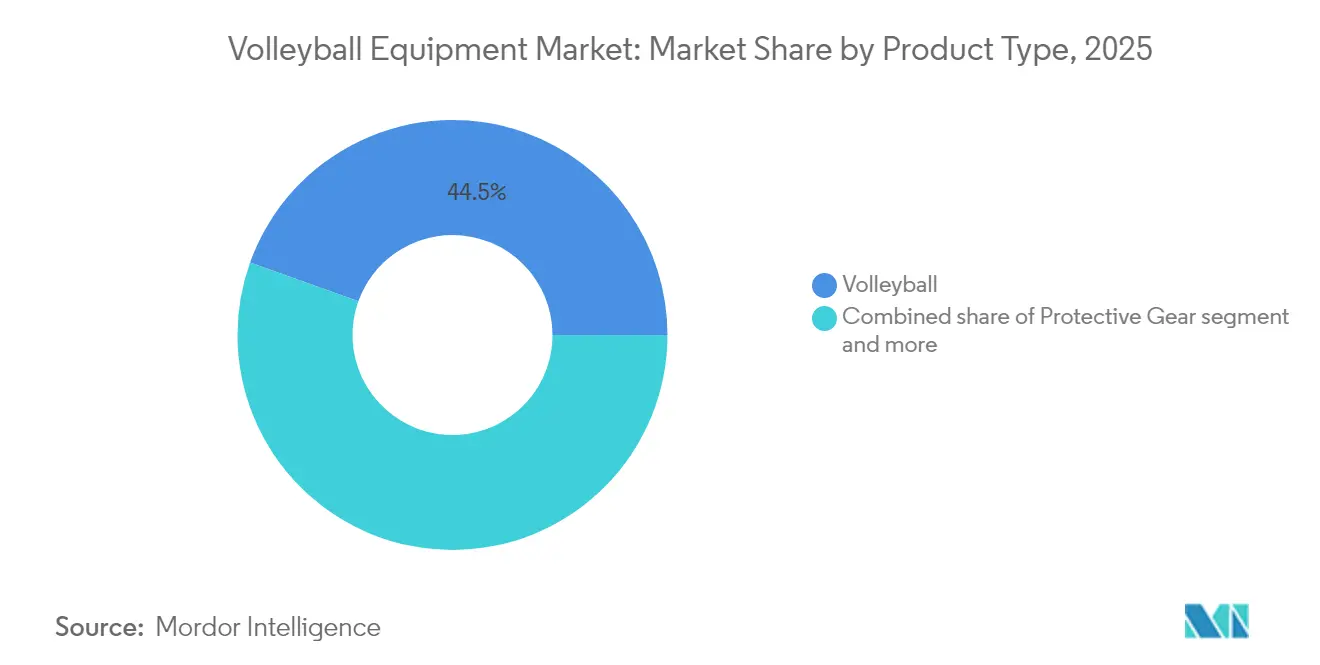
- By product type, volleyballs led with a 44.53% revenue share in 2025, whereas training equipment and accessories are expected to expand at a 6.75% CAGR through 2031.
- By volleyball type, indoor products commanded a 61.02% share of the volleyball equipment market size in 2025, while beach variants are projected to grow at a 5.93% CAGR through 2031.
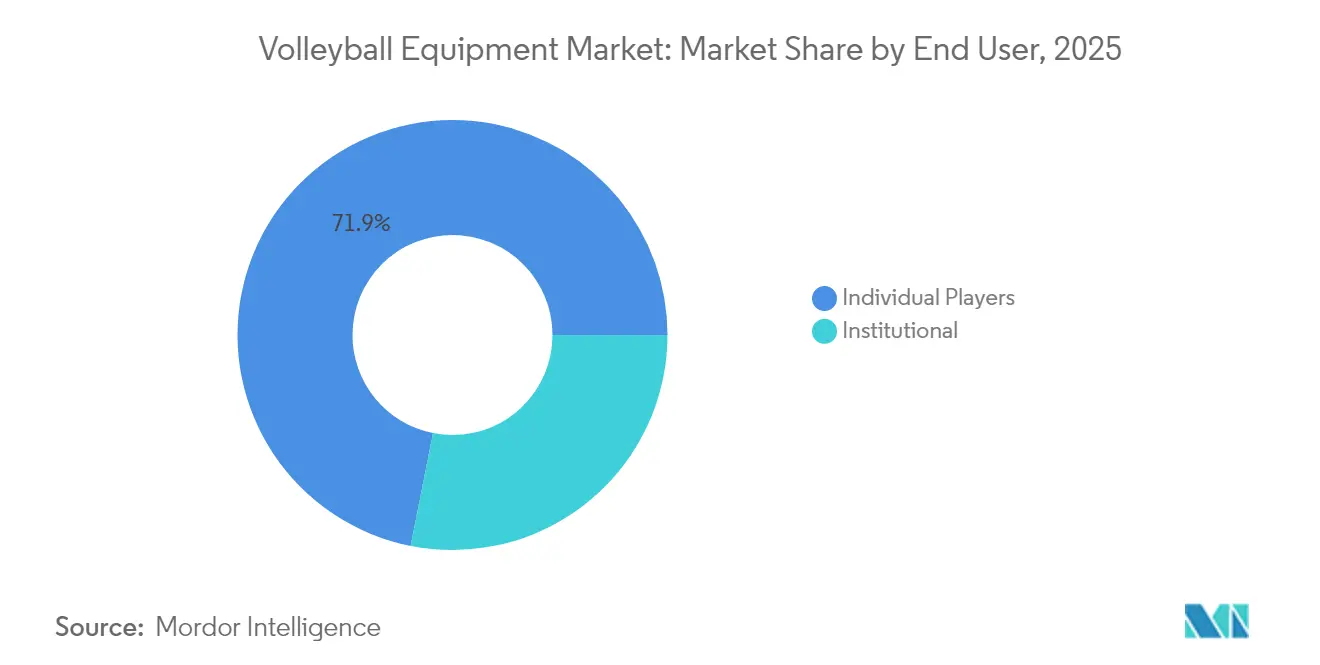
- By end-user, individual players accounted for 71.88% of the volleyball equipment market share in 2025, while institutional buyers were projected to register the highest CAGR of 6.42% through 2031.
- By distribution channel, offline channels accounted for 66.95% of the revenue in 2025, while online channels are projected to achieve a 7.32% CAGR through 2031.
- By geography, the Asia-Pacific region secured a 35.44% share in 2025, whereas the Middle East & Africa is slated for the fastest 7.05% CAGR to 2031.
Note: Market size and forecast figures in this report are generated using Mordor Intelligence’s proprietary estimation framework, updated with the latest available data and insights as of 2026.
Market Trends and Insights
Drivers Impact Analysis of Volleyball Equipment Market*
| Driver | (~) % Impact on CAGR Forecast | Geographic Relevance | Impact Timeline |
|---|---|---|---|
| Rising global participation and professional leagues | +1.2% | Global, especially Asia-Pacific, Europe, North America | Medium term (2-4 years) |
| Expansion of school and collegiate sports programs | +0.9% | North America, Europe, India, China | Long term (≥4 years) |
| Smart, sensor-enabled equipment adoption | +0.7% | North America, Europe, Japan | Short term (≤2 years) |
| Sustainable material innovation in balls and nets | +0.6% | Europe, North America, spillover to Asia-Pacific | Medium term (2-4 years) |
| High demand for performance-engineered balls | +0.8% | Global, led by pro and collegiate circuits | Short term (≤2 years) |
| Expansion of club, school, and academy ecosystems | +1.0% | India, China, Middle East and Africa, Latin America | Long term (≥4 years) |
| Source: Mordor Intelligence | |||
Rising Global Participation and Professional Leagues
The FIVB Volleyball Nations League expanded its field to 18 national squads in 2025, and the Beach Pro Tour increased entries by 41%, rising from 704 teams in 2024 to 992 in 2025, backed by USD 6.75 million in prize money, according to the International Volleyball Federation (FIVB). Each newly ranked team triggers incremental purchases of match balls, practice balls, referee stands, and certified net systems that meet FIVB homologation. Japan’s SV.League rebrand lifted foreign-player limits and targets Premier League status by 2030, a move that is already lifting demand for Mikasa’s FIVB-approved balls and Senoh’s carbon-fiber poles[2]. Official-supplier agreements effectively lock brands into multi-year equipment contracts, while grassroots clubs, eager to mirror elite standards, gravitate toward the same vendors. This halo effect increases lifetime revenue per customer, especially in emerging federations that are pressing for Olympic qualification. Consequently, securing federation tenders becomes a pivotal growth lever for both established and challenger brands.
Expansion of School and Collegiate Sports Programs
The NCAA lists 1,053 men’s volleyball teams, while the National Christian College Athletic Association elevated the sport to championship status in 2024–25, generating measurable demand for entry-level balls, nets, and protective gear, according to the NCAA. In India, the Volleyball Federation achieved Centre of Excellence status for the Bengaluru Torpedoes Academy in March 2024, and the Khelo India budget increased to INR 1,000 crore (approximately USD 120 million) for the 2025–26 fiscal year, supporting court construction and coaching certifications, as per the Ministry of Youth Affairs and Sports. China’s national mandate for 4.6 million sports venues highlights institutional investment in multipurpose halls that often include volleyball courts. Schools typically refresh equipment every two to three years, creating annuity-style revenue streams for certified suppliers. Early exposure fosters brand loyalty, as alumni often choose the same gear for recreational or club play, thereby extending customer lifetime value well beyond the scholastic market.
Smart, Sensor-Enabled Equipment Adoption
Sensor-embedded balls are transforming formerly qualitative coaching into quantitative, data-driven instruction by capturing serve speed, spin rate, and impact load[3]. In the United States, Division I programs increasingly deploy AI-enabled tracking cameras that require balls engineered with precise surface-reflectivity parameters to ensure stable optical readings, driving demand for tightly specified match balls. Wilson’s 2024 Impact Report highlights lifecycle-assessment protocols that integrate data analytics with sustainability objectives, indicating that “design for data” and “design for environment” are converging in next-generation equipment. Bundled offerings that pair hardware with cloud-based analytics are enabling recurring subscription revenues and creating proprietary ecosystems similar to the razor-and-blade model used in wearables. As hardware prices fall, adoption is expected to expand to mid-tier colleges and aspirational clubs, accelerating a technology flywheel that rewards early movers with scalable software platforms.
Sustainable Material Innovation in Balls and Nets
Covestro’s bio-based TPU blends cut petrochemical use while still meeting FIVB rebound standards, helping manufacturers hedge against volatile PVC prices and comply with EU ESG requirements. Mikasa’s BV550C beach ball, featuring recycled nylon, showcased this shift when it debuted at the Paris 2024 Olympics. EU policy is accelerating the adoption of circular design: the Ecodesign Regulation 2024/1781 bans landfilling unsold footwear and apparel from July 2026, prompting brands to adopt circular design[4]. ISO 14001 certification and third-party lifecycle assessments increasingly shape European tenders, making sustainability a procurement prerequisite rather than a branding tool. Early movers that integrate recyclable polymers and launch take-back programs are gaining preferential access to school, municipal, and other public-sector contracts governed by green mandates.
Restraints Impact Analysis of Volleyball Equipment Market*
| Restraint | (~) % Impact on CAGR Forecast | Geographic Relevance | Impact Timeline |
|---|---|---|---|
| High cost of professional-grade balls | -0.5% | Global; acute in Latin America, Africa, South Asia | Short term (≤2 years) |
| Inconsistent standards across leagues and regions | -0.4% | Global; highest fragmentation in Asia-Pacific, Latin America | Medium term (2-4 years) |
| High maintenance and installation costs of courts | -0.6% | Emerging markets in Africa, South Asia, Latin America | Long term (≥4 years) |
| PU/PVC price volatility and tightening ESG regulation | -0.7% | Global; regulatory pressure greatest in Europe | Medium term (2-4 years) |
| Source: Mordor Intelligence | |||
High Cost of Professional-Grade Balls
Top-tier leather balls from Mikasa, Molten, and Baden retail for USD 85–150, placing them out of reach for many schools in South Asia and sub-Saharan Africa, according to Baden Sports Canada. India’s September 2025 GST reduction to 5% helps ease pricing but does not offset the high cost of imported synthetic-leather inputs used by factories in Jalandhar and Meerut. As a result, budget-strained programs rely on USD 20–30 PVC balls that degrade quickly, limiting skill development but creating steady replacement demand. Manufacturers that introduce thermoplastic-elastomer composite balls in the USD 40–60 range can tap institutions seeking durability at accessible prices. Narrowing this affordability gap is essential for expanding participation and sustaining long-term market growth.
Inconsistent Standards Across Leagues and Regions
The FIVB, NCAA, and major national federations enforce differing ball dimensions, pressure levels, and color requirements, prompting manufacturers to engage in costly short-run production. Smaller brands struggle to fund multiple homologation fees, which can exceed USD 50,000 per model. Clubs in emerging markets often purchase non-compliant balls unknowingly, only to face replacement costs when their equipment fails to meet tournament certification standards. These fragmented standards increase SKU complexity, inflate logistics burdens, and compress supplier margins. A unified global specification could streamline manufacturing and unlock economies of scale, but until then, compliance friction will remain a structural drag on the market.
*Our forecasts treat driver/restraint impacts as directional, not additive. The impact forecasts reflect baseline growth, mix effects, and variable interactions.
Volleyball Equipment Market Segment Analysis
By Product Type:
Volleyballs Anchor Revenue, Training Equipment AcceleratesVolleyballs accounted for 44.53% of revenue in 2025, highlighting their essential role at every level of play. Nets and posts follow, supported by institutional upgrades from aging steel systems to corrosion-resistant carbon-fiber designs, such as Senoh’s DE53 poles priced above USD 1,000. The training equipment segment is the fastest-growing, projected to grow at a 6.75% CAGR through 2031, driven by sensor-enabled balls and AI video trackers that enhance coaching programs. Protective gear is benefiting from increased injury-prevention awareness, particularly among female athletes, who have higher rates of ACL injuries. Footwear remains highly competitive, with Nike’s Zoom Hyperset 2 at USD 135 targeting elite players and the USD 75 HyperQuick appealing to budget-conscious buyers.
Bundled procurement is gaining traction: Baden’s Champions set, which combines a ball, net, posts, and lines for USD 239.99, is popular among community clubs that lack sourcing expertise, according to Baden Sports Canada. Training equipment software add-ons, such as IMU sensor recalibration subscriptions, generate recurring revenue. While footwear and braces have lower margins than balls, they drive brand loyalty and cross-selling opportunities. Suppliers that balance high-margin core items with complementary ecosystem offerings strengthen customer retention and expand the overall volleyball equipment market.

By Volleyball Type:
Indoor Dominates, Beach Gains MomentumIndoor volleyball accounted for 61.02% of equipment sales in 2025, driven by scholastic leagues and professional franchises that rely on hardwood courts and leather- or composite balls engineered for controlled rebound, according to the International Volleyball Federation (FIVB). Beach volleyball, supported by an increase in participating teams and rising prize pools, is projected to grow at a 5.93% CAGR through 2031. Equipment specifications differ: beach balls feature softer, water-resistant covers and lower internal pressure, while posts require rust-proof coatings to withstand outdoor conditions.
Growth in beach formats is shifting demand toward portable, weather-resistant kits, such as Senoh’s DE5000 pole set, which includes anodized tubing and sand anchors priced at USD 395. Junior beach events hosted by the Qatar Foundation illustrate geographic expansion beyond traditional North American and European markets. Brands offering modular systems that accommodate indoor, beach, and even snow volleyball will appeal to multipurpose facilities aiming to maximize asset utilization.
By End-User:
Individual Players Lead, Institutions AccelerateIndividual players accounted for 71.88% of volleyball equipment revenue in 2025, driven largely by backyard sets and recreational balls priced between USD 20 and USD 40. Institutional buyers, including schools, colleges, and clubs, are expected to outpace overall market growth at a 6.42% CAGR, supported by government grants such as India’s INR 1,000 crore Khelo India program and FIVB’s Volleyball Empowerment Fund. Institutions typically replace match balls each season to meet homologation standards, creating predictable reorder cycles.
Individual consumers remain highly price-sensitive with lower brand loyalty, yet aspirational players increasingly seek NFHS-approved composite balls in the USD 50-70 range, presenting mid-tier growth opportunities for brands that combine quality with affordability. In the United States, club volleyball blurs the line between individual and institutional demand, as parent-organized teams make bulk purchases through direct-to-consumer channels. Volume-based discounts and customization options, including logos and color choices, enhance supplier positioning in this hybrid segment.
By Distribution Channel:
Offline Holds Share, Online SurgesOffline retailers accounted for 66.95% of volleyball equipment revenue in 2025, reflecting the tactile nature of ball evaluation and the logistical efficiency of bulk-order fulfillment for schools. Online channels, however, are growing at a 7.32% CAGR, supported by an increase in sports-equipment e-commerce traffic. While desktops still dominate conversions for complex purchases, mobile devices now account for 63% of browsing traffic, indicating that product discovery is increasingly beginning on handheld screens.
Brands are adopting omnichannel strategies: Wilson and Baden operate proprietary e-commerce sites while maintaining partnerships with Dick’s Sporting Goods and Decathlon for in-store trials. Paid search accounts for 56.5% of online traffic, underscoring the importance of SEO and sponsored listings. Subscription models, such as quarterly ball shipments and annual net replacements, reduce churn and stabilize revenue, creating a defensible advantage against price-driven competitors.
Geography Analysis
APAC Volleyball Equipment Market
The Asia-Pacific region held the largest regional share at 35.44% of volleyball equipment revenue in 2025, supported by China’s 4.07 billion square meters of sports facilities and government mandates promoting broader physical activity. India is the fastest-growing sub-market, driven by Khelo India budget increases, GST reductions on sports goods, and FIVB-certified academies, which collectively boost demand for certified balls and portable net systems. Japan’s SV.League rebrand presents a mixed outlook: rising professional standards drive premium equipment sales, while demographic headwinds cause youth participation to decline.
EMEA and North America Volleyball Equipment Market
The Middle East and Africa are projected to record the fastest CAGR at 7.05% through 2031, spurred by Qatar hosting major tournaments and the UAE’s 2025 Unified Volleyball World Cup victory. The FIVB’s USD 47 million global investment channel provides equipment grants to emerging federations; however, the fragmented distribution and price sensitivity require hybrid approaches that combine local wholesalers with direct-to-consumer e-commerce. North America and Europe, though mature, sustain steady replacement cycles, with the NCAA’s 1,053 men’s teams alone ensuring seasonal reorders of FIVB-approved balls, and EU green procurement rules favoring ISO 14001-certified suppliers.
LATAM Volleyball Equipment Market
Latin America remains underpenetrated. Brazilian federal spending on sports and leisure is well below previous levels, limiting public-sector purchases, while Argentina’s Liga ACLAV relies on club funding rather than centralized procurement, fragmenting demand and raising per-unit logistics costs. Nevertheless, WHO data indicate the region has one of the highest shares of inactive adults globally, suggesting latent growth potential if affordability improves and grassroots programs expand. Challenger brands using direct-to-consumer channels are well-positioned to bypass inefficient retail networks and capture this untapped demand.

Regulatory Landscape
Volleyball equipment is shaped by sport-specific certification requirements alongside broader product standards. At the elite level, Fédération Internationale de Volleyball (FIVB) homologation sets the compliance benchmarks for balls and system components used in sanctioned competition procurement, which in turn affects which suppliers qualify for federation and league tenders. In parallel, formal standards define product requirements for institutional installations, including EN 1271:2014 for functional and safety requirements and test methods for indoor and outdoor volleyball equipment.
In North America, standardization also extends to facility specification language through ASTM F3683-24, which defines terminology for commercially installed indoor volleyball equipment and divider curtains. These frameworks influence design validation, documentation, and bidding, and they can raise compliance costs for suppliers serving both FIVB-aligned competition settings and school or municipal installations.
Competitive Landscape
The volleyball equipment market remains moderately fragmented, led by Mikasa, Molten, Wilson, Tachikara, and Spalding. Mikasa leverages Olympic sponsorships and the Beach Pro Tour to secure premium visibility, while Molten’s FLISTATEC technology reinforces its presence across NCAA championships. Senoh, via exclusive North American partner Sports Imports, captures over 90% of FIVB-approved net systems in U.S. collegiate programs, demonstrating a near-monopolistic niche.
Consolidation pressure is rising: RIP-IT Sports acquired Tachikara in January 2024, gaining a Japan-to-North America supply chain that reduces per-unit freight and homologation costs. White-space opportunities focus on sustainable materials, sensor integration, and distribution agility. Wilson’s 2024 lifecycle-assessment report highlights transparent ESG metrics, increasingly required for European tenders, while Covestro’s bio-based TPU offers upstream material differentiation.
Challenger brands increased their market share between 2019 and 2024 by adopting digital-first, direct-to-consumer strategies that undercut incumbents on price. Legacy companies are responding with augmented-reality product previews and AI sizing tools to replicate in-store experiences online. Modular smart-equipment ecosystems, combining hardware and software subscriptions, generate recurring revenue and raise switching costs, positioning early adopters for outsized gains as sensor technology becomes more affordable.
Volleyball Equipment Industry Leaders
-
Mikasa Corporation.
-
Spalding Sports Equipment.
-
Tachikara Holdings, Ltd.
-
Wilson Sporting Goods Co.
-
Molten Corporation
- *Disclaimer: Major Players sorted in no particular order
Volleyball Equipment Market Companies Covered in this Report
- Mikasa Corporation
- Molten Corporation
- Wilson Sporting Goods Co.
- Tachikara Holdings Ltd.
- Spalding Sports Equipment
- Baden Sports
- ASICS Corporation
- Mizuno Corporation
- Under Armour, Inc.
- Nike, Inc.
- Adidas AG
- Puma SE
- Senoh Corporation
- Gared Holdings
- Douglas Sports
- Bison, Inc.
- Jaypro Sports, LLC
- United Volleyball Supply, LLC
- Park & Sun Sports
- Champion Sports
Market Opportunities and Future Outlook
Technology-enabled training ecosystems create a clearer whitespace where equipment purchases increasingly bundle into ongoing services. Sensor-integrated training gear and performance-analytics workflows have moved into more structured coaching environments, which gives vendors room to pair hardware (balls, tracking-compatible equipment, accessories) with software add-ons and recalibration or content subscriptions. That model shifts demand away from one-off transactions toward recurring spend.
Sustainability and public procurement are also influencing product roadmaps and bid qualification in key buying regions. The EU Ecodesign Regulation 2024/1781, including the July 2026 ban on landfilling unsold footwear and apparel, reinforces circular-design pressure that is already showing up in tenders through ISO 14001 and lifecycle-assessment documentation requirements, and Mikasa has pointed to recycled-material direction with the BV550C beach ball introduced for the Paris 2024 Olympics. India’s Khelo India budget expansion for 2025-26 and NITI Aayog’s 2026 focus on building sports-equipment manufacturing capability also point to opportunities for more localized production and value-tier offerings that reduce landed cost and improve institutional affordability while maintaining certification alignment.
Recent Industry Developments in Volleyball Equipment Market
- March 2026: Mikasa Corporation announces a partnership with the Polish Volleyball Federation to be the official volleyball supplier for indoor and beach competitions from the 2026/2027 season. This partnership supports Mikasa's procurement visibility in European markets through federation-backed events.
- February 2026: Mikasa USA enters a multi-year engagement with professional beach volleyball athletes Taryn Brasher and Kristen Nuss (TKN). The endorsement program increases brand presence in the pro beach segment and extends reach toward collegiate audiences.
- October 2025: Spalding Sports Equipment secures an exclusive retail partnership with Overtime and Overtime Elite (co-branded products). The collaboration expands distribution with products positioned around youth and professional league demand.
Volleyball Equipment Market Report Scope and Research Methodology
Market Definition and Coverage
For this study, the volleyball equipment market covers the sale of physical gear used to play or train for indoor and beach volleyball, across retail and institutional buying, tracked as market value in USD.
Scope exclusions: We exclude volleyball event services, media rights, coaching services, and pure digital training subscriptions that do not bundle physical equipment.
Segments Covered in This Report
- By Product Type
- Volleyballs
- Nets and Posts
- Shoes
- Protective Gear
- Training Equipment and Accessories
- By Volleyball Type
- Indoor Volleyball
- Beach Volleyball
- By End-User
- Institutional (School, Colleges, Sports Clubs, and more)
- Individual Players
- By Distribution Channel
- Offline Channels
- Online Channels
- By Geography
- North America
- United States
- Canada
- Mexico
- Rest of North America
- Europe
- United Kingdom
- Germany
- France
- Italy
- Spain
- Russia
- Netherlands
- Poland
- Rest of Europe
- Asia-Pacific
- China
- Japan
- India
- Australia
- Thailand
- South Korea
- Rest of Asia-Pacific
- South America
- Brazil
- Argentina
- Colombia
- Rest of South America
- Middle East and Africa
- United Arab Emirates
- South Africa
- Qatar
- Egypt
- Rest of Middle East and Africa
- North America
Data Sources, Market Sizing, and Validation
Desk Research
Desk research helped us set the base structure of the market and keep assumptions tied to real participation and trade signals. We reviewed public sources such as FIVB rules and guidance, national sports bodies and school athletics participation summaries, and government statistics portals (for example, consumer spending and price indexes where relevant).
To ground supply and distribution patterns, we also referenced customs and trade datasets from sources such as UN Comtrade and national customs dashboards, plus sports goods association publications and selected peer reviewed articles on sports participation trends. We used company annual reports, investor presentations, and reputable press coverage to understand product positioning, channel mix, and expansion plans. In addition, we relied on paid subscriptions that support company financials and intelligence, global contracts and tenders tracking, and shipment level import and export screening when clarification was needed. These desk sources are illustrative, and many other public documents and datasets were also consulted for cross-checks and gap filling.
Primary Interviews and Surveys
Primary work was used to test what we saw in public sources and convert it into practical pricing and volume assumptions. We spoke with a mix of manufacturers, distributors, specialty retailers, e-commerce focused sellers, and institutional buyers such as clubs and schools, and we checked inputs across key demand regions to avoid over-weighting a single country.
These conversations helped confirm product replacement cycles for volleyballs and protective gear, typical order sizes, price ladders by quality tier, and what counts as true volleyball equipment versus adjacent sports gear that is marketed to volleyball players.
Distribution of primary research fieldwork respondents
| Company type | Respondent position | Region |
|---|---|---|
| Top tier: 27% | CXOs: 20% | APAC: 39% |
| Mid tier: 51% | Functional/Unit leaders: 36% | EMEA: 36% |
| Smaller Players: 22% | Managers: 44% | Americas: 25% |
Market-Sizing & Forecasting
The core build uses a top-down demand pool approach where participation and program counts are translated into equipment needs, and then converted into value using price bands seen in the market. For volleyball, key inputs include indoor versus beach participation direction, school and club program activity, replacement frequency for volleyballs and protective gear, net system purchase patterns for facilities, and channel split shifts toward online.
Once those demand blocks were created, we cross-checked results with selective bottom-up approximations, such as sampled brand and retailer assortment checks, typical average selling price ranges by quality tier, and distributor level mix discussions. Those checks are then used to correct any obvious over-counting. Where information was missing, we filled gaps by applying conservative penetration or replacement assumptions, then re-tested them in follow-up expert calls.
For forecasting, scenario analysis was applied around participation growth and pricing progression, and it was supported by expert consensus on how inflation, promotional intensity, and institutional budgets are likely to move over the forecast period. The final numbers are kept traceable to a small set of measurable drivers that can be updated when new signals appear.
Data Validation & Update Cycle
We validate outputs through multiple checks that look for mismatches between the model and real world signals, such as unusual spikes in implied per-player spending or sudden share shifts between channels that are not supported by interviews. Inputs are reviewed in steps, first at the assumption level and then at the total market level, before a final analyst review signs off.
If large variances show up against external indicators like trade movement, headline pricing, or participation trends, we revisit the assumptions and, when needed, re-contact industry participants to confirm what changed. Reports are refreshed annually, and interim updates are made when a material event occurs, such as a major pricing reset, policy change affecting sports programs, or a meaningful channel disruption. Before delivery, the model is run again with a last pass review so clients receive the latest updated view.
Mordor Intelligence's Volleyball Equipment Market Size Versus Other Published Estimates
Published market estimates for volleyball equipment can differ because the market can be defined in more than one practical way, and then priced using different assumptions. Differences usually come from what gets included as equipment, how online pricing and discounting are treated, and whether institutional buying is measured with the same care as retail.
Some figures expand the scope to include volleyball apparel and footwear as part of the spend, which lifts totals. In the methodology used by Mordor Intelligence, the counted value is limited to equipment and gear used directly for play and training, and apparel-only categories are kept outside the market even if they are marketed to volleyball players.
Benchmark comparison
| Source | Market Size | Gaps in Research Methodology |
|---|---|---|
| Mordor Intelligence | USD 3.89 B (2026) | |
| Industry Publisher A | USD 2.80 B (2025) | Uses an earlier base year and appears to include a broad product list that blends equipment with apparel and footwear, which changes the counted spend and the implied price mix. |
| Press Release B | USD 3.90 B (2024) | Combines apparel and equipment in one total, and the base year pricing level is not clearly normalized for channel discounts or the shift toward online bundles. |
The spread in the table is mainly explained by scope and base year alignment, and then by how price progression is handled for online-heavy categories. Our approach keeps the market traceable to participation-linked demand blocks and practical price bands, which makes updates repeatable when new program, trade, or pricing signals change.
Key Questions Answered in the Report
How large is the volleyball equipment market in 2026?
It was valued at USD 3.89 billion in 2026 and is forecast to hit USD 5.08 billion by 2031.
Which product category dominates current sales?
Volleyballs lead with 44.53% of global revenue, although training accessories are growing fastest at 6.75% CAGR.
Which region is expanding quickest?
The Middle East and Africa region is projected for a 7.05% CAGR through 2031, the highest among all geographies.
Who are the main ball suppliers?
Mikasa and Molten top the list, backed by FIVB and NCAA official-ball contracts that secure premium visibility.
What sustainability regulations impact manufacturers most?
The EU’s Ecodesign Regulation 2024/1781 bans disposal of unsold goods from July 2026 and, together with CSRD reporting rules, is pushing suppliers toward recycled and bio-based materials.