
Vitamin D Testing Market Size and Share
Market Overview
| Study Period | 2020 - 2031 |
|---|---|
| Market Size (2026) | USD 1.13 Billion |
| Market Size (2031) | USD 1.67 Billion |
| Growth Rate (2026 - 2031) | 8.21 % |
| Fastest Growing Market | Asia-Pacific |
| Largest Market | North America |
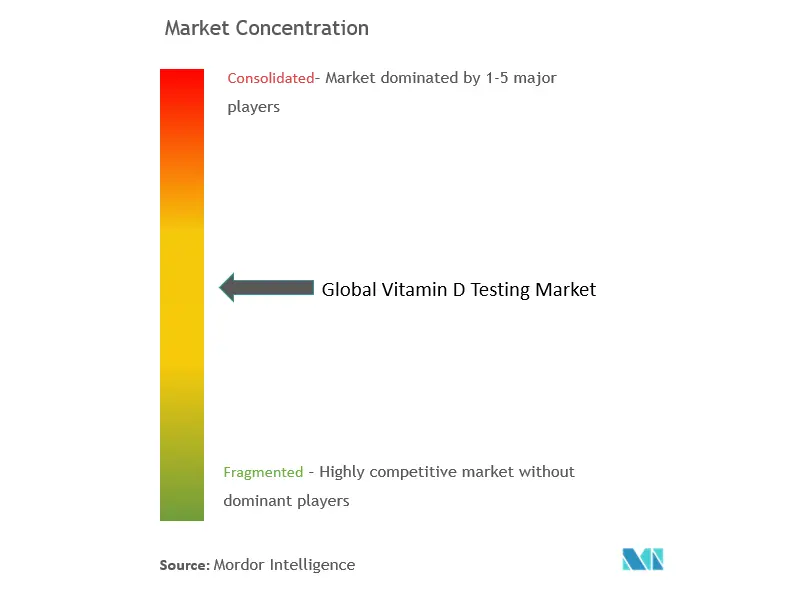
| Market Concentration | High |
Major Players *Disclaimer: Major Players sorted in no particular order Image © Mordor Intelligence. Reuse requires attribution under CC BY 4.0. | |
Vitamin D Testing Market Analysis by Mordor Intelligence
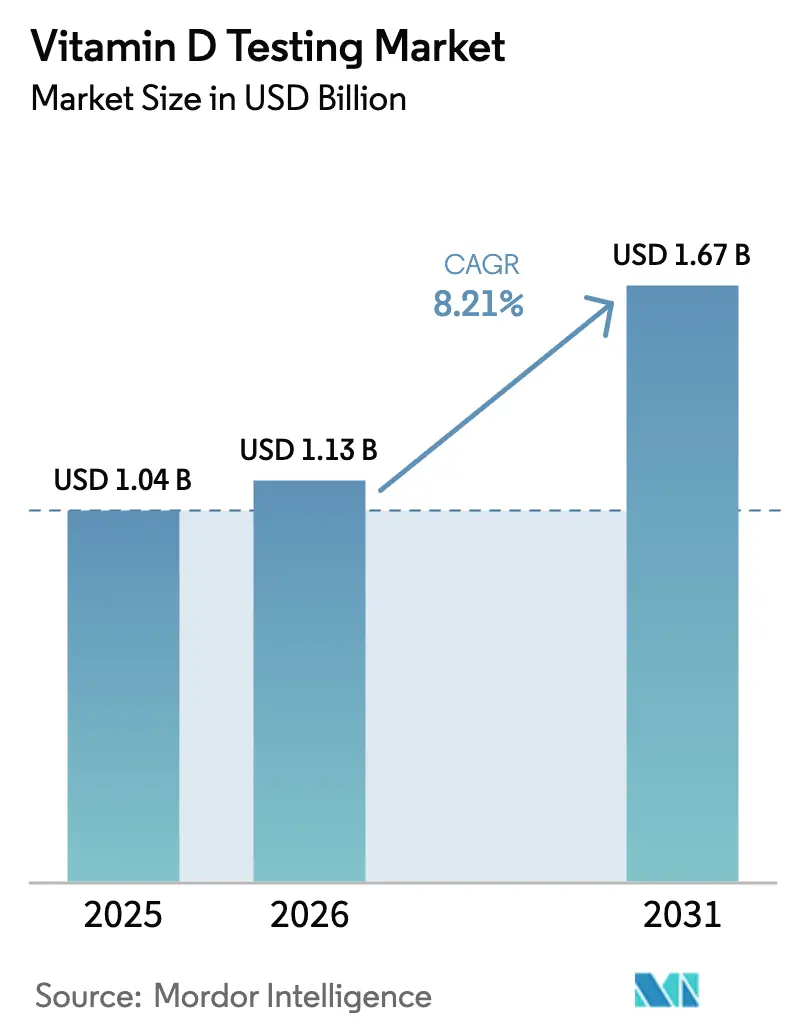
The Vitamin D testing market size is expected to grow from USD 1.04 billion in 2025 to USD 1.13 billion in 2026 and is forecast to reach USD 1.67 billion by 2031 at 8.21% CAGR over 2026-2031. Rapid adoption of automated chemiluminescence immunoassay (CLIA) platforms is lowering per-test costs and enabling high-throughput workflows that support expanding screening programs. Regulatory alignment—most notably the U.S. Food and Drug Administration’s framework for laboratory-developed tests—reduces methodology uncertainty and encourages investment in advanced analytical platforms. Preventive-care incentives, expanded reimbursement codes, and fortification-surveillance mandates jointly elevate test volumes across healthcare systems. Meanwhile, dried blood spot micro-sampling is broadening patient access by enabling reliable remote collection under ambient conditions.
Key Report Takeaways
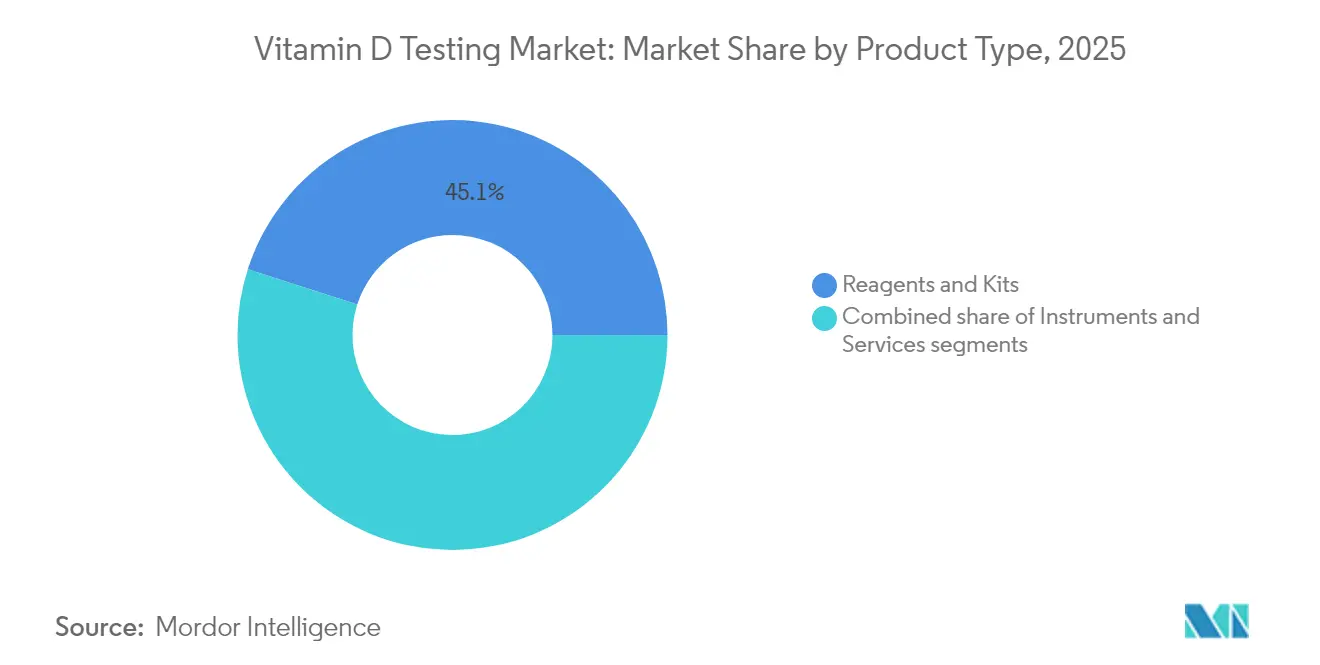
- By product type, reagents and kits accounted for 45.05% of the Vitamin D testing market share in 2025 while the services segment is on track for an 8.87% CAGR to 2031.
- By technology, CLIA held 38.25% share of the Vitamin D testing market in 2025; LC-MS/MS is projected to expand at a 9.30% CAGR through 2031.
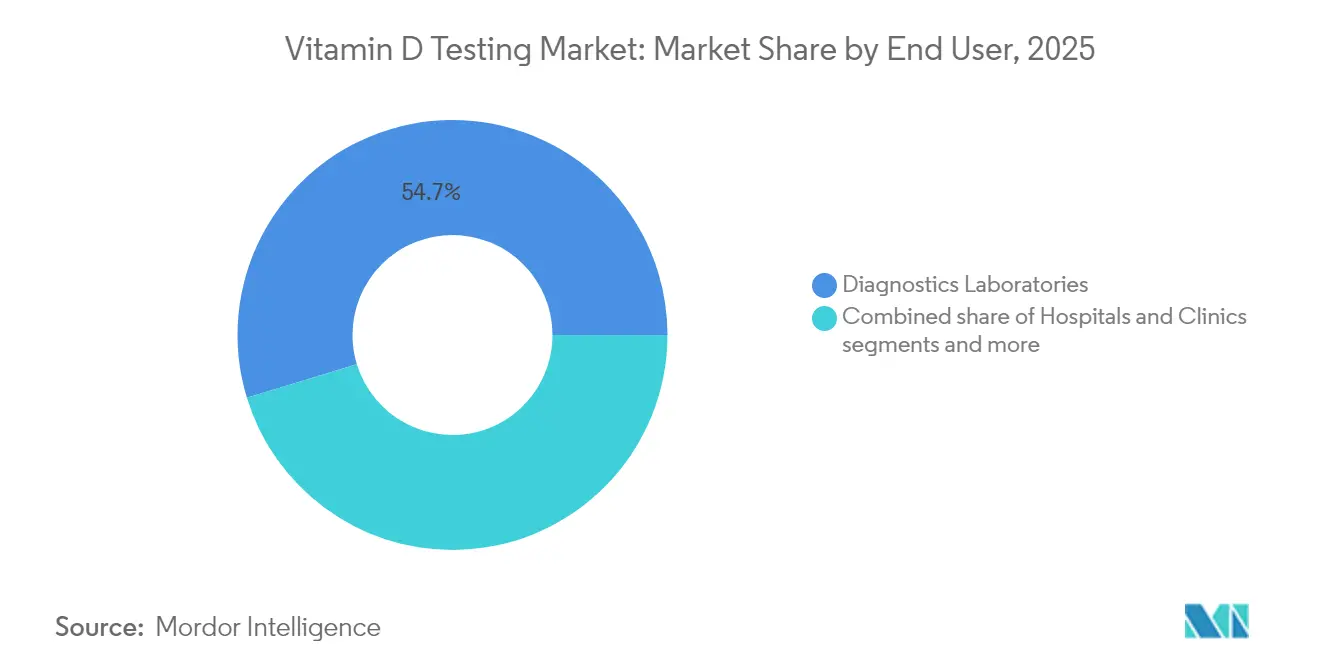
- By end user, diagnostic laboratories commanded 54.72% share of the Vitamin D testing market size in 2025 whereas home-care and remote testing is growing at a 9.78% CAGR.
- By sample type, serum/plasma represented 61.10% share of the Vitamin D testing market in 2025 and dried blood spot collection is advancing at a 10.25% CAGR through 2031.
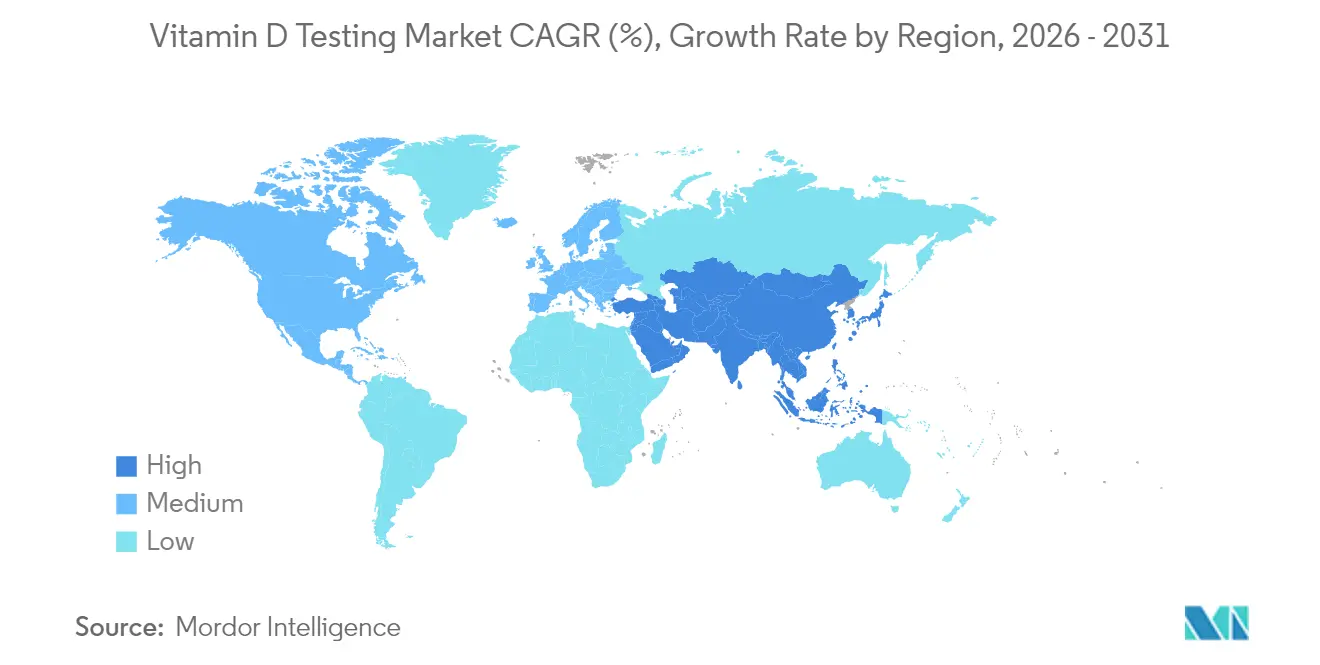
- By geography, North America led with 41.80% of the Vitamin D testing market size in 2025, while Asia-Pacific records the fastest 10.74% CAGR toward 2031.
Note: Market size and forecast figures in this report are generated using Mordor Intelligence’s proprietary estimation framework, updated with the latest available data and insights as of 2026.
Market Trends and Insights
Drivers Impact Analysis of Vitamin D Testing Market*
| Driver | (~) % Impact on CAGR Forecast | Geographic Relevance | Impact Timeline |
|---|---|---|---|
| Rising burden of vitamin-D deficiency diagnoses | +2.1% | Global, highest in MENA and Northern Europe | Medium term (2-4 years) |
| Shift to preventive healthcare & routine screening | +1.8% | North America and EU, expanding into urban APAC | Long term (≥ 4 years) |
| CLIA automation lowering per-test cost | +1.5% | Global, led by high-volume laboratory markets | Short term (≤ 2 years) |
| Emerging reimbursement codes in Europe & U.S. | +1.2% | North America and EU, selective APAC markets | Medium term (2-4 years) |
| AI-enabled at-home micro-sample kits | +0.9% | North America, Western Europe, urban APAC | Long term (≥ 4 years) |
| National fortification policies prompting surveillance testing | +0.7% | Canada, Finland, UK policy regions | Medium term (2-4 years) |
| Source: Mordor Intelligence | |||
Rising Burden of Vitamin-D Deficiency Diagnoses
Roughly 1 billion people live with inadequate vitamin D levels, with prevalence soaring to 82.1% among Black Americans and 69.2% in Latino communities. Clinical guidelines published by the Endocrine Society in 2024 created precise testing criteria for high-risk populations, which paradoxically expanded targeted demand even while discouraging universal screening. Providers increasingly embed vitamin D assessment in chronic-disease management programs for diabetes, cardiovascular disease, and osteoporosis, sustaining growth of the Vitamin D testing market. The confluence of aging populations, limited sun exposure in urban lifestyles, and malabsorption disorders further reinforces systematic screening in many regions. Government surveillance linked to food-fortification programs adds another steady testing stream, translating population-health priorities into laboratory demand.
Shift to Preventive Healthcare & Routine Screening
Value-based reimbursement models encourage early detection, making vitamin D measurement a routine metric in preventive health check-ups covered by Medicare Advantage plans and a growing list of private insurers. Direct-to-consumer laboratory spending is poised to surpass USD 9 billion by 2033, giving consumers unprecedented power to order tests without physician mediation. Employers embed vitamin D tracking in corporate wellness dashboards, encouraging regular employee monitoring that generates predictable sample volumes. Senior-care programs integrate deficiency checks into fall-prevention initiatives, enhancing adherence to supplementation regimens. Collectively these behavioral and policy shifts underpin sustained expansion of the Vitamin D testing market.
CLIA Automation Lowering Per-Test Cost
Fully robotic CLIA systems can process more than 3,600 assays per hour, driving economies of scale while trimming labor expenditures. Platforms such as Roche’s cobas 8000 handle up to 1,000 samples each hour and require minimal water, cutting utilities and biohazard waste. Lower costs empower payers to authorize broader testing, supporting higher throughput facilities and consolidating smaller providers under reference-lab networks. Analytical reliability also rises because AI modules continuously flag outlier data, lowering repeat-test rates. These efficiency gains reinforce the competitive stance of established laboratories and spur additional uptake across emerging markets, accelerating revenue for the Vitamin D testing market.
Emerging Reimbursement Codes in Europe & U.S.
Introduction of CPT code 82306 established uniform billing for 25-hydroxyvitamin D assays in the United States, eliminating many administrative ambiguities that previously discouraged routine claims submission. Medicare now reimburses testing for chronic kidney disease, malabsorption, and osteoporosis, while European payers embed vitamin D monitoring into integrated care bundles. Harmonized reimbursement structures narrow patient out-of-pocket obligations and solidify predictable revenue for labs, bolstering the Vitamin D testing market across multiple geographies. As private insurers adopt similar coverage, laboratory cashflows stabilize, lowering investment risk for automation and advanced analytics procurement.
Restraints Impact Analysis of Vitamin D Testing Market*
| Restraint | (~) % Impact on CAGR Forecast | Geographic Relevance | Impact Timeline |
|---|---|---|---|
| Pricing pressure from bundled wellness panels | -1.4% | North America & EU, high-competition markets | Short term (≤ 2 years) |
| Variability between assay methods | -0.9% | Global, particularly affecting multi-site laboratories | Medium term (2-4 years) |
| Dried-blood-spot sample stability concerns | -0.6% | Global, highest impact in remote/tropical regions | Medium term (2-4 years) |
| Regulatory scrutiny over direct-to-consumer claims | -0.8% | Global, strictest in EU and select US states | Medium term (2-4 years) |
| Source: Mordor Intelligence | |||
Pricing Pressure from Bundled Wellness Panels
Volume-based contracting has encouraged insurers to reimburse comprehensive metabolic screens that include vitamin D for a single all-in price, compressing margins on individual assays. Consolidated national labs can leverage scale, but regional independents often absorb lower reimbursement, forcing them to renegotiate supplier contracts. Consumer-direct platforms mirror this pressure by marketing multi-analyte panels at discount prices to gain share, intensifying price competition in the Vitamin D testing market. Larger players counteract by automating workflows and cross-selling allergy or hormone panels to maintain profitability.
Regulatory Scrutiny over Direct-to-Consumer Claims
The FDA’s phased regulation of laboratory-developed tests reclassifies many vitamin D assays as medical devices, compelling direct-to-consumer companies to invest in quality-system compliance and clinical validation. European marketing rules further restrict health claims, limiting promotional freedom. Diverse state laws in the United States introduce additional complexity and potential fines for non-compliance. These governance hurdles slow product launches and raise operational costs, tempering short-term expansion of the Vitamin D testing market in consumer channels.
*Our forecasts treat driver/restraint impacts as directional, not additive. The impact forecasts reflect baseline growth, mix effects, and variable interactions.
Vitamin D Testing Market Segment Analysis
By Product Type:
Services Growth Outpaces Traditional ReagentsThe services arm of the Vitamin D testing market expanded at an 8.87% CAGR toward 2031, propelled by hospital outsourcing and reference-lab consolidation. Reagents and kits still delivered 45.05% Vitamin D testing market share in 2025, yet their revenue margins tightened because automated systems consume fewer consumables per assay. Instruments represent the smallest revenue slice, but every analyzer placement establishes a long-tail reagent annuity that underpins supplier profitability. Laboratories unable to fund automation increasingly subcontract specialized vitamin D panels to service providers, reinforcing service-segment momentum. Acquisitions like Quest Diagnostics’ USD 1 billion LifeLabs deal highlight the race for network scale that amplifies purchasing leverage and geographic reach.
Reagent manufacturers respond by innovating high-sensitivity chemistries compatible with both CLIA and emerging LC-MS/MS platforms, safeguarding demand even as per-test consumption falls. Digital integration services that link analyzers to laboratory information systems deliver incremental revenue while differentiating suppliers. Meanwhile, point-of-care service models flourish in primary-care clinics where rapid readouts inform supplementation decisions during a single visit, extending the Vitamin D testing market beyond central laboratories.

By Technology:
LC-MS/MS Disrupts CLIA DominanceCLIA produced 38.25% of 2025 revenue thanks to low running costs and fully automated operation. Yet LC-MS/MS achieved a 9.30% CAGR as new systems blend mass-spectrometry precision with walk-away automation that mitigates labor intensity. The Vitamin D testing market size associated with LC-MS/MS platforms is set to grow steadily because clinicians demand higher specificity in complex cases such as chronic kidney disease. FDA scrutiny of laboratory-developed tests pushes labs toward standardized LC-MS/MS kits, accelerating uptake. ELISA retains a foothold in cost-sensitive settings, while radio-immunoassay declines due to radiological waste protocols.
Early adopters report that LC-MS/MS reduces repeat testing triggered by cross-reactivity in CLIA assays, thereby improving clinical confidence. Suppliers now bundle cloud-based calibration updates that simplify maintenance, widening accessibility for mid-size laboratories. As reimbursement remains method agnostic, laboratories can align platform selection with case-mix complexity, fueling multi-platform coexistence that broadens the Vitamin D testing market.
By End User:
Home-Care Disruption AcceleratesDiagnostic laboratories maintained 54.72% share of the Vitamin D testing market in 2025, but home-care and remote testing posted a 9.78% CAGR through 2031 as consumers embraced convenience and data ownership. Telemedicine consults frequently bundle vitamin D assessments into chronic-care regimens, driving kit shipments directly to patient homes. Hospitals confronted by staffing shortages lean on reference labs for non-urgent micronutrient testing, diverting volume away from in-house benches. The Vitamin D testing market size for remote channels will keep climbing because payers acknowledge the cost-effectiveness of decentralized monitoring.
Equipment makers now collaborate with courier networks to guarantee overnight delivery of dried blood spot mailers, minimizing turnaround anxiety. Clinicians gain electronic access to trend graphs that flag relapse risks, enhancing care coordination. Such service evolution expands the Vitamin D testing market while redefining competitive boundaries between diagnostic firms, digital-health startups, and retail pharmacies.
Geography Analysis
North America, APAC and EMEA Vitamin D Testing Market
North America generated 41.80% of 2025 revenue thanks to broad insurance coverage and advanced automation infrastructure. Asia-Pacific, however, is the growth engine with a 10.74% CAGR anchored by urbanization, rising middle-class health awareness, and private-sector diagnostic investment. Organized lab networks in India penetrate tier-3 towns, while Chinese demand swells alongside nutraceutical consumption trends. Europe continues steady expansion through fortification-driven surveillance programs and aging demographics, but reimbursement austerity limits upside. Middle East and Africa markets show early promise as governments modernize healthcare and grapple with surprisingly high deficiency in sun-rich climates.
Regulatory Landscape
Vitamin D testing is shaped by in vitro diagnostic (IVD) device rules, laboratory oversight, and payer medical-necessity criteria, which in turn influence method selection and uptake by end users. In the United States, CMS coverage and billing practices affect test ordering, and many settings impose tighter medical-necessity expectations that emphasize documented indications such as osteoporosis and renal disease rather than broad screening. At the assay-performance level, the CDC Vitamin D Standardization-Certification Program (VDSCP) continues to serve as a reference point for comparability across platforms, addressing persistent variability when clinical deficiency thresholds differ across guidelines and practice patterns.
Regulatory clarity for newer workflows is also progressing through CLIA complexity categorization, which can expand where a method is operationally feasible. In September 2025, Roche reported CLIA Moderate Complexity categorization for its Ionify 25-Hydroxy Vitamin D Total test, signaling that automated mass spectrometry workflows are being positioned for broader routine-lab use rather than only specialized reference environments. At the same time, intensified scrutiny of direct-to-consumer health claims, along with wider U.S. framework discussions around laboratory-developed tests, increases the compliance burden for consumer-facing channels, pushing companies to strengthen validation, quality systems, and labeling discipline.
Value Chain Analysis
The vitamin D testing value chain starts with assay and instrument R&D (including immunoassay and LC-MS/MS workflows), followed by reagent manufacturing, instrument production, and software and connectivity enablement (middleware and LIS/EHR interfaces). Distribution is typically handled through direct sales to high-volume laboratories and hospital networks, plus regional distributors and group purchasing channels. Revenue is driven by an installed-base model, where analyzer placements create recurring pull-through for reagents, calibrators, and controls. Standardization programs such as the CDC VDSCP in the United States and method-comparability requirements also support demand for reference materials, verification protocols, and ongoing quality management.
Downstream, sample collection (serum/plasma and expanding dried blood spot workflows) feeds into testing by diagnostic laboratories, hospital labs, and increasingly home-care and remote testing services that combine kit logistics, courier or return mailers, and digital reporting portals. Automation is shifting value capture toward integrated platforms that reduce manual labor and variability, reinforcing the role of large suppliers and high-throughput labs. The move toward automated mass spectrometry, including workflows highlighted around cobas i601, also increases the importance of standardized kits, maintenance services, and application support so routine labs can adopt LC-MS/MS without deep specialist staffing.
Competitive Landscape
North America retains leadership through large reference-lab chains, comprehensive CPT coding, and recent acquisitions that widen branch footprints. The Vitamin D testing market size in this region benefits from Medicare coverage for high-risk cohorts, though price pressures from bundled wellness panels curb further upside.
Asia-Pacific’s double-digit expansion is supported by competitive manufacturing costs enabling affordable testing, while private insurance uptake fuels volume in metropolitan areas. Europe focuses on outcome-based care and food-fortification monitoring, embedding vitamin D assessment in public-health dashboards. In all regions, home-based testing is emerging as the universal growth lever that democratizes access and compresses turnaround times.
Competitive differentiation has shifted from assay menus toward data analytics, patient portals, and interoperability with electronic health records. Market leaders package population-health dashboards that present aggregated deficiency trends, helping insurers craft targeted supplementation campaigns. Partnerships between device startups and hospital systems spur ecosystem growth without compromising incumbent dominance, sustaining balanced rivalry within the Vitamin D testing market.
Vitamin D Testing Industry Leaders
-
F. Hoffmann-La Roche Ltd.
-
DiaSorin S.p.A.
-
Abbott
-
Siemens Healthcare GmbH
-
Thermo Fisher Scientific Inc.
- *Disclaimer: Major Players sorted in no particular order
Vitamin D Testing Market Companies Covered in this Report
- Abbott Laboratories
- Roche
- Siemens Healthineers
- Danaher
- Thermo Fisher Scientific
- DiaSorin
- Quest Diagnostics
- bioMérieux
- Bio-Rad Laboratories
- Ortho Clinical Diagnostics Holdings plc
- Grifols
- Randox Laboratories
- Mindray
- Tosoh
- Sysmex
- Eurofins
- ARUP Laboratories
- Cerba HealthCare SAS
- Unilabs AB
- Biomerica Inc.
Market Opportunities and Future Outlook
One clear whitespace is the operational mainstreaming of mass spectrometry vitamin D testing in routine clinical laboratories, where specificity advantages, including differentiation of D2 and D3 metabolites, can reduce cross-reactivity concerns associated with some immunoassays and support more complex-case workflows. The September 2025 CLIA Moderate Complexity categorization disclosed by Roche for its Ionify 25-Hydroxy Vitamin D Total test provides a direct pathway for broader placement of automated MS-based vitamin D assays in non-specialized U.S. labs, expanding the addressable installed base beyond reference laboratories. This shift also opens adjacent opportunities in calibration and quality programs, method harmonization services, and LIS connectivity that help multi-site networks keep results comparable across platforms.
A second opportunity track is emerging in service-centric and decentralized models where logistics and data integration become differentiators, not just the assay menu. Dried blood spot microsampling and home-care or remote testing workflows create additional customer acquisition routes through telehealth programs, employer wellness initiatives, and retail or clinic settings. At the same time, payers and providers look for standardized and reimbursable pathways, including CPT 82306 in the United States, that reduce administrative friction. Vendors that combine robust analytical performance with end-to-end kit fulfillment, chain-of-custody, and digital longitudinal reporting can compete for recurring volume as testing shifts from episodic deficiency checks toward ongoing monitoring in chronic-condition pathways.
Recent Industry Developments in Vitamin D Testing Market
- July 2026: DiaSorin reiterated its hospital-focused strategy for its immunodiagnostics specialty portfolio in corporate disclosures, reinforcing emphasis on core hospital lab menus that include vitamin D testing. The positioning supports share defense in mature markets where routine testing volumes are normalizing and competition increasingly centers on menu breadth, workflow integration, and hospital relationships.
- April 2026: DiaSorin highlighted 25-OH Vitamin D TOTAL as a core component of its LIAISON XL immunodiagnostic menu within the companys metabolic disorders portfolio. Keeping vitamin D as a featured, anchored assay in a high-throughput installed base supports recurring reagent pull-through and preserves routine testing visibility in hospital and large laboratory accounts.
- September 2025: Roche announced that its Ionify 25-Hydroxy Vitamin D Total test received CLIA Moderate Complexity categorization, positioning it for broader use across U.S. clinical laboratories. The development lowers operational barriers for automated mass spectrometry adoption in routine settings, strengthening the shift toward higher-specificity workflows alongside established immunoassay platforms.
Vitamin D Testing Market Report Scope and Research Methodology
Market Definition and Coverage
For this methodology, the vitamin D testing market covers revenue generated from laboratory and point of care testing services and related consumables used to measure vitamin D status, mainly through 25-hydroxyvitamin D and other clinically used vitamin D assays, across healthcare and diagnostic settings.
Scope exclusions: It does not include vitamin D supplements, therapies, fortification ingredients, or general endocrine panels where vitamin D is not separately priced.
Segments Covered in This Report
- By Product Type (Value)
- Reagent & Kits
- Instruments
- Services
- By Technology (Value)
- LC–MS/MS
- Chemiluminescence Immunoassay (CLIA)
- ELISA
- Radio-Immunoassay (RIA)
- Others
- By End User (Value)
- Diagnostic Laboratories
- Hospitals & Clinics
- Home-care & Remote Testing
- Others
- By Sample Type (Value)
- Serum / Plasma
- Whole Blood
- Dried Blood Spot
- Others
- By Geography (Value)
- North America
- United States
- Canada
- Mexico
- Europe
- Germany
- United Kingdom
- France
- Italy
- Spain
- Rest of Europe
- Asia-Pacific
- China
- India
- Japan
- South Korea
- Australia
- Rest of Asia-Pacific
- South America
- Brazil
- Argentina
- Rest of South America
- Middle East and Africa
- GCC
- South Africa
- Rest of Middle East and Africa
- North America
Data Sources, Market Sizing, and Validation
Desk Research
Desk work starts by setting the market boundaries and building a clean list of test methods and care settings where vitamin D tests are routinely ordered. Public sources are used to anchor the demand pool and care patterns, such as health statistics from agencies like the CDC, WHO, and OECD, along with guidance and laboratory standards from bodies such as the NIH Office of Dietary Supplements and CLSI.
We also use sources like peer reviewed clinical literature, customs and trade statistics for diagnostic reagents where available, and government procurement and reimbursement references to understand typical testing pathways and billing behavior. Company filings, investor presentations, and reputable health system or lab network publications help validate how testing volumes and platform adoption are changing over time. For gaps on company revenues and ownership structures, paid subscriptions focused on company financials, news, and patent databases are used selectively. The desk source list above is illustrative, and many other public and paid references were checked for data collection, validation, and clarification.
Primary Interviews and Surveys
Primary work is used to pressure test the model assumptions that desk sources cannot fully confirm, especially on how often tests are ordered, how pricing varies by channel, and how fast newer immunoassay and LC-MS workflows are being adopted. We speak with a mix of diagnostic laboratory managers, hospital lab leaders, clinicians involved in ordering decisions, and distributor or channel participants across major regions so our final sizing is grounded in how testing is actually delivered and paid for.
Distribution of primary research fieldwork respondents
| Company type | Respondent position | Region |
|---|---|---|
| Top tier: 31% | CXOs: 19% | APAC: 43% |
| Mid tier: 49% | Functional/Unit leaders: 28% | EMEA: 36% |
| Smaller Players: 20% | Managers: 53% | Americas: 21% |
Market-Sizing & Forecasting
Sizing starts with a top-down build that reconstructs the addressable testing pool using a mix of population and risk cohorts, testing guidance and screening behavior, and the share of patients that typically reach diagnostic confirmation through labs. Once the demand pool is framed, average revenue per test is applied by setting to reflect price differences between hospital labs, independent labs, and point of care pathways.
To keep the totals realistic, the outputs are then cross checked with selective bottom-up approximations from sampled laboratory and assay supplier revenue signals, along with channel checks on typical test menu pricing and annual test volumes. Key inputs that were treated as moving variables include vitamin D deficiency awareness and screening intensity, shifts between immunoassay and LC-MS testing, automation penetration in high throughput labs, reimbursement and out of pocket mix, and regional differences in preventive testing practices.
For forecasting, scenario analysis is used with a base case anchored on interview consensus, and then adjusted using time series smoothing on historical growth where the data shows stable ordering behavior. Where bottom-up signals are incomplete for smaller labs or fragmented countries, gaps are handled using proxy utilization rates and calibrated pricing bands, and then rebalanced to match the final demand pool totals.
Data Validation & Update Cycle
Validation is done through multiple checks so the market size does not rely on a single assumption. We compare model outputs with independent signals such as test adoption patterns reported in clinical literature, public health screening cues, and observed pricing ranges across channels, and then investigate outliers before sign-off.
The numbers go through stepwise analyst review, where large regional swings, sudden price shifts, and method mix changes are questioned and recalculated if needed. If a material change is spotted, such as a reimbursement update or a major change in testing practice, experts are re-contacted to confirm the direction and size of the impact. Reports are refreshed annually, with interim updates for material events, and a final pre-delivery pass is completed so clients receive the most current view.
Mordor Intelligence's Vitamin D Testing Market Size Measured Against Other Published Estimates
Published numbers for vitamin D testing often do not match because different studies count different revenue items, mix years, and treat pricing in their own way, which then shifts the final total. Differences also come from how much of the demand is tied to routine screening versus medically necessary testing, and whether regional adoption is assumed to move quickly or slowly.
The spread usually traces back to what is counted as market revenue (test services only versus services plus instruments), the choice of base year, and how average selling price is modeled across hospital labs, independent labs, and point of care settings. Some estimates also lean on a single growth rate across all regions, while others apply different uptake curves based on interview feedback and recent reimbursement signals, and then refresh currency conversion timing differently, which can change the USD value.
Benchmark comparison
| Source | Market Size | Gaps in Research Methodology |
|---|---|---|
| Mordor Intelligence | USD 1.04 B (2025) | |
| Industry Publisher A | USD 0.93 B (2025) | A lower total is commonly produced when pricing is kept conservative across channels and the model assumes slower growth in routine screening volumes, especially in emerging care settings, which compresses revenue per test. |
| Industry Publisher B | USD 0.85 B (2024) | This figure uses an earlier base year and can undercount when test volumes are not re-based to recent ordering behavior and when method mix shifts toward higher value workflows are not carried through consistently. |
The table shows that year selection and how test price and channel mix are treated explain most of the variance, and the model stays more stable when these inputs are updated and re-checked. Counting only paid vitamin D test revenue by setting, and then re-validating volumes and pricing with laboratory stakeholders before the forecast is locked in, is the key step applied by Mordor Intelligence.
Key Questions Answered in the Report
What is the current Vitamin D Testing Market size?
The Vitamin D Testing Market is projected to register a CAGR of 8.21% during the forecast period (2026-2031)
Who are the key players in Vitamin D Testing Market?
F. Hoffmann-La Roche Ltd., DiaSorin S.p.A., Abbott, Siemens Healthcare GmbH and Thermo Fisher Scientific Inc. are the major companies operating in the Vitamin D Testing Market.
Which is the fastest growing region in Vitamin D Testing Market?
Asia-Pacific is estimated to grow at the highest CAGR over the forecast period (2026-2031).
Which region has the biggest share in Vitamin D Testing Market?
In 2025, the North America accounts for the largest market share in Vitamin D Testing Market.
What years does this Vitamin D Testing Market cover?
The report covers the Vitamin D Testing Market historical market size for years: 2019, 2020, 2021, 2022, 2023 and 2024. The report also forecasts the Vitamin D Testing Market size for years: 2026, 2027, 2028, 2029, 2030 and 2031.