
Virtual Reality In Education Market Size and Share
Market Overview
| Study Period | 2020 - 2031 |
|---|---|
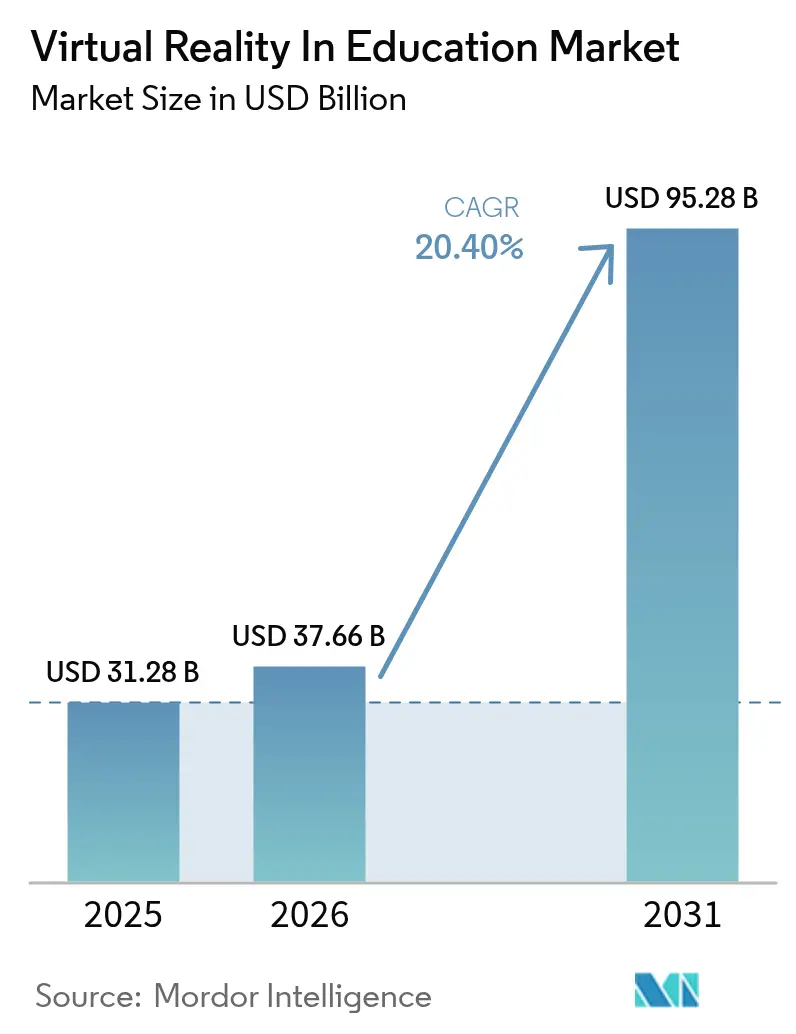
| Market Size (2026) | USD 37.66 Billion |
| Market Size (2031) | USD 95.28 Billion |
| Growth Rate (2026 - 2031) | 20.40 % |
| Fastest Growing Market | Asia Pacific |
| Largest Market | North America |
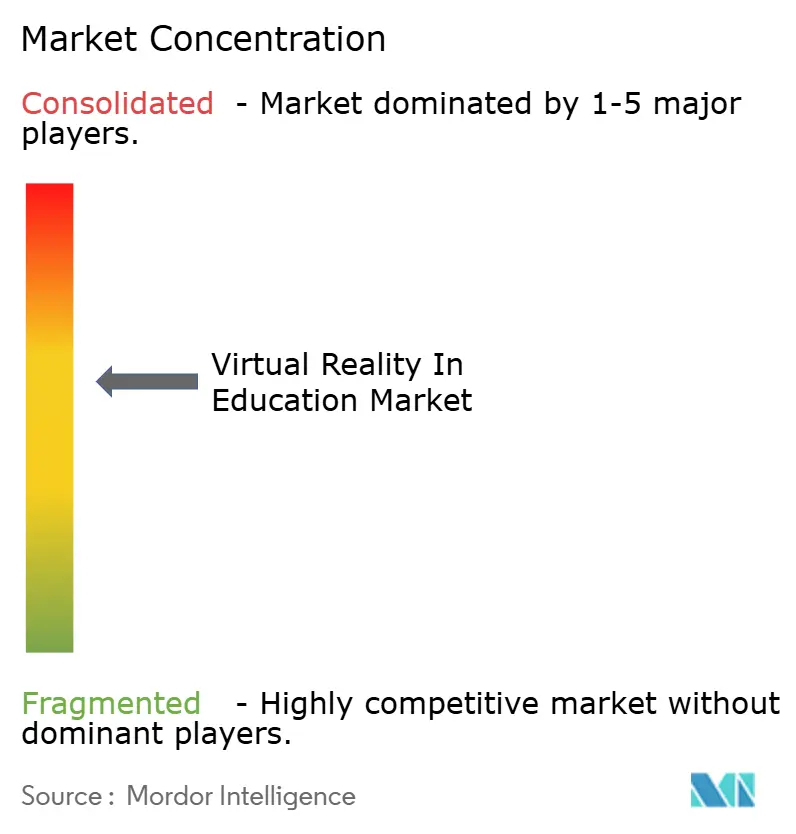
| Market Concentration | Medium |
Major Players *Disclaimer: Major Players sorted in no particular order Image © Mordor Intelligence. Reuse requires attribution under CC BY 4.0. | |
Virtual Reality In Education Market Analysis by Mordor Intelligence
The Virtual Reality In Education Market size was valued at USD 31.28 billion in 2025 and estimated to grow from USD 37.66 billion in 2026 to reach USD 95.28 billion by 2031, at a CAGR of 20.4% during the forecast period (2026-2031).
Lower headset prices, sizable government grants, and measurable improvements in learner performance continue to propel the virtual reality in education market, especially as corporations adopt immersive training programs that reduce seat time by up to 75% while quadrupling knowledge retention. Hardware still supplies most revenue, but service-oriented subscription packages are expanding fastest as institutions seek turnkey content and analytics. North America leads the adoption due to the Biden–Harris Administration’s USD 277 million innovation fund, whereas the Asia Pacific accelerates on the back of Chinese and Japanese infrastructure programs. Competitive rivalry is moderate, as large platforms such as Meta and Microsoft contend with specialists like zSpace and Labster, which pair curriculum-aligned content with cost-effective deployment models.
Key Report Takeaways
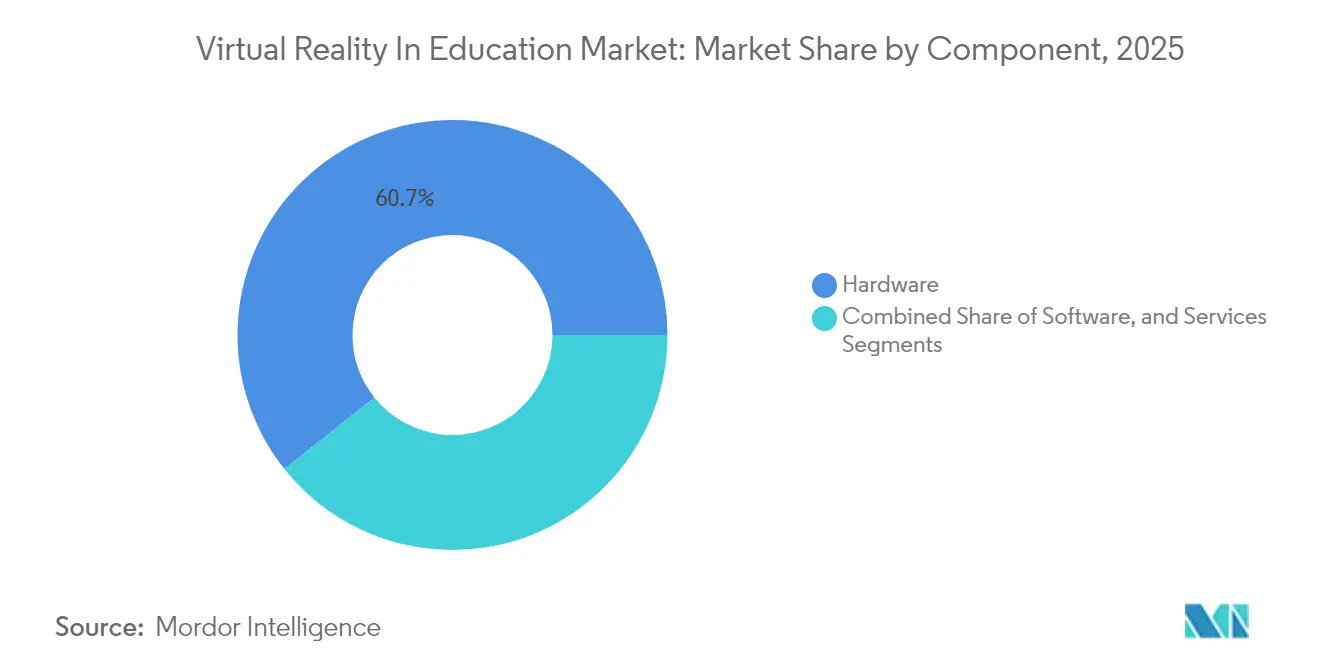
- By component, hardware led with 60.72% of the virtual reality in education market share in 2025 while services are forecast to expand at 22.2% CAGR through 2031.
- By end user, academic institutions held 64.62% of the virtual reality in education market size in 2025; corporate training is advancing at 22.9% CAGR to 2031.
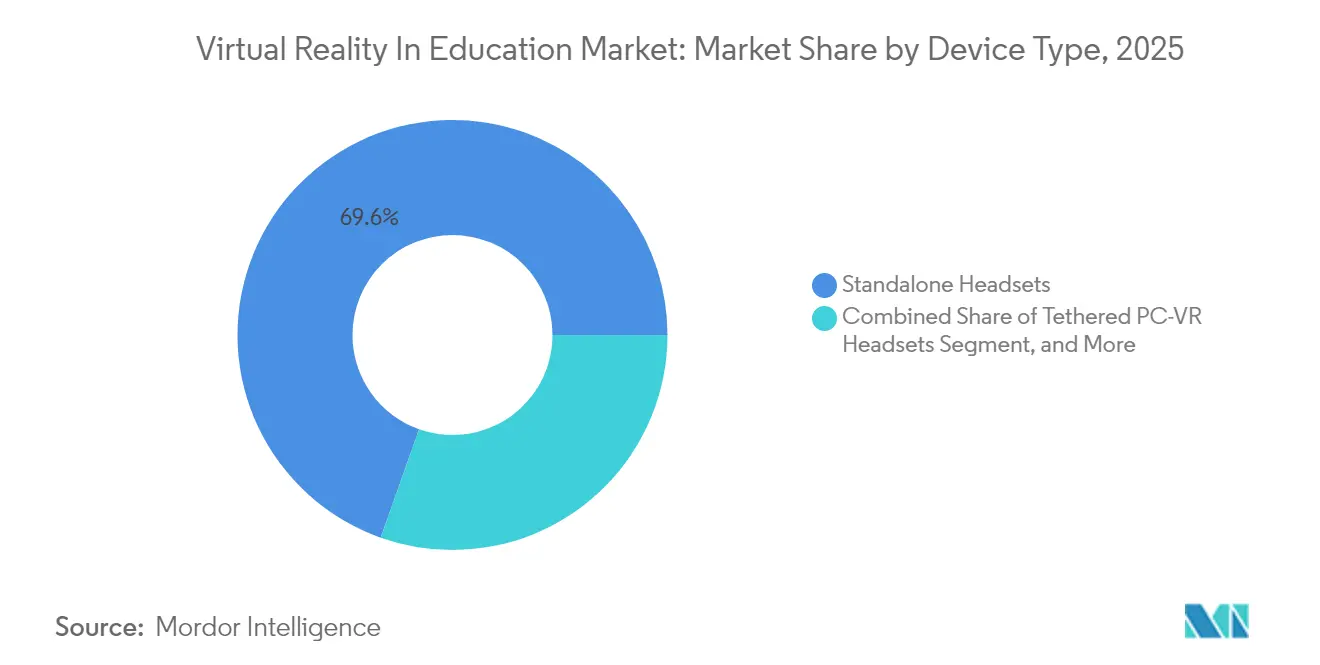
- By device type, standalone headsets dominated the virtual reality in education with 69.58% share in 2025, while mixed-reality HMDs are projected to grow at 23.2% CAGR through 2031.
- By application area, academic institutions held 36.45% of the virtual reality in education market size in 2025; Soft-skills is advancing at 21.4% CAGR to 2031.
- By geography, North America accounted for 38.95% of the virtual reality in education market size in 2025; Asia Pacific is anticipated to record the highest regional CAGR at 21.5% to 2031.
Note: Market size and forecast figures in this report are generated using Mordor Intelligence’s proprietary estimation framework, updated with the latest available data and insights as of 2026.
Market Trends and Insights
Drivers Impact Analysis of Virtual Reality In Education Market*
| Driver | (~) % Impact on CAGR Forecast | Geographic Relevance | Impact Timeline |
|---|---|---|---|
| Rising demand for interactive and personalized learning | +3.2% | Global, with early adoption in North America and EU | Medium term (2-4 years) |
| Greater stakeholder acceptance from higher engagement | +2.8% | Global, strongest in APAC and North America | Short term (≤ 2 years) |
| Falling prices and ubiquity of standalone VR headsets | +4.1% | Global, with cost sensitivity highest in APAC and Latin America | Short term (≤ 2 years) |
| Government/Institutional EdTech funding post-COVID | +3.5% | North America, EU, and China leading initiatives | Medium term (2-4 years) |
| Integration of eye-tracking analytics for adaptive VR | +2.3% | North America and EU early adopters, APAC following | Long term (≥ 4 years) |
| WebXR standards lowering total cost of ownership | +1.9% | Global, with developer concentration in North America and EU | Long term (≥ 4 years) |
| Source: Mordor Intelligence | |||
Rising Demand for Interactive and Personalized Learning
Institutions increasingly value immersive lessons that adapt to diverse learning styles, with studies showing VR learners achieve 275% higher confidence and complete courses four times faster than classroom cohorts. Universities highlight gaps in design-thinking skills within current VR curricula, opening opportunities for providers that combine technical rigor with pedagogy.[1] AI-driven engines tailor content to each learner; zSpace’s Career Coach AI, for instance, matches local labor-market data to personalized study pathways[2] Controlled virtual environments also reduce anxiety for students with emotional impairments while boosting retention. As learner-centric models move mainstream, the virtual reality in education market becomes core infrastructure for institutions seeking improved outcomes.
Greater Stakeholder Acceptance from Higher Engagement
Quantified gains are persuading administrators, parents, and corporate L&D heads alike. Nursing programs see 95% participation when scenarios run in VR versus 15% in traditional labs. Manufacturing firms report 43% drops in workplace injuries after VR safety drills. Classroom engagement spikes in mathematics when students manipulate 3-D objects that clarify abstract concepts. Meta’s program with 13 universities demonstrates institutional confidence, creating reference sites that spur peer adoption. These outcomes generate a virtuous cycle of investment and acceptance for the virtual reality in education market.
Falling Prices and Ubiquity of Standalone VR Headsets
Entry devices such as Quest 2 remain under USD 299, aligning with the sub-USD 400 threshold most districts require for bulk purchase. Standalone form factors erase the need for high-end PCs, slashing total cost of ownership and simplifying IT support. Large-scale deployments, East Renfrewshire Council equipped every Scottish school with ClassVR units, illustrate affordability-driven expansion. Google’s USD 250 million stake in HTC VIVE should intensify price competition and accelerate hardware improvements. As price points continue to fall, the addressable base for the virtual reality market in education broadens across emerging economies.
Government/Institutional EdTech Funding Post-Pandemic
Post-pandemic recovery plans include sizable VR earmarks. The European Commission has allocated EUR 1.3 billion for digital skills programs between 2025-2027, explicitly citing virtual worlds in education. The U.S. National Science Foundation’s RITEL scheme sets aside USD 25 million for immersive-learning research.[3]China’s provinces collectively issued VR tenders exceeding USD 15 million in 2025 targeting vocational campuses. Japan’s DX High School program offers grants of JPY 10 million per campus to upgrade digital curricula Such policies embed VR within national education strategies, offering long-term stability to the virtual reality in education market.
Restraints Impact Analysis of Virtual Reality In Education Market*
| Restraint | (~) % Impact on CAGR Forecast | Geographic Relevance | Impact Timeline |
|---|---|---|---|
| Scarcity of quality curriculum-aligned VR content | -2.7% | Global, most acute in non-English speaking regions | Medium term (2-4 years) |
| High upfront and maintenance costs for institutions | -3.4% | Developing economies and budget-constrained districts | Short term (≤ 2 years) |
| Biometric data-privacy concerns in classrooms | -1.8% | EU under GDPR, US under FERPA/COPPA frameworks | Long term (≥ 4 years) |
| Teacher training gaps and pedagogical resistance | -2.9% | Global, with rural and under-resourced areas most affected | Medium term (2-4 years) |
| Source: Mordor Intelligence | |||
Scarcity of Quality Curriculum-Aligned VR Content
Many applications prioritize entertainment over pedagogy, leaving educators short of materials that match learning standards, especially outside English-speaking markets. Teachers struggle to locate VR modules that embed assessment tools and constructivist methods, hampering adoption despite hardware availability. Specialized domains such as medicine need regulatory compliance, yet the pipeline of validated scenarios remains thin. Partnerships like Pearson–XR Bootcamp illustrate early progress but are insufficient to satisfy global demand. Until content libraries scale, growth of the virtual reality in education market will trail underlying hardware capability.
Teacher Training Gaps and Pedagogical Resistance
Surveys reveal that most current VR professional-development programs concentrate on natural sciences and younger faculty, sidelining other subjects and veteran teachers. Educators cite concerns over dizziness, classroom management, and unclear instructional value. Programs like Unity’s 30-hour “Create with VR for Educators” course address skills shortages but scale remains limited relative to global need. Peer-support networks such as “Educators in VR” help diffuse best practices yet cannot replace formal training. Bridging these gaps is essential for sustained expansion of the virtual reality in education market.
*Our forecasts treat driver/restraint impacts as directional, not additive. The impact forecasts reflect baseline growth, mix effects, and variable interactions.
Virtual Reality In Education Market Segment Analysis
By Component:
Hardware Dominance Shifts to Service ModelsHardware captured 60.72% of the virtual reality in education market share in 2025 on the strength of device rollouts across schools and training centers. However, the services segment is on pace for 22.2% CAGR as institutions favor subscription bundles that bundle content, device management, and analytics. The virtual reality in education market size tied to services is poised to overtake software revenue approaching 2031. Standalone headset affordability keeps hardware relevant, yet platform vendors are already bundling perpetual updates, reducing replacement cycles.
Subscription models also mitigate capital-expenditure barriers for districts with limited budgets. ArborXR’s shift into learning analytics and zSpace’s AI-powered guidance tools illustrate how vendors convert hardware footholds into recurring-revenue ecosystems. Training and consulting services that improve instructional design now factor prominently in RFPs. These patterns signal a pivot toward outcomes-based procurement, reinforcing recurrent income streams across the virtual reality industry.

By End User:
Corporate Training Outpaces Academic AdoptionAcademic institutions still own 64.62% of the virtual reality in education, reflecting early grant-funded pilots across K-12 and universities. Yet corporate training advances at 22.9% CAGR, propelled by measurable ROI in safety, compliance, and customer-service scenarios. The virtual reality in education market size attributable to enterprises is projected to approach parity with academia by 2031. Corporations in healthcare and mining have logged 40%-plus error reductions after immersive programs, shortening payback periods.
Enterprises champion soft-skills and product-knowledge modules, fueling demand for rapid-authoring tools and analytics integrations. Academic growth continues but faces budget cycles and curriculum-approval processes. For vendors, diversified portfolios that address both segments offer resilience against economic swings within the virtual reality industry.
By Device Type:
Standalone Dominance with Mixed-Reality AccelerationStandalone units led with 69.58% share as their cable-free form factor aligns with classroom realities. Mixed-reality headsets are forecast to post 23.2% CAGR, spurred by Apple Vision Pro and upgraded HoloLens editions that merge physical and digital contexts. The virtual reality in education market size related to standalone units will keep expanding, but their share will gradually cede to mixed-reality devices as costs converge.
Teachers value simplicity; thus device-management platforms like ArborXR that deliver remote updates and content locking are gaining traction. High-end tethered rigs remain in specialized labs for surgical and engineering simulations. Over time, falling silicon prices and cloud rendering should blur device categories, accelerating feature convergence across the virtual reality industry.
By Application Area:
STEM Foundation with Soft-Skills AccelerationSTEM disciplines comprised 36.45% of application revenue in 2025 as 3-D visualization naturally improves comprehension of molecular structures and mechanical systems. Soft-skills scenarios now log the fastest expansion at 21.4% CAGR, mirroring corporate focus on leadership and communication competencies. The virtual reality in education market size attached to STEM tracks steady grant funding, whereas soft-skills growth depends on enterprise subscription renewals.
Medical-training platforms deliver validated results, such as 26% knowledge gains after a single surgical module. Language learning in VR receives venture capital, evidenced by Immerse’s USD 9 million round to build spatial language labs. As pedagogical research broadens, cross-disciplinary curricula will fuel balanced growth for the virtual reality industry.
Geography Analysis
North America Virtual Reality in Education Market
North America retained 38.95% of 2025 revenue thanks to robust grant programs and a mature EdTech ecosystem. The Administration’s USD 277 million innovation grants earmark immersive algebra tools, while the National Science Foundation commits USD 25 million to R&D, seeding university partnerships. Corporate uptake spans healthcare, retail, and skilled trades as companies such as Interplay Learning scale VR modules for talent shortages. These forces keep the virtual reality market in education expanding at a healthy clip, though growth moderates as penetration rises.
APAC Virtual Reality in Education Market
Asia Pacific is set to log the fastest regional CAGR of 21.5% through 2031. China’s provinces issued tenders exceeding USD 15 million for vocational VR labs in 2025 alone, while Japan’s DX High School scheme funds up to JPY 10 million per campus for digital upgrades. South Korean institutions deploy VR to cut equipment costs in technical training, an approach highlighted by World Bank researchers. These coordinated policies accelerate classroom integration, positioning Asia Pacific to narrow its gap with North America in the virtual reality in education market.
Europe, South America and Middle East Virtual Reality in Education Market
Europe benefits from the Digital Europe Programme’s EUR 1.3 billion allocation and EUR 108 million for specialist academies that include virtual-worlds curricula. Scotland’s council-wide ClassVR rollout shows regional bodies embracing systemic procurement. Emerging markets in South America and the Middle East follow as hardware prices dip below USD 300, though infrastructure constraints still curb immediate uptake. Overall, policy alignment and funding density remain the primary predictors of regional traction for the virtual reality in education market.

Regulatory Landscape
Regulation for VR in education is shaped primarily by data protection and child-safety rules, plus education-technology standards that govern classroom deployment and procurement. In the European Union, GDPR obligations intensify as VR programs add eye tracking and other biometric signals, while the European Commission's Digital Education Action Plan (2021-2027) provides the policy umbrella for integrating emerging technologies into learning systems. The Commission's Web 4.0 and Virtual Worlds strategy (COM(2023)442) also elevates interoperability and open standards as policy goals, influencing platform selection and content portability for public-sector education buyers.
In the United States, privacy and student-data requirements under FERPA and COPPA intersect with growing public-sector XR pilots and federal policy activity. Delaware introduced legislation to establish an Artificial Intelligence and Extended Reality (XR) in Schools Pilot Program that covers device procurement, maintenance, and professional development, signaling more formalized, evidence-driven adoption pathways at the state level. At the federal level, the 119th Congress introduced the United States Leadership in Immersive Technology Act of 2025 (H.R.2321/S.1106) to form an Immersive Technology Advisory Panel to assess economic and educational impacts, while classroom implementation is increasingly mapped to recognized frameworks such as the ISTE Standards 2024 (v4.02), which are referenced by state entities including the Washington Office of Superintendent of Public Instruction.
Value Chain Analysis
The value chain begins with enabling components and devices (displays, optics, sensors, processors) assembled into standalone VR headsets and mixed-reality HMDs by OEMs such as Meta, HTC, Lenovo, Samsung, and Microsoft. Platform and middleware layers then provide identity, device provisioning, app distribution, and performance tooling, increasingly delivered through cloud-managed stacks (for example, Azure-linked deployments for enterprise training). Content creation and simulation development sits upstream of institutional deployment, spanning 3D asset pipelines, authoring tools, learning-experience design, and assessment analytics, with providers such as EON Reality and Lobaki building curriculum-tied modules and skill simulators.
Distribution and implementation run through school districts, universities, corporate L&D teams, and channel partners that package hardware, software, and services into subscription bundles that include device management, content updates, and support. Recent ecosystem signals emphasize turnkey, institution-scale rollouts: EON Reality announced university partnerships in 2026 around accredited XR and AI learning ecosystems (UBT) and a Global Virtual Campus (University of Oradea), while Lobaki delivered a suite of 14 immersive VR chemistry experiences supported by National Science Foundation funding, illustrating the role of public grants in seeding validated educational content. Key bottlenecks remain curriculum alignment, teacher professional development, connectivity readiness for shared-device labs, and privacy governance where biometric-enabled analytics are used in classrooms.
Competitive Landscape
Market structure is moderately concentrated, with global tech platforms leveraging hardware ecosystems while niche specialists focus on curricular depth. Meta couples its Quest lineup with an education portal offering science and history modules, anchoring a broad device-plus-content stack. Microsoft positions HoloLens for high-value mixed-reality training in medicine and manufacturing, often co-selling through Azure. zSpace differentiates through AI-guided career tools, serving more than 3,700 institutions.
Labster leads in virtual labs and bolstered its nursing catalog by acquiring UbiSim to address clinical-training demand. ArborXR widened its moat by absorbing InformXR, adding analytics to its device-management suite. Apple’s Vision Pro entry drives mixed-reality competition; early pilots at Boston Children’s Hospital showcase premium use cases that justify higher pricing. Content localization remains a white space, especially for non-English curricula, prompting alliances between publishers and XR studios.
Data-privacy compliance is gaining strategic weight as schools navigate GDPR and FERPA rules on biometric capture, giving rise to consent-management startups like Secure Privacy. Vendors that can integrate privacy safeguards and deliver teacher-friendly analytics are best positioned to win repeat contracts. Overall, the competitive contest hinges on end-to-end solutions combining hardware affordability, standards-aligned content, and scalable professional development, all instrumental to the sustained growth of the virtual reality in education market.
Virtual Reality In Education Industry Leaders
-
Microsoft Corporation
-
HTC Corporation
-
Lenovo Group Limited
-
Meta Platforms, Inc.
-
Samsung Electronics Co., Ltd.
- *Disclaimer: Major Players sorted in no particular order
Virtual Reality In Education Market Companies Covered in this Report
- Meta Platforms, Inc.
- HTC Corporation
- Lenovo Group Limited
- Samsung Electronics Co., Ltd.
- Microsoft Corporation
- Sony Group Corporation
- Alphabet Inc.
- Pico Technology Co., Ltd.
- Valve Corporation
- Unity Technologies SF
- Epic Games, Inc.
- zSpace, Inc.
- EON Reality, Inc.
- Avantis Systems Ltd.
- Veative Labs Pvt. Ltd.
- Virtalis Holdings Limited
- Nearpod, Inc.
- Labster ApS
- Immerse VR Ltd.
- VictoryXR, Inc.
- Dreamscape Immersive, Inc.
- Alchemy Immersive Limited
Market Opportunities and Future Outlook
Institution-scale programs are creating whitespace for vendors that can combine curriculum-aligned content, device management, and measurable learning outcomes into procurement-ready bundles. In Asia, government-led initiatives are explicitly calling for immersive learning at scale, including a June 2026 announcement by the Tamil Nadu (India) School Education Department of a pilot covering AR/VR, AI, and coding across 5,000 government schools. Similarly, the Mauritius Digital Promotion Agency initiated the Virtual Reality in Primary Schools (VRPS) project under the 2025/2026 national budget, targeting rollout across 215 schools by 2029, favoring providers that can support multi-year deployments, localized content, and teacher enablement.
A second opportunity area is workforce-oriented immersive learning aligned to public funding and credential pathways, particularly where VR is positioned as skills infrastructure rather than an elective classroom tool. The U.S. Congress introduced H.R. 6968 to authorize immersive technology workforce development grants (USD 50 million annually for fiscal years 2026 through 2035), which increases demand for standardized training content, assessment instrumentation, and interoperable delivery across devices. On the supply side, AI-assisted content creation and instructional design is lowering time-to-content for institutions, reinforced by the EDUCAUSE 2026 Horizon Report's focus on new assessment models as AI changes traditional evaluation methods; this supports demand for VR experiences that produce authentic, process-based evidence of learning rather than only seat-time completion.
Recent Industry Developments in Virtual Reality In Education Market
- March 2026: EON Reality announced a partnership with the University for Business and Technology (UBT) to launch a university-accredited XR and AI learning ecosystem. The initiative underscores how higher-education buyers are moving from single-course pilots to ecosystem deployments that combine content, platforms, and credential pathways.
- February 2025: Meta made Meta for Education generally available, pairing Meta Quest devices with managed software designed for classroom administration and centralized headset management. This expanded the market for subscription-led deployments by reducing operational friction for schools and training centers that need scalable provisioning and policy controls.
- November 2024: Meta expanded its university digital-twin program to include the University of Leeds, the University of the Basque Country, and the University of Hannover. The additions strengthened the reference base for campus-scale immersive learning and helped normalize VR use cases tied to institutional infrastructure rather than one-off experiences.
Virtual Reality In Education Market Report Scope and Research Methodology
Market Definition and Coverage
This market covers revenue earned from using virtual reality experiences for teaching and training, including the related hardware, software, and services sold for education use cases across institutions and workplace learning.
Scope exclusions: We exclude non-education VR spending (such as consumer gaming and pure entertainment) even if it uses similar headsets and content tools.
Segments Covered in This Report
- By Component
- Hardware
- Software
- Services
- By End User
- Academic Institutions
- K-12 Learning
- Higher Education
- Corporate Training
- IT and Telecom
- Healthcare
- Retail and E-commerce
- Other Corporate Users
- Academic Institutions
- By Device Type
- Standalone Headsets
- Tethered PC-VR Headsets
- Smartphone-Enabled VR
- Mixed-Reality Head-Mounted Displays
- By Application Area
- STEM and Technical Education
- Medical and Healthcare Training
- Language and Arts Learning
- Vocational and Technical Skills
- Soft-Skills and Team Collaboration
- By Geography
- North America
- United States
- Canada
- Mexico
- South America
- Brazil
- Argentina
- Rest of South America
- Europe
- Germany
- United Kingdom
- France
- Spain
- Rest of Europe
- Asia-Pacific
- China
- India
- Japan
- South Korea
- ASEAN
- Rest of Asia-Pacific
- Middle East and Africa
- Middle East
- Saudi Arabia
- United Arab Emirates
- Turkey
- Rest of Middle East
- Africa
- South Africa
- Nigeria
- Kenya
- Rest of Africa
- Middle East
- North America
Data Sources, Market Sizing, and Validation
Desk Research
Desk research was used to map the demand pool and to put boundaries around what counts as education spend versus adjacent VR use. We reviewed public education spending signals and digital learning adoption inputs from sources such as the National Center for Education Statistics (NCES), OECD education indicators, UNESCO education datasets, and the World Bank education statistics.
To translate adoption into dollars, we also leaned on public product and procurement signals that help explain pricing and refresh cycles, including FCC equipment filings where relevant for devices, USPTO patent databases for headset and optics trends, and customs trade statistics for headset related import and export direction checks. Alongside these, we used company filings and investor presentations, reputable press coverage on school deployments, and selectively used paid subscriptions for company financials and intelligence plus patent databases to close gaps where public reporting was thin. The sources listed here are illustrative, and many other public and paid references were also consulted to collect, validate, and clarify data points.
Primary Interviews and Surveys
Primary work focused on validating what education buyers actually purchase and how they budget for it, since the same headset can be used across multiple end markets. We spoke with stakeholders across academic institutions and corporate training functions, and we also included input from solution implementers, device and content channel partners, and training designers across APAC, EMEA, and the Americas to confirm adoption pace and realistic price ranges.
Distribution of primary research fieldwork respondents
| Company type | Respondent position | Region |
|---|---|---|
| Top tier: 39% | CXOs: 17% | APAC: 41% |
| Mid tier: 43% | Functional/Unit leaders: 26% | EMEA: 35% |
| Smaller Players: 18% | Managers: 57% | Americas: 24% |
Market-Sizing & Forecasting
Our core sizing starts from the demand side. We reconstruct education technology adoption, device rollout patterns, and training usage into a spend pool by region, then convert that pool into market value.
Once the demand-based view is built, we check it with selective bottom-up approximations, including sampled headset shipments into education channels, typical classroom or lab kit sizes, and observed average selling prices by device class. We then adjust the total when early assumptions appear inconsistent with the implied headset and kit-level economics.
Inputs used in the model include device mix across standalone, tethered PC-VR, smartphone-enabled VR, and mixed-reality head-mounted displays, typical replacement cycles for headsets, the split of spending across hardware, software, and services, and the pace of content and device-management subscriptions being bundled with deployments. Application pull is also tracked, so STEM and technical learning, medical training, soft-skills collaboration, and vocational simulations were treated as separate demand signals before being rolled up. For forecasting, we apply scenario analysis so adoption curves, pricing drift, and institutional budget constraints can be stress-tested, and then we align the final path to what interviewees describe as feasible over the forecast period.
Data Validation & Update Cycle
Before totals are finalized, we run cross-checks between the model output and independent signals, including device shipment direction, public deployment announcements, and budget timing patterns that often create step-changes in education technology buying. Outliers are reviewed in multiple passes, and when a region or component shifts more than the range suggested by interviews and desk signals, we revisit the underlying assumptions and re-contact relevant experts.
The report is refreshed annually, and interim updates are triggered if a material change affects pricing, procurement access, or deployment scale in a meaningful way. Right before delivery, a last validation pass is completed so clients receive an updated view aligned to the latest available inputs.
Mordor Intelligence's Education Virtual Reality Vr Market Size Compared Against Other Published Estimates
Published market values for VR in education can vary widely because the boundary lines are drawn differently, and then the math is built on different demand signals. Differences usually come from what is counted as education spend, whether services are included, how fast pricing is assumed to decline, and how often the numbers are refreshed.
Key gap drivers in this space tend to be easier to pinpoint when you compare scope and units. Some estimates blend AR with VR, or they focus only on K-12 and higher education while excluding corporate training, which changes the addressable pool quickly. Others lean heavily on aggressive adoption curves without checking them against device mix shifts and subscription attach rates, which can inflate the forecast path even if the headline CAGR appears plausible.
Benchmark comparison
| Source | Market Size | Gaps in Research Methodology |
|---|---|---|
| Mordor Intelligence | USD 31.28 B (2025) | |
| Industry Newswire A | USD 2.40 B (2024) | Uses an AR/VR combined definition and reports a smaller 2024 base, which can understate VR-only education revenue when device, software, and services are not consistently separated. |
| Industry Newswire B | USD 47.28 B (2028) | Publishes a short-horizon forecast outcome with a very high stated growth rate, and the underlying bridge from adoption to dollars is not clearly tied to device mix, replacement cycles, and service subscription attachment. |
Education deployment signals and the observed shift toward bundled device-management and content subscriptions are the checks that keep Mordor Intelligence's 2025 value anchored to VR-specific education spending, rather than a blended XR total. The spread across publishers is mostly explained by scope boundaries (VR-only versus AR plus VR) and by how pricing and adoption are carried through the forecast, so a clear variable-led model makes the result easier to reproduce.
Key Questions Answered in the Report
How large is the virtual reality market in education today?
The virtual reality market in education recorded USD 37.66 billion in revenue during 2026 and is projected to hit USD 95.28 billion by 2031.
Which region leads adoption of VR in classrooms and training centers?
North America currently holds 38.95% of spending thanks to sizable U.S. federal grants and a mature EdTech ecosystem.
What is driving rapid growth in Asia Pacific?
Coordinated government funding in China, Japan, and South Korea for VR labs and curriculum upgrades is propelling Asia Pacific toward a 21.5% CAGR.
Which device category dominates deployments?
Standalone headsets account for 69.58% of shipments because they are cable-free, affordable, and easy for school IT teams to manage.
Why are services the fastest-growing component?
Institutions prefer subscription bundles that bundle content, analytics, and support, pushing services toward a 22.2% CAGR through 2031.