
Virtual Clinical Trials Market Size and Share
Market Overview
| Study Period | 2020 - 2031 |
|---|---|
| Market Size (2026) | USD 10.32 Billion |
| Market Size (2031) | USD 13.56 Billion |
| Growth Rate (2026 - 2031) | 5.62 % |
| Fastest Growing Market | Asia-Pacific |
| Largest Market | North America |
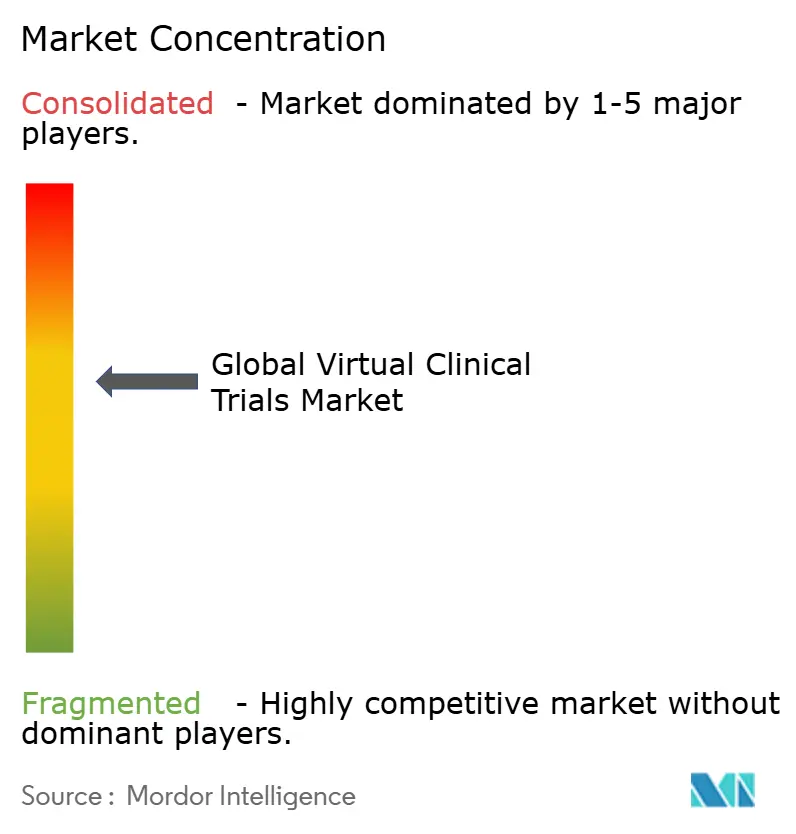
| Market Concentration | Medium |
Major Players *Disclaimer: Major Players sorted in no particular order Image © Mordor Intelligence. Reuse requires attribution under CC BY 4.0. | |
Virtual Clinical Trials Market Analysis by Mordor Intelligence
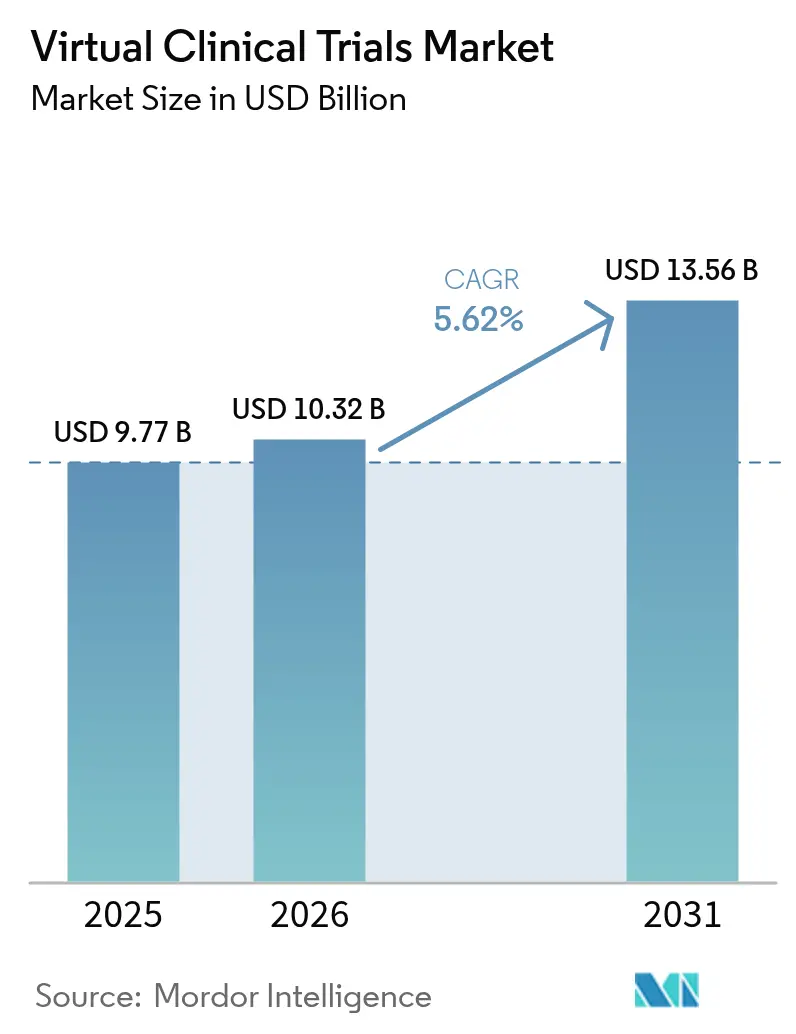
The virtual clinical trials market size in 2026 is estimated at USD 10.32 billion, growing from 2025 value of USD 9.77 billion with 2031 projections showing USD 13.56 billion, growing at 5.62% CAGR over 2026-2031. Stable regulatory frameworks in the United States and Europe, proven technology performance, and a clear value proposition beyond emergency use are guiding this growth path. Sponsors now view hybrid and fully remote trial models as a standard option rather than a contingency measure, which sustains demand even as pandemic pressures recede. Interventional studies still dominate spending, but rapid expansion of real-world evidence protocols is reshaping design decisions. North American incumbency, expanding Asia-Pacific capacity, and investment in cloud-enabled platforms continue to focus competitive strategy on geographic reach, speed to enrollment, and patient retention economics within the virtual clinical trials market.
Key Report Takeaways
- By study design, interventional trials led with 77.20% of the virtual clinical trials market share in 2025, whereas observational studies show the fastest 7.65% CAGR through 2031.
- By phase, Phase III held 48.60% of activity in 2025; Phase I is projected to expand at an 8.74% CAGR to 2031.
- By component, software captured 60.55% of 2025 revenue, while services post the highest 7.31% CAGR.
- By delivery mode, web-based deployment held 54.60% of spending in 2025, yet cloud platforms grow at 7.26% CAGR.
- By end-user, pharmaceutical companies accounted for 51.55% in 2025; medical device manufacturers lead growth at 7.33% CAGR.
- By indication, oncology contributed 37.85% share in 2025; neurology is advancing at a 9.28% CAGR.
- By geography, North America commanded 58.75% revenue in 2025, while Asia-Pacific rises fastest at 6.71% CAGR.
Note: Market size and forecast figures in this report are generated using Mordor Intelligence’s proprietary estimation framework, updated with the latest available data and insights as of 2026.
Market Trends and Insights
Drivers Impact Analysis of Virtual Clinical Trials Market*
| Driver | (`) % Impact on CAGR Forecast | Geographic Relevance | Impact Timeline |
|---|---|---|---|
| Escalating cost & complexity of site-based trials | +1.2% | Global, with acute pressure in North America and EU | Medium term (2-4 years) |
| Post-pandemic regulatory endorsement of decentralized models | +0.8% | Global, led by FDA and EMA | Short term (≤ 2 years) |
| Global rollout of high-speed connectivity & consumer health devices | +0.6% | Asia-Pacific core, spill-over to MEA | Long term (≥ 4 years) |
| Rising demand for patient-centric and inclusive participation | +0.9% | North America and EU diversity mandates | Medium term (2-4 years) |
| Oncology & rare-disease pipeline expansion requiring remote access | +0.7% | Global oncology clusters, high relevance in Asia-Pacific and Europe | Long term (≥ 4 years) |
| Sponsor/CRO investment surge in digital-trial efficiency tools | +0.5% | Global, concentrated in United States, Germany, and Japan | Short-to-medium term (≤ 4 years) |
| Source: Mordor Intelligence | |||
Escalating Cost & Complexity of Site-Based Trials
Traditional trial budgets continue to rise faster than R&D headcounts, pushing sponsors to search for structural savings. Medable reported 50% cost reduction and 200% faster enrollment across more than 300 trials when virtual techniques replaced physical sites. The Tufts Center calculated returns of USD 10 million for Phase II and USD 39 million for Phase III when decentralization cuts one year from timelines, largely by removing facility overhead and staff coordination. Sponsors now benchmark feasibility plans against those savings, so virtual deployment gains board-level attention. Cost sensitivity especially influences early-stage biotech firms that run multiple small cohorts concurrently. This economic driver is set to lift adoption until productivity gaps between virtual and physical execution narrow.
Post-Pandemic Regulatory Endorsement of Decentralized Models
The FDA’s September 2024 final guidance confirmed telehealth visits, local laboratory use, and digital health data capture as fully acceptable within the same regulatory standards applied to site-based trials[1]. One month later, the European Medicines Agency aligned via ICH E6(R3), effective July 2025, embedding decentralized quality-by-design principles[2]. These endorsements neutralized prior compliance fears and opened the path for cross-border protocols with consistent monitoring rules. As a result, global sponsors can now budget virtual designs as default options rather than pilot programs. Harmonization likewise encourages mid-size firms to place multi-country oncology or rare-disease studies under a single remote governance model, accelerating the virtual clinical trials market.
Global Rollout of High-Speed Connectivity & Consumer Health Devices
Asia-Pacific broadband expansion, cloud data center growth, and mature smartphone penetration establish the technical baseline for decentralized trials. Japan’s 7.29% digital health CAGR, coupled with government-backed Shionogi–Akili collaborations, demonstrates public-private momentum. Continuous physiological signals now stream directly from wearables, replacing episodic clinic vitals with high-frequency data. Sponsors integrate these feeds into primary endpoints, improving statistical power without adding patient visits. Robust connectivity also shortens file-transfer times for imaging and genomic datasets, which accelerates monitoring while satisfying data residency laws in large Asian territories. Cloud delivery gains credibility as regulators witness live data integrity checks, reinforcing confidence at ethics boards.
Rising Demand for Patient-Centric and Inclusive Participation
Regulators require enrollment plans that mirror disease prevalence across age, race, and geography. Virtual tools eliminate transportation barriers and time off work, letting trials recruit under-represented populations. Parexel’s direct-to-patient program recorded higher Black participant ratios than comparable site-based oncology studies while maintaining protocol adherence. Preference surveys show 90% of volunteers accept hybrid models if travel stays below one hour, confirming that flexibility outweighs full virtualization. Diversity mandates plus patient convenience converge to strengthen adoption momentum, particularly for chronic disease and elderly cohorts that struggle with repeated site visits.
Restraints Impact Analysis of Virtual Clinical Trials Market*
| Restraints Impact Analysis | (~) % Impact on CAGR Forecast | Geographic Relevance | Impact Timeline |
|---|---|---|---|
| Data-privacy & cybersecurity risks across digital endpoints | -0.7% | Global, with heightened EU GDPR scrutiny | Short term (≤ 2 years) |
| Fragmented global regulatory & ethics-committee requirements | -0.4% | Emerging markets, harmonization gaps | Long term (≥ 4 years) |
| Digital literacy & broadband-access gaps in patient populations | -0.5% | Rural areas in Asia-Pacific, Latin America, and parts of Europe | Medium term (2-4 years) |
| Integration hurdles with legacy clinical systems & eSource silos | -0.3% | Global, most acute in large pharma with aging IT infrastructure | Short-to-medium term (≤ 4 years) |
| Source: Mordor Intelligence | |||
Data-Privacy & Cybersecurity Risks Across Digital Endpoints
Large breaches at Oracle Health and Worldwide Clinical Trials exposed sensitive datasets, shaking sponsor confidence. Virtual designs multiply attack surfaces through home devices, Wi-Fi networks, and interconnected cloud APIs. GDPR imposes strict consent and transfer rules, adding encryption and audit trail costs. Sponsors draft layered vendor assessments and cyber liability policies before green-lighting virtual proposals, which can slow kick-off by several weeks. While no systemic regulatory halt occurred, the risk premium marginally tempers the CAGR contribution.
Fragmented Global Regulatory & Ethics-Committee Requirements
Decentralized guidance improves in mature markets, yet variability persists in ethics interpretations across Asia-Pacific and Latin America. Singapore may approve a remote consent workflow in three months, whereas China often needs six months plus an onsite verification addendum. Sponsors must create bilingual consent variants, duplicate monitoring plans, and schedule redundant reviews for identical protocols. These redundancies add administrative burden and limit smaller firms’ ability to run simultaneous multi-region studies, slightly curbing the virtual clinical trials market growth trajectory.
*Our forecasts treat driver/restraint impacts as directional, not additive. The impact forecasts reflect baseline growth, mix effects, and variable interactions.
Virtual Clinical Trials Market Segment Analysis
By Study Design:
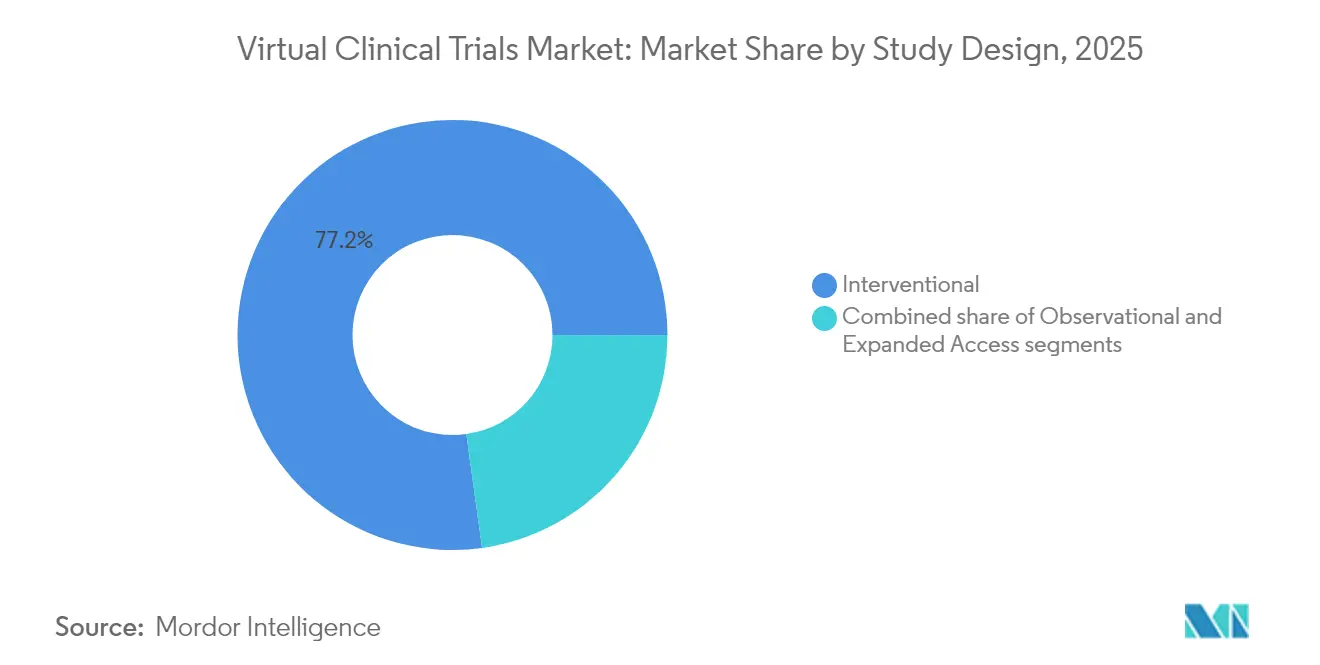
Interventional Dominance Faces Observational AccelerationInterventional models contributed 77.20% revenue in 2025, underscoring sponsors’ reliance on controlled dosing and safety oversight. This leadership anchors the virtual clinical trials market size for core drug development programs. Regulatory acceptance of remote drug administration, electronic diaries, and home nursing visits sustains share through 2031 even as new designs arise. Interventional protocols recorded a 4.08% annual growth between 2019 and 2025.
Observational studies enjoy a 7.65% forecast CAGR under mandates for real-world evidence in approval dossiers. ICH E6(R3) and FDA guidance validate passive data capture from connected devices, boosting confidence in longitudinal outcome measurement. Sponsors channel funds into prospective registry platforms and claims-linked analytics that operate in routine care settings. As that investment scales, the overall virtual clinical trials market benefits from diversified evidence streams that extend beyond investigational products.

By Phase:
Late-Stage Trials Lead While Early-Phase Adoption AcceleratesPhase III captured 48.60% of expenditure in 2025, reflecting large patient cohorts and long follow-up periods that profit most from remote engagement. Wide geographic reach trims screen-fail attrition and retention losses, cementing the phase’s contribution to the virtual clinical trials market size through 2031.
Phase I registers the quickest 8.74% growth as biotechs exploit home-based telemetry and virtual safety reviews to shorten dose escalation windows. The National Cancer Institute established a Virtual Clinical Trials Office in 2024 to escalate early oncology enrollment, signaling institutional commitment. Mid-stage Phase II protocols adapt selectively, balancing decentralized convenience with site-based imaging or biopsies when complex endpoints demand specialized facilities.
By Component:
Software Platforms Dominate While Services Gain MomentumSoftware platforms controlled 60.55% of 2025 turnover, underpinning data capture, randomization, and telehealth interactions. Platform lock-in remains high because regulatory filings require validated systems that pass 21 CFR Part 11 audits. Nonetheless, services show 7.31% CAGR as sponsors outsource protocol design, logistics, and regulatory liaison. The Suvoda–Greenphire merger merges randomization with payment workflows to form an end-to-end service stack. Sponsors perceive integrated offerings as insurance against operational gaps that pure-play software cannot fill, explaining the service-led share gains within the virtual clinical trials market.
By Delivery Mode:
Web-Based Solutions Lead While Cloud Migration AcceleratesWeb-based portals generated 54.60% of 2025 revenue due to universal browser access that minimizes training and device hurdles. They remain the default for many US oncology studies that emphasize simplicity. Yet cloud architectures record the fastest 7.26% CAGR as they provide real-time analytics, global uptime, and scalable storage vital for video, imaging, and multichannel biosignals. McKinsey estimates cloud data pipelines can shorten study timelines by up to 30%, improving business cases despite higher subscription fees. On-premise deployments linger for data sovereignty in financial-sensitive indications, but their share tapers as encrypted regional cloud nodes satisfy local regulators.
By End-User:
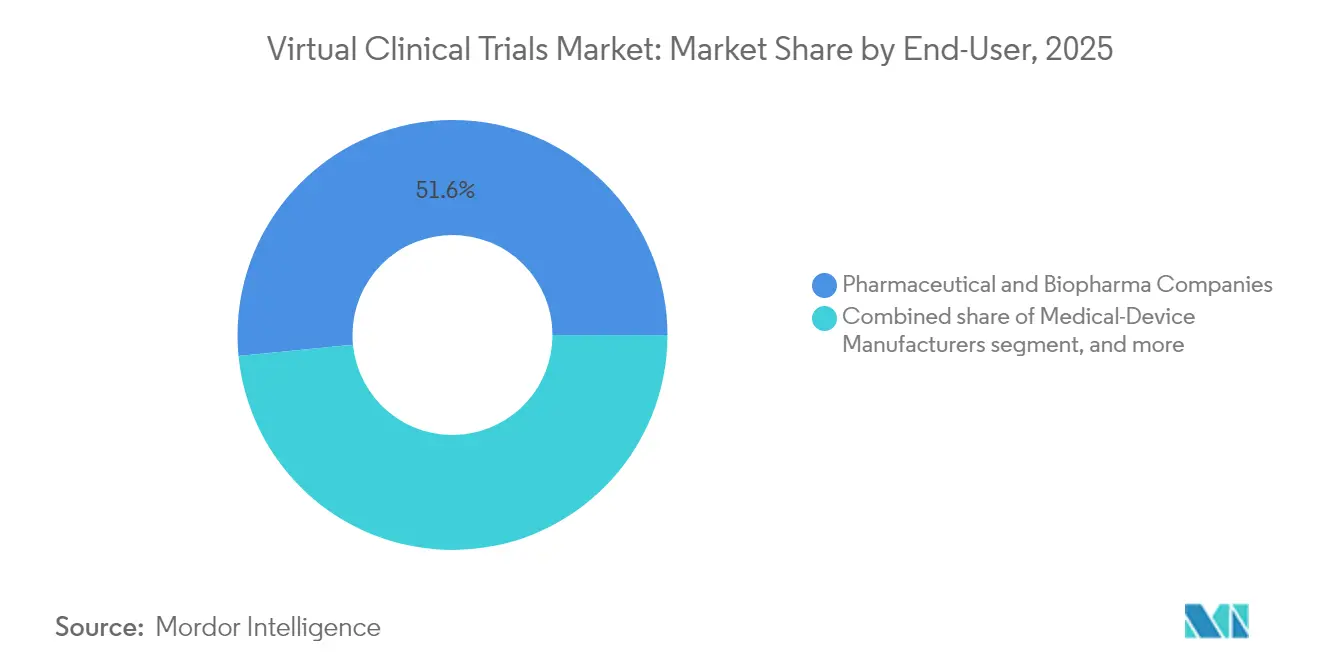
Pharmaceutical Companies Lead While Device Makers AcceleratePharmaceutical firms retained 51.55% share in 2025, leveraging pandemic lessons to mainstream remote recruitment across infectious disease and oncology portfolios. The segment’s deep budgets anchor the virtual clinical trials market. Medical device manufacturers post 7.33% CAGR as digital therapeutics and wearable-enabled endpoints fit naturally into decentralized frameworks. CROs occupy a solid middle ground, enlarged by ICON’s USD 12 billion acquisition of PRA Health Sciences, which added mobile health delivery and real-world evidence assets to ICON’s roster. Academic centers expand methodically as NIH grants promote hybrid learning studies that integrate community sites and home monitoring.
By Indication:
Oncology Dominance Persists While Neurology Breaks OutOncology delivered 37.85% share in 2025, supported by regulator encouragement to reduce patient travel during intensive chemoradiation schedules. Home nursing, electronic symptom reporting, and overnight courier kits make decentralized oncology feasible at scale. Neurology boasts a 9.28% CAGR as digital biomarkers capture motor and cognitive signals continuously. Roche employs such measures in more than 30 trials, moving beyond clinic-rated scales. Cardiovascular and endocrine studies progress with wearable ECG and glucose sensor links, while rare disease protocols gain feasibility through global remote access to ultra-orphan populations, broadening the addressable virtual clinical trials market.
Geography Analysis
North America Virtual Clinical Trials Market
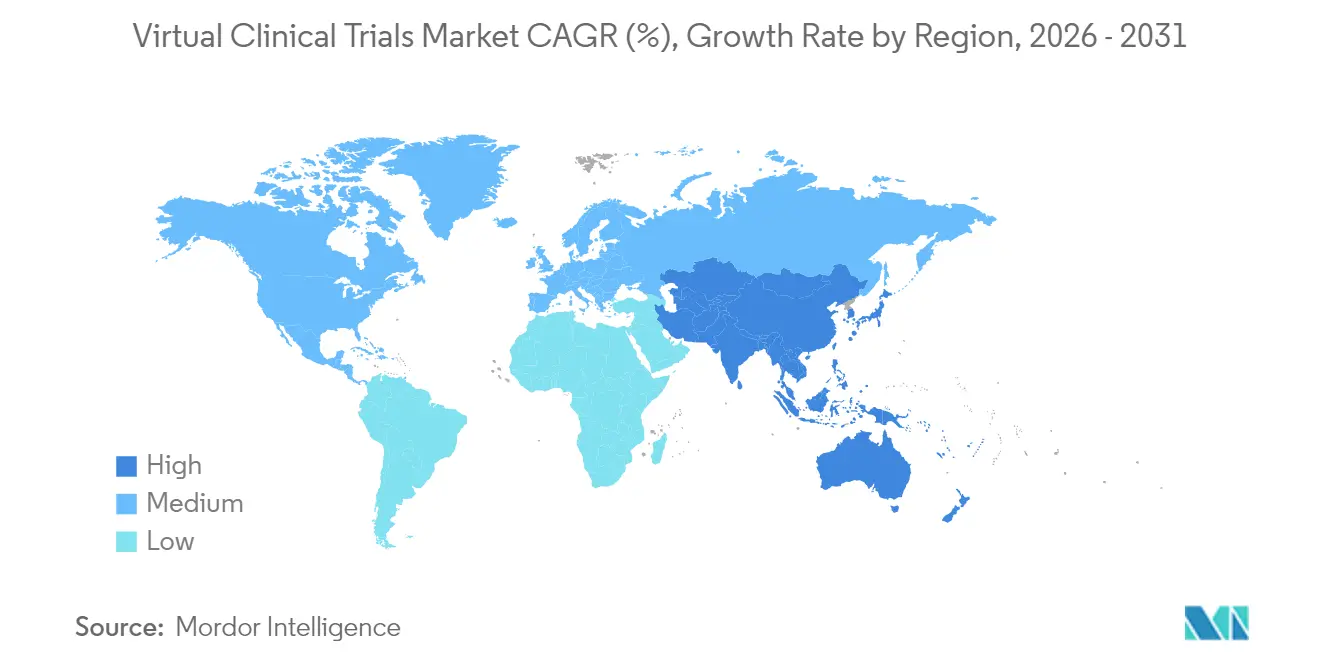
North America contributed 58.75% of 2025 revenue, driven by FDA clarity and robust broadband coverage that underpin high recruitment velocity. Vendors such as IQVIA, ICON, and Parexel operate turnkey hybrid models, and Palantir analytics within Parexel shave weeks from interim analyses by automating data reconciliation. Despite leadership, rising site costs and talent shortages prompt sponsors to diversify toward lower-cost regions, tempering North American share growth yet preserving absolute revenue gains for the virtual clinical trials market.
APAC Virtual Clinical Trials Market
Asia-Pacific holds the highest 6.71% CAGR through 2031. Singapore’s Health Sciences Authority and Australia’s Therapeutic Goods Administration introduced expedited decentralized approval pathways, cutting review to roughly 90 days. Novotech’s regional hubs utilize multilingual coordinators and telehealth networks reaching urban and rural sites, increasing patient diversity. Japan’s Ministry of Health funds app-based adherence pilots, while China’s 57% surge in trial volume underscores the region’s capacity to host global pivotal studies even amid complex ethics frameworks.
Europe Virtual Clinical Trials Market
Europe posts steady gains as ICH E6(R3) aligns member state expectations. GDPR adds compliance layers, yet its maturity provides clear operational playbooks for data controllers. The EU Clinical Trials Information System centralizes submissions, removing country-by-country portals that previously slowed start-up. The UK operates separate yet parallel guidance after Brexit, which still supports virtual protocols. Overall, transparent oversight outweighs the administrative load, ensuring European contribution grows in the virtual clinical trials market albeit at a moderate pace.
Regulatory Landscape
In the United States, the FDA issued final guidance in September 2024, Conducting Clinical Trials With Decentralized Elements, formalizing acceptability of decentralized activities (for example, telehealth visits, local laboratory use, and remote data acquisition via digital health technologies) under the same standards for participant safety and data integrity applied to site-based trials.
Globally, ICH adopted the E6(R3) Good Clinical Practice guideline in January 2025, reinforcing quality-by-design, risk assessment, and governance principles that apply to modern trial designs that combine site-based and remote elements. In Europe, decentralized clinical trial recommendations under ACT EU support convergence but are not legally binding, so operational requirements still vary by EU member state despite increasing alignment via ICH and centralized submission infrastructure such as the EU Clinical Trials Information System.
Competitive Landscape
The competitive field mixes large CRO consolidators with agile software specialists. ICON’s USD 12 billion purchase of PRA Health Sciences produces a combined network that manages traditional and hybrid designs in one contract, delivering USD 150 million projected synergies and enhancing sponsor one-stop convenience. IQVIA’s remote data capture modules integrate with its AI-driven Site Prediction Engine to forecast enrollment lags and trigger adaptive recruitment. Parexel and Palantir combine deep analytics with decentralized conduct to reduce mid-study cleaning cycles.
Platform players focus on automation. Medidata uses generative AI to reduce eCOA build time from several days to 30 minutes while maintaining validation logs. Suvoda’s randomization engine now links directly to Greenphire’s patient payment rails, closing a compliance gap that previously required manual reconciliation. Smaller entrants such as PhaseV secure venture rounds to refine AI-driven protocol optimization that learns from prior deployments, challenging incumbents on speed and cost.
White-space opportunities emerge in neurology and rare disease. Altoida pushes remote cognitive testing algorithms validated in early Alzheimer’s studies, positioning itself as a specialized data provider rather than a full CRO. CROs and software vendors partner to bundle disease-specific modules, aiming to convert niche expertise into standardized product offerings. The result is a market where technological differentiation and service wrap-rounds both decide contract awards, keeping the virtual clinical trials market dynamic.
Virtual Clinical Trials Industry Leaders
-
Medable Inc.
-
IQVIA Inc.
-
Parexel International Corp.
-
Labcorp (Covance)
-
ICON plc
- *Disclaimer: Major Players sorted in no particular order
Virtual Clinical Trials Market Companies Covered in this Report
- IQVIA
- ICON
- Parexel International Corp.
- Labcorp (Covance)
- Oracle Health Sciences
- Medable
- Dassault Systmes (Medidata)
- Signant Health
- Science 37 Inc.
- THREAD Research
- Syneos Health
- WuXi App Tec
- Novotech CRO
- ObvioHealth
- YPrime
- Castor EDC
- Veeva Systems (Clinical Vault)
- Alira Health
- ClinOne
- MedPace
Market Opportunities and Future Outlook
One near-term opportunity is operationalizing updated global GCP expectations into validated, audit-ready workflows across eConsent, eCOA, remote source, and vendor oversight. Adoption of ICH E6(R3) Annex 2 in June 2026 adds considerations for decentralized and pragmatic elements and real-world data, which increases demand for sponsors and CROs to standardize risk assessment, monitoring plans, and documentation across countries where ethics and regulator interpretations remain uneven.
Technology stack consolidation around AI-enabled trial execution is also creating whitespace for platforms and services that reduce startup friction and manual burden at sites while preserving compliance. Medidata reported in May 2026 that 72.9% of early adopters of AI in clinical trials saw a reduction in study timelines, reinforcing buying preference for enterprise-grade data foundations, interoperable clinical systems, and automation in document workflows and feasibility. Vendor moves such as Medable rolling out agentic AI programs and site-focused AI agents, alongside CRO partnerships that integrate AI-driven trial execution and regulatory automation, support a shift from transactional, trial-by-trial tooling toward persistent infrastructure that improves recruitment, retention, and real-time data quality management.
Recent Industry Developments in Virtual Clinical Trials Market
- June 2026: Medable launched its Agentic Accelerator Program to help life sciences companies deploy agentic AI across the clinical development lifecycle with dedicated AI experts and forward-deployed engineers. The program expands Medable beyond decentralized trial enablement into automation layers aimed at startup and execution bottlenecks for both sponsors and CROs.
- May 2026: IQVIA and Kexing Biopharm expanded their strategic collaboration to accelerate global biosimilar development using IQVIA's AI-enabled capabilities and end-to-end clinical development platform. The partnership points to increased use of integrated data, analytics, and decentralized-ready delivery models to shorten cycle times for multi-country development programs.
- September 2024: US FDA issued final guidance Conducting Clinical Trials With Decentralized Elements, formalizing acceptability of decentralized activities under the same standards for participant safety and data integrity applied to site-based trials. This guidance clarifies oversight expectations for telehealth, remote data capture, and local laboratory use across decentralized components.
Virtual Clinical Trials Market Report Scope and Research Methodology
Market Definition and Coverage
For this methodology, the virtual clinical trials market covers the paid technology and service revenue used to run clinical studies where major trial activities happen remotely, such as patient identification, eConsent, data capture, and remote monitoring.
Scope exclusions: We exclude routine telehealth visits and general remote care that are not tied to an approved clinical study protocol.
Segments Covered in This Report
- By Study Design
- Interventional
- Observational
- Expanded Access
- By Phase
- Phase I
- Phase II
- Phase III
- Phase IV
- By Component
- Software Platforms
- Services
- By Delivery Mode
- Web-Based
- Cloud-Based
- On-Premise
- By End-User
- Pharmaceutical & Biopharma Companies
- Medical-Device Manufacturers
- Contract Research Organizations (CROs)
- Academic & Research Institutes
- By Indication
- Oncology
- Cardiovascular Diseases
- Neurology
- Endocrine & Metabolic
- Rare-Disease / Orphan
- Other Indications
- Geography
- North America
- United States
- Canada
- Mexico
- Europe
- Germany
- United Kingdom
- France
- Italy
- Spain
- Rest of Europe
- Asia-Pacific
- China
- Japan
- India
- Australia
- South Korea
- Rest of Asia-Pacific
- Middle East & Africa
- GCC
- South Africa
- Rest of Middle East & Africa
- South America
- Brazil
- Argentina
- Rest of South America
- North America
Data Sources, Market Sizing, and Validation
Desk Research
Desk work started by mapping how virtual and hybrid trials are implemented and paid for, so the model follows real trial workflows and billed revenue lines. We leaned on public sources such as ClinicalTrials.gov for trial activity and study mix, the US FDA for decentralized trial guidance, the European Medicines Agency for regional expectations, and the World Health Organization for broader health system context.
We also reviewed sources such as SEC filings, annual reports, and investor presentations to understand which revenue lines are directly tied to virtual trial execution. Additional checks came from association websites and reputable press coverage to verify product updates, partnerships, and rollout timing that can shift adoption. Where needed, paid subscriptions already available to us were used for company financials and intelligence, patent lookups, and selected news and financials to cross-check business mix and timelines. This list is not exhaustive because many other sources were also used for data collection, validation, and clarification.
Primary Interviews and Surveys
Primary work focused on confirming what gets counted as virtual trial revenue versus adjacent digital health spending, and then stress-testing adoption and pricing assumptions. We spoke with a mix of trial sponsors, CRO-side operations leaders, and solution providers, and coverage was kept global so regional differences in regulation, site models, and patient access were reflected. Feedback from these discussions helped close gaps around hybrid trial intensity by phase, service attach rates, and how pricing shifts when study complexity changes.
Distribution of primary research fieldwork respondents
| Company type | Respondent position | Region |
|---|---|---|
| Top tier: 36% | CXOs: 16% | APAC: 39% |
| Mid tier: 48% | Functional/Unit leaders: 38% | EMEA: 37% |
| Smaller Players: 16% | Managers: 46% | Americas: 24% |
Market-Sizing & Forecasting
Sizing began with a top-down build where trial activity and protocol mix were translated into a spending pool that fits virtual execution, and then converted into revenue using informed pricing and service intensity. In practice, we used indicators such as the count and mix of decentralized and hybrid studies, trial phase shares, use of remote patient monitoring and eConsent, average study duration, and typical service attach rates to move from activity to paid market value.
Selective bottom-up checks were then used to corroborate totals, including sampled revenue splits from public disclosures, channel conversations on subscription and service pricing, and sanity checks on vendor coverage by geography. When gaps showed up, such as limited private-provider revenue visibility, the model was adjusted using conservative penetration assumptions that were validated during interviews.
Forecasting was run using scenario analysis, because adoption speed depends on study design choices and sponsor risk appetite as much as it depends on technology availability. The forward view was set by expected trial volume trends, projected hybrid intensity, and pricing direction, with assumptions tuned to the consensus view we heard from practitioners.
Data Validation & Update Cycle
Totals were validated through triangulation across independent signals, followed by variance checks at the region and workflow level so one inflated assumption could not distort the full market. Outliers were reviewed by another analyst, and respondents were re-contacted when model outputs conflicted with observable trial activity or with disclosed business mix.
The report is refreshed on an annual cycle, and interim updates are made when material events occur, such as major regulatory changes or large program shifts by trial sponsors. Before delivery, we complete a fresh review pass so clients receive the latest updated view rather than a stale snapshot.
Mordor Intelligence's Virtual Clinical Trials Market Sizing Compared With Other Published Estimates
Published market sizes for virtual clinical trials can look far apart because teams do not count the same revenue lines, and they also assume different levels of hybrid adoption inside a trial. Differences also come from which trial activities are treated as in-scope, how prices are averaged across services versus software, and how quickly forecasts are refreshed when trial designs change.
The main gap often comes from whether routine telehealth and general remote care are mixed into the total, and this is where Mordor Intelligence counts revenue only when it is directly tied to a protocol-driven clinical study workflow, including platform fees and trial services linked to decentralized or hybrid execution. Estimates can also diverge when currency timing is not aligned to the study year, or when pricing is projected using a single flat growth rate without checking shifts in phase mix and service intensity.
Benchmark comparison
| Source | Market Size | Gaps in Research Methodology |
|---|---|---|
| Mordor Intelligence | USD 10.32 B (2026) | |
| Trade Journal A | USD 8.80 B (2024) | Uses an earlier base year and often emphasizes software and platform revenue, which can undercount service fees that rise with hybrid execution and study complexity. |
| Industry Brief B | USD 11.50 B (2025) | Tends to apply a broader interpretation that can blend adjacent remote care activity and assumes faster adoption across all phases, which lifts the near-term total. |
The spread in the table is mostly explained by scope and timing, especially whether only protocol-linked trial execution revenue is counted and how hybrid intensity is assumed by phase. By keeping inputs tied to observable study activity and then cross-checking pricing and attach rates through interviews, we arrive at a value that is easier to trace back to clear steps and practical variables.
Key Questions Answered in the Report
What is the current value of the virtual clinical trials market?
The virtual clinical trials market reached USD 10.32 billion in 2026.
How fast is the virtual clinical trials market expected to grow?
Forecasts indicate a 5.62% CAGR, taking revenue to USD 13.56 billion by 2031.
Which study design dominates virtual trials today?
Interventional trials lead with 77.20% of 2025 revenue, although observational designs are expanding the fastest at 7.65% CAGR.
Which geography offers the highest growth opportunity?
Asia-Pacific shows the quickest trajectory with a 6.71% CAGR, backed by streamlined regulations and large patient pools.
What is the main regulatory milestone supporting virtual trials?
The FDA’s September 2024 final guidance and the EMA’s ICH E6(R3) principles together provide a harmonized global framework for decentralized clinical research.
How are cybersecurity concerns being addressed in virtual clinical trials?
Sponsors now mandate layered encryption, vendor audits, and GDPR-aligned data handling to mitigate risks highlighted by recent industry breaches.