
Global Virtual Care Market Size and Share
Market Overview
| Study Period | 2020 - 2031 |
|---|---|
| Market Size (2026) | USD 20.33 Billion |
| Market Size (2031) | USD 63.53 Billion |
| Growth Rate (2026 - 2031) | 25.58 % |
| Fastest Growing Market | Asia-Pacific |
| Largest Market | North America |
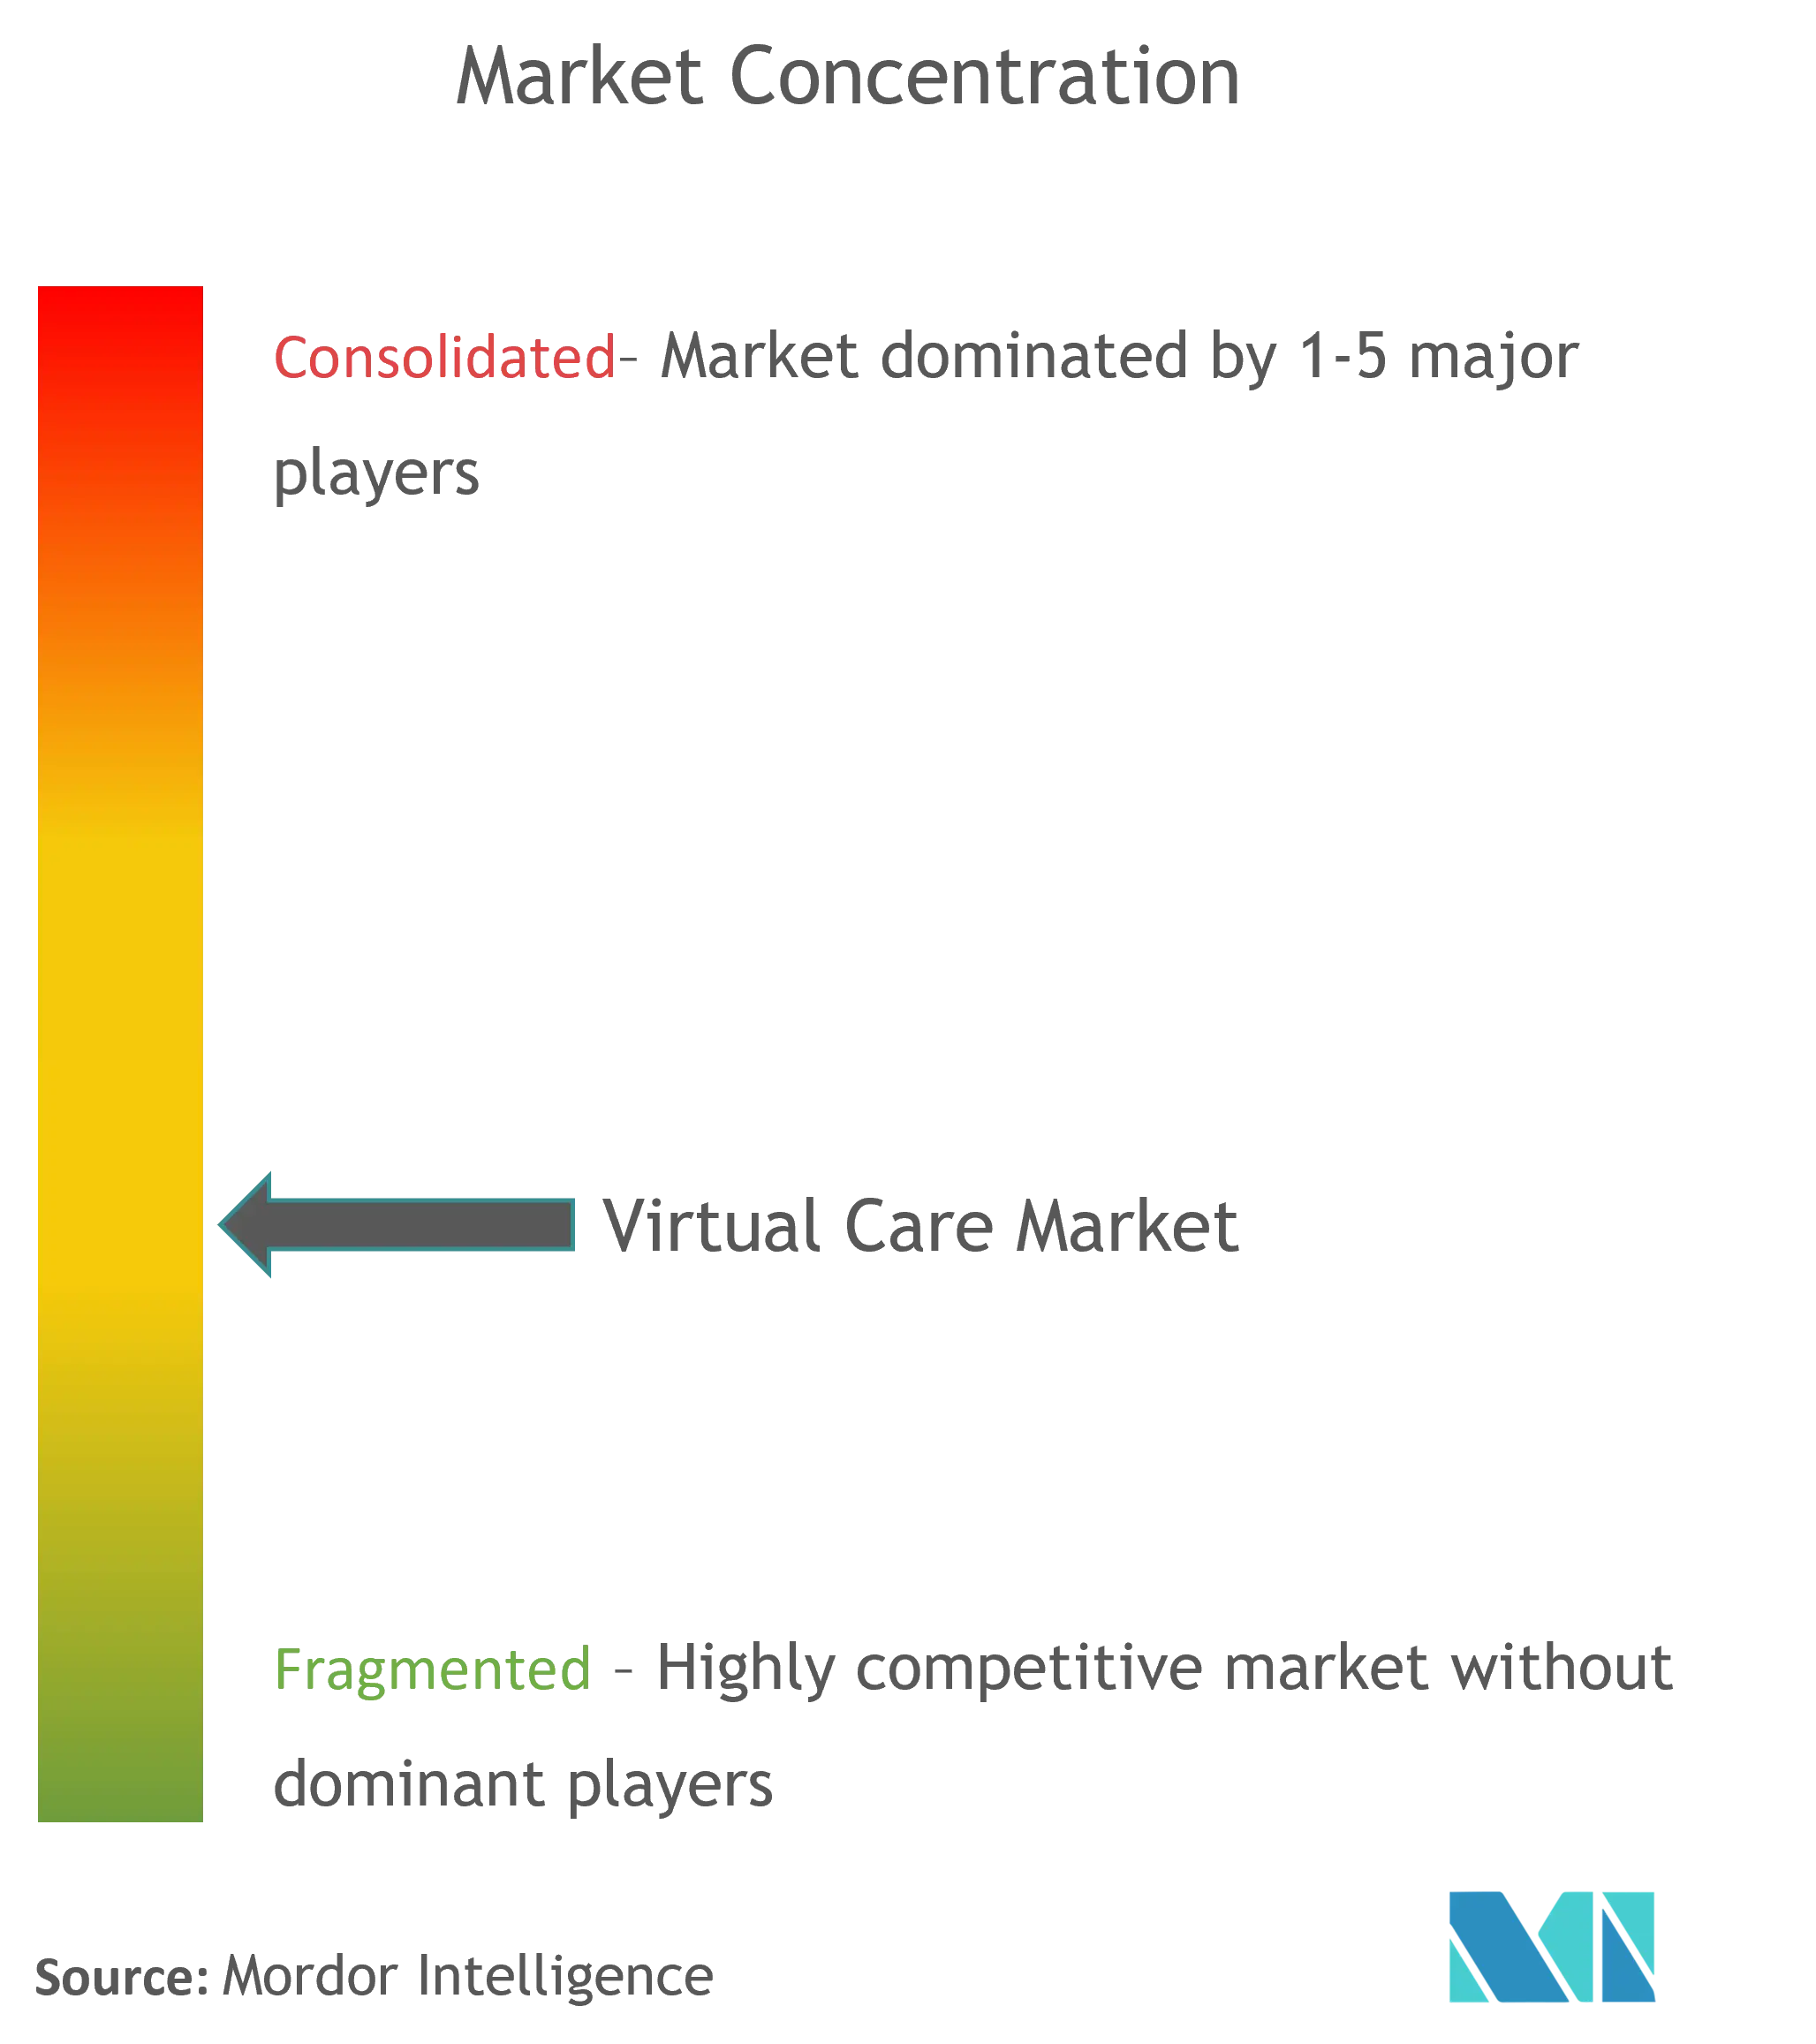
| Market Concentration | High |
Major Players *Disclaimer: Major Players sorted in no particular order Image © Mordor Intelligence. Reuse requires attribution under CC BY 4.0. | |
Global Virtual Care Market Analysis by Mordor Intelligence
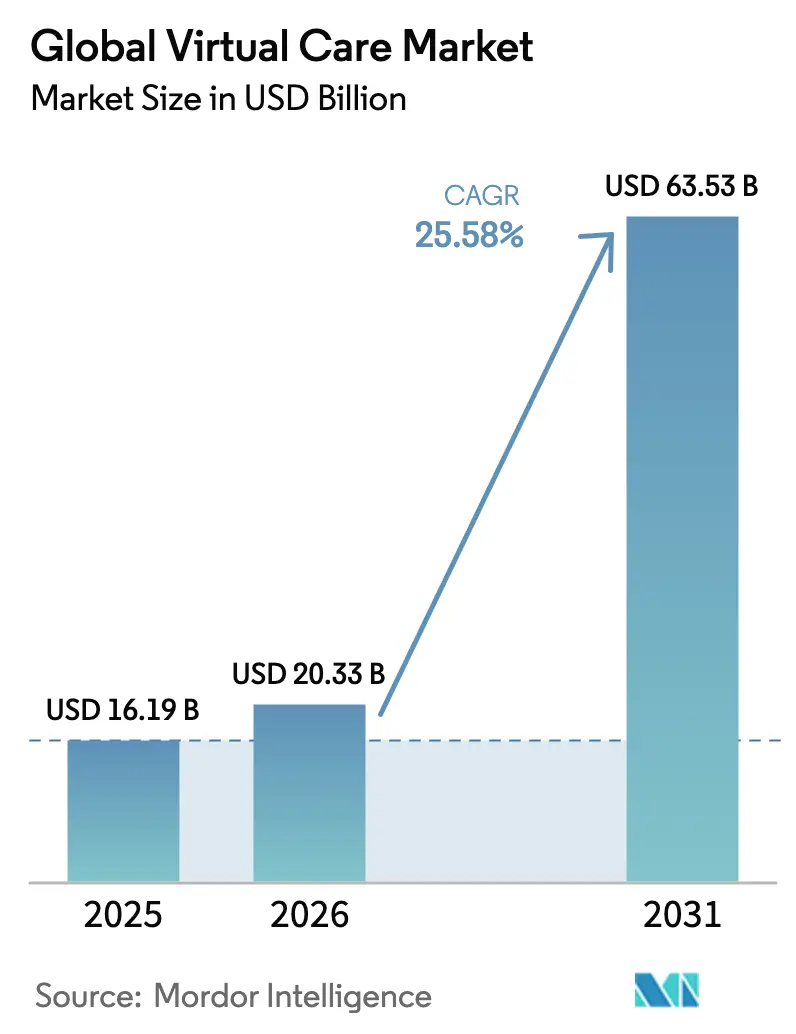
The virtual care market size was valued at USD 16.19 billion in 2025 and estimated to grow from USD 20.33 billion in 2026 to reach USD 63.53 billion by 2031, at a CAGR of 25.58% during the forecast period (2026-2031). The expansion stems from permanent reimbursement parity, sustained venture funding in AI-enabled platforms, a rapidly aging population seeking home-based chronic‐care models, and widening rural clinician shortage[1]Source: Centers for Medicare & Medicaid Services, “Calendar Year 2025 Medicare Physician Fee Schedule Final Rule,” cms.gov . New federal parity laws in 43 states and Washington D.C. anchor sustainable payment models, while satellite-enabled broadband pilots begin to close rural connectivity gaps[2]Source: National Conference of State Legislatures, “Telehealth Private Insurance Laws,” ncsl.org . Chronic-care programs that document 30% cost savings through hospital-at-home models and remote patient monitoring reinforce the business case for integrated virtual primary care. Concurrently, employers embrace enterprise-wide virtual benefits to curb long-term costs, and AI-powered triage platforms attract record capital, accelerating consolidation across fragmented service providers. Yet the market navigates uneven broadband penetration in emerging economies, tightening data-privacy mandates, and cybersecurity fatigue among health systems, each tempering near-term growth trajectories.
Key Report Takeaways
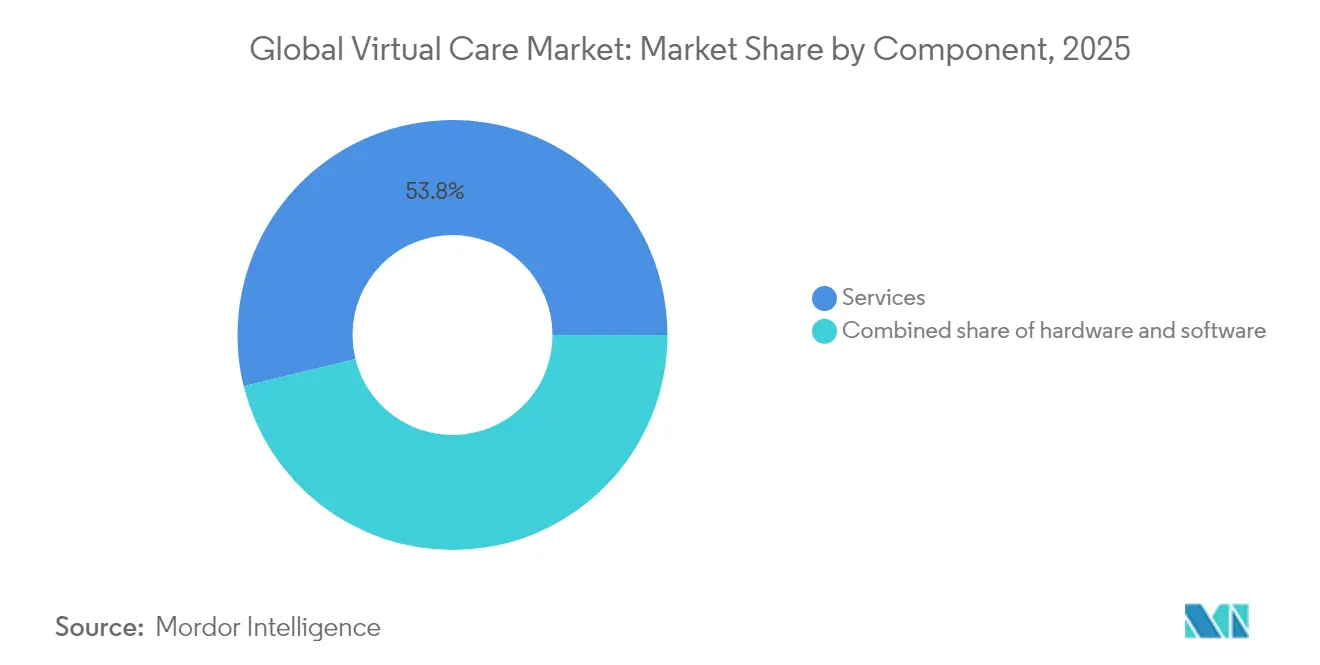
- By component, services held 53.84% of virtual care market share in 2025, while software is projected to record the fastest 27.11% CAGR to 2031.
- By delivery mode, video consultation retained 60.25% share of the virtual care market in 2025; VR/AR-enabled care is expected to expand at a 27.68% CAGR through 2031.
- By application, chronic disease management commanded 28.31% of the virtual care market size in 2025, whereas mental health services are forecast to rise at a 28.22% CAGR over the outlook period.
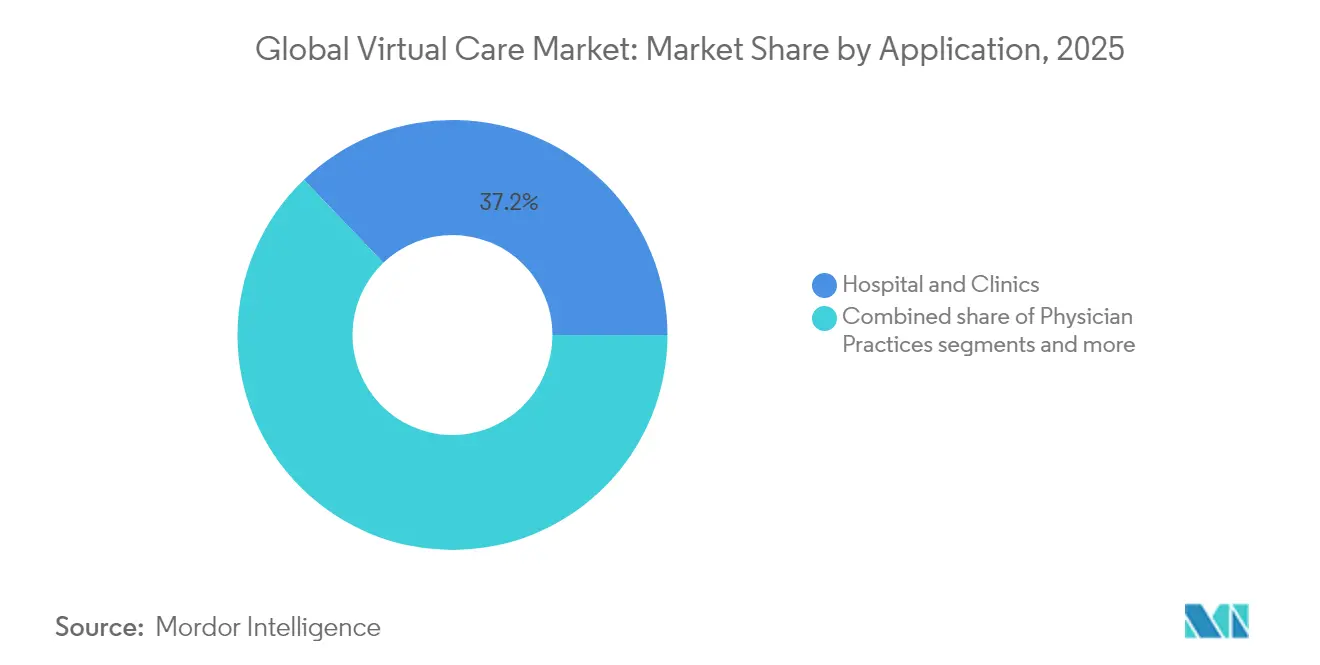
- By end user, hospitals and clinics generated 37.15% of 2025 revenue, but home-care settings are projected to advance at a 28.74% CAGR by 2031.
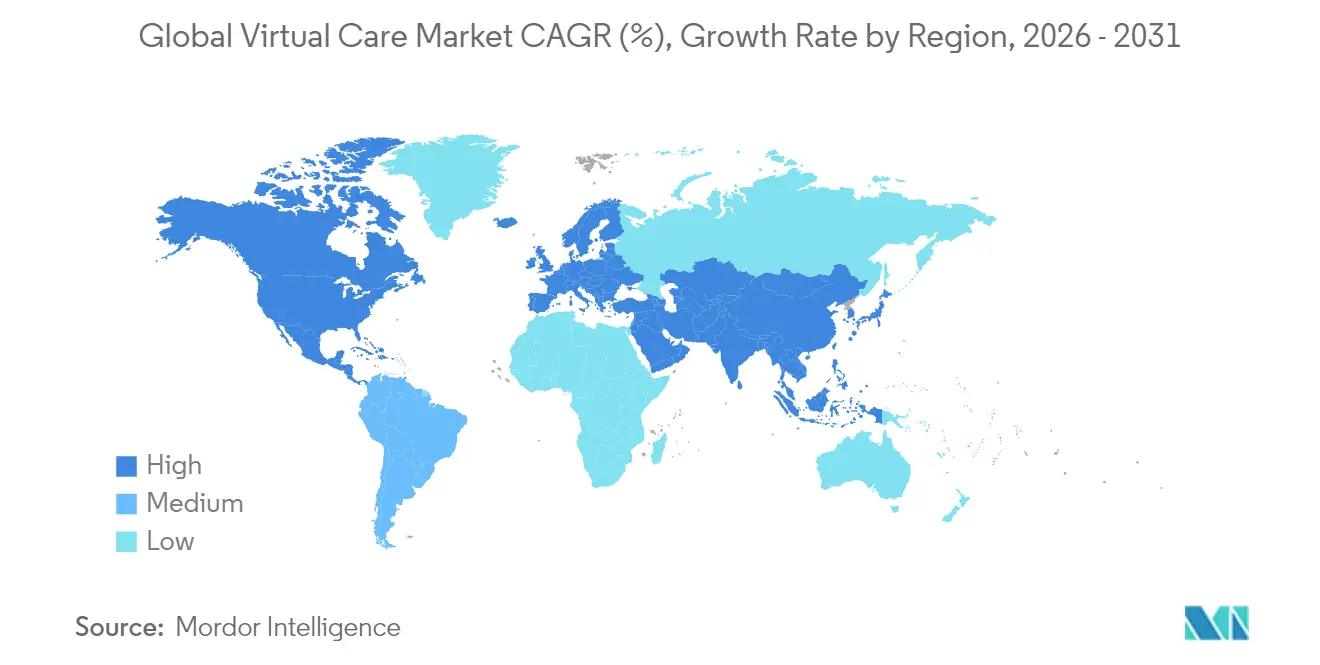
- Geographically, North America led with a 41.67% revenue share in 2025; Asia-Pacific is positioned for a 29.44% CAGR to 2031.
Note: Market size and forecast figures in this report are generated using Mordor Intelligence’s proprietary estimation framework, updated with the latest available data and insights as of 2026.
Market Trends and Insights
Drivers Impact Analysis of Global Virtual Care Market*
| Driver | (~) % Impact on CAGR Forecast | Geographic Relevance | Impact Timeline |
|---|---|---|---|
| Reimbursement parity laws expanding post-pandemic | +4.2% | North America & EU, spill-over to APAC | Medium term (2-4 years) |
| Aging population driving home-based chronic-care models | +6.8% | Global, with concentration in developed markets | Long term (≥ 4 years) |
| Clinician shortages in rural regions | +3.9% | North America rural, APAC emerging markets | Medium term (2-4 years) |
| Venture funding into AI-powered virtual triage | +5.1% | Global, with early gains in North America, Europe | Short term (≤ 2 years) |
| Employer demand for integrated virtual primary care | +3.7% | North America & EU corporate markets | Medium term (2-4 years) |
| Satellite-enabled connectivity in low-bandwidth areas | +2.3% | Rural regions globally, priority in developing markets | Long term (≥ 4 years) |
| Source: Mordor Intelligence | |||
Reimbursement Parity Laws Expanding Post-Pandemic
Permanent payment parity statutes have doubled to 33 U.S. states since 2019, and the Telehealth Modernization Act of 2024 extends Medicare waivers through 2026, eliminating geographic restrictions and broadening provider eligibility. CMS’s 2025 Physician Fee Schedule adds bundled Advanced Primary Care Management Services, creating predictable revenue streams for virtual providers. Commercial insurers follow suit, with parity clauses included in 87% of large-group contracts filed in 2025. These mechanisms institutionalize virtual care as a standard benefit rather than an emergency workaround. As payer confidence grows, venture investors channel fresh capital into platform scalability, and hospital systems embed virtual pathways across inpatient and ambulatory settings.
Aging Population Driving Home-Based Chronic-Care Models
By 2030, the global population aged 65 and above will surpass 1 billion, while chronic disease prevalence continues to climb. Remote patient monitoring programs record 1.68% fasting-glucose reductions and 0.45% HbA1c drops among diabetics, validating clinical effectiveness. Hospital-at-home pilots deliver 30% lower care costs and up to 83% fewer readmissions, stimulating payer interest in value-based virtual bundles. McKinsey projects USD 265 billion of U.S. health services can shift to the home, realigning facilities planning and clinician workflows. As demographic pressures intensify, health systems treat home-centric virtual pathways as essential to workforce sustainability.
Clinician Shortages in Rural Regions
Rural communities account for under 25% of U.S. physicians, yet serve 60 million residents; shortages are projected to reach 68,020 primary-care doctors by 2036. Virtual hubs such as Guthrie Clinic’s model reduced nursing turnover from 25% to 13%, saving USD 7 million in annual labor expense. Tele-neurology and tele-cardiology programs shorten time-to-treatment for stroke and STEMI cases, enhancing outcomes despite geographical isolation. Because rural recruitment pipelines remain thin, telehealth substitutes become permanent rather than stopgap measures. State licensure compacts expand multistate practice privileges, but administrative friction persists, heightening demand for turnkey credentialing services.
Venture Funding Into AI-Powered Virtual Triage
Global consumer health-tech funding rose 37% year-on-year to USD 6.3 billion in 2024, with AI-driven triage platforms capturing the largest share. K Health’s USD 50 million extension underscored investor confidence in models that reduce avoidable ED use. Peer-review research shows AI recommendations outperform physician decisions in identifying antibiotic-resistant infections during virtual urgent care, driving payer endorsements. Private-equity-led roll-ups increased 63% in 2024, signaling a consolidation phase that favors platforms with embedded AI. Enhanced acuity alignment improves clinical outcomes and optimizes network cost structures, persuading large employers to broaden virtual benefit coverage.
Restraints Impact Analysis of Global Virtual Care Market*
| Restraint | (~) % Impact on CAGR Forecast | Geographic Relevance | Impact Timeline |
|---|---|---|---|
| Data-privacy litigation risk under evolving regulations | -2.8% | Global, with heightened focus in EU & North America | Short term (≤ 2 years) |
| Unequal broadband penetration in emerging economies | -3.4% | APAC emerging markets, rural regions globally | Long term (≥ 4 years) |
| Physician licensure barriers across state borders | -1.9% | North America interstate practice | Medium term (2-4 years) |
| Cyber-security fatigue among health systems | -2.1% | Global, with concentration in developed markets | Short term (≤ 2 years) |
| Source: Mordor Intelligence | |||
Data-Privacy Litigation Risk Under Evolving Regulations
HHS plans to mandate encryption, multifactor authentication, and formal asset management in proposed HIPAA rule revisions slated for 2025, imposing steep compliance spending. The FTC expands enforcement on consumer health-data breaches, heightening litigation exposure for virtual platforms. Divergent state privacy acts, notably California’s CPRA and Virginia’s CDPA, layer additional requirements, complicating multistate rollouts. European operators contend with GDPR harmonization and cross-border data-transfer restrictions. These overlapping regimes slow product cycles and increase vendor-due-diligence timelines, nudging smaller entrants toward partnership or acquisition.
Unequal Broadband Penetration in Emerging Economies
Smartphone ownership averages 78% in rural APAC, while laptop access sits at 56%, constraining high-fidelity video care. The U.S. Broadband Equity, Access, and Deployment Act injects USD 42 billion into infrastructure, yet project delays and legal challenges threaten completion targets. Satellite solutions alleviate gaps but remain cost-intensive for community clinics. In India, national telehealth efforts reach thousands of villages, but bandwidth variance undermines consistent service levels. Consequently, audio-only and asynchronous modes retain relevance, but limited bandwidth restricts advanced VR/AR therapies, capping total addressable demand for the virtual care market.
*Our forecasts treat driver/restraint impacts as directional, not additive. The impact forecasts reflect baseline growth, mix effects, and variable interactions.
Global Virtual Care Market Segment Analysis
By Component:
Services Sustain Leadership Amid Software AccelerationServices captured 53.84% of virtual care market share in 2025 as multidisciplinary clinical teams remained vital for diagnosis, triage, and longitudinal monitoring. The segment’s resilience is reinforced by bundled reimbursement codes that prize care coordination and value-based outcomes. Software, however, advances at a 27.11% CAGR through 2031, propelled by scalable AI algorithms that automate symptom checking, risk stratification, and documentation. This dual trajectory enables platforms to layer high-margin SaaS fees atop labor-intensive service lines, blending predictable subscription revenue with encounter-based billing. Hardware lags in growth because device standardization and patient usability hurdles limit rapid refresh cycles, yet connected-sensor adoption still supports continuous data capture for chronic-care pathways.
Software’s momentum also emanates from hospital demand for virtual sitter dashboards that allow a single nurse to oversee multiple beds, reducing fall incidents and saving USD 1.2 million per facility annually. Payer credentialing APIs, integrated within EHRs, shave minutes off call times and tighten denial rates. As predictive analytics mature, software modules increasingly deliver automated plan-of-care recommendations, shifting clinical staff to higher-acuity tasks. With enterprise buyers negotiating multi-year licenses, software revenue visibility improves, drawing institutional investors who value recurring income streams inside the virtual care market.


By Delivery Mode:
Video Still Dominant as Immersive Tech Gains GroundVideo consultation accounted for 60.25% of 2025 revenue, offering clinicians real-time visual cues essential for acute assessments. States have codified coverage for audio-only visits in 18 jurisdictions, ensuring continuity for bandwidth-limited patients, yet reimbursement remains lower than video in most commercial contracts. VR/AR-enabled care, though nascent, accelerates at a 27.68% CAGR as evidence mounts for pain distraction, exposure therapy, and physical-rehab applications. Holographic pilots in Texas reported higher patient-engagement scores relative to standard video, hinting at future competitive differentiation. Asynchronous (store-and-forward) modalities support dermatology and ophthalmology where high-resolution imaging replaces synchronous dialog.
In rural broadband deserts, satellite backhaul stabilizes video quality, but latency occasionally disrupts neuro-rehab sessions, sustaining demand for hybrid audio-plus-text workflows. Platform roadmaps increasingly integrate mixed-reality toolkits using consumer headsets, yet reimbursement policy still lags technological capability. Providers therefore adopt phased rollouts, initially deploying VR for in-clinic behavioral health before expanding to at-home kits as payer codes solidify. The convergence of unlimited-reality technologies is poised to widen therapeutic scope, though cost and accessibility must improve before immersive delivery modes erode video’s commanding virtual care market share.
By Application:
Mental Health Services Outpace Chronic Disease ManagementChronic disease programs retained 28.31% of 2025 revenue as validated RPM protocols tracked daily vitals for diabetes, hypertension, and heart-failure cohorts. Nonetheless, mental health services are forecast to grow 28.22% annually as post-pandemic behavioral-health demand persists, with 38.3% of 2023 encounters conducted virtually. Telepsychiatry lowers wait times by 35 days on average, improving clinical outcomes and adherence. Primary care remains foundational, yet faces commoditization, sparking vertical integration into wellness and disease-prevention add-ons. Specialty consultation leverages national panels of subspecialists to support community hospitals lacking onsite expertise.
Digital cognitive-behavioral therapy modules complement synchronous sessions, extending clinician reach without compromising effectiveness. Integrated cardiometabolic pipelines combine lifestyle coaching with mental-health screening to capture comorbidity synergies. Meanwhile, post-acute rehab leverages gamified VR exercises that shorten recovery by 17% for knee-replacement patients, though widespread payer recognition is pending. The marriage of mental health and chronic-care management under unified platforms positions vendors to unlock cross-selling opportunities and defend against point-solution competitors.
By End User:
Home-Care Settings Redefine Continuum of CareHospitals and clinics contributed 37.15% of 2025 revenue as inpatient teleconsultations, virtual nursing, and remote specialist access extended capacity amid staffing constraints. Yet home-care settings are slated for a 28.74% CAGR, reflecting the financial appeal of hospital-at-home programs that generate 30% savings and materially lower readmissions. Physician practices embed virtual check-ins to preserve panel size, while employers and payers leverage integrated platforms to shrink total cost of care. Government and defense facilities deploy secure telemedicine channels for dispersed populations, and direct-to-consumer offerings entice digitally savvy patients.
Advances in 5G and edge computing enable near-real-time remote vital-sign streaming, meeting clinical thresholds for early intervention. Portable diagnostic kits equip visiting nurses with lab-quality imaging, shrinking dependency on brick-and-mortar sites. Reimbursement alignment under the CMS Acute Hospital Care at Home waiver through 2029 further de-risks provider investment, anchoring long-term expansion in domiciliary models. As trust in at-home modalities grows, payers develop risk-sharing contracts that reward vendors for avoiding unnecessary emergency visits, reinforcing home settings as a strategic growth engine within the virtual care market.
Geography Analysis
North America Virtual Care Market
North America led the virtual care market with 41.67% revenue in 2025, buoyed by mature reimbursement and early technology adoption. The American Relief Act of 2025 extends Medicare telehealth coverage through March 2025, but permanent legislation remains pending, injecting regulatory uncertainty. State parity momentum persists, yet upcoming DEA controlled-substance rules create new compliance layers. Rural broadband pilots featuring Starlink have begun closing access gaps, lifting encounter volumes 12% in participating clinics. Persistent clinician shortages drive cross-state networks, although full licensure reciprocity is still incomplete.
APAC Virtual Care Market
Asia-Pacific is projected to achieve a 29.44% CAGR to 2031, propelled by government funding and large-scale platform rollouts in China, India, and Indonesia. India’s E-Sanjeevni network has already facilitated 130 million consultations, illustrating the scalability of hub-and-spoke virtual models. Venture funding remains robust, targeting AI analytics and remote diagnostics attuned to local affordability thresholds. Infrastructure disparities persist, with rural regions dependent on mobile-first strategies and asynchronous messaging. Policy heterogeneity across markets demands country-specific go-to-market tactics, yet collective momentum positions the region as the fastest-growing node in the virtual care market.
Europe Virtual Care Market
Europe records steady adoption, underpinned by 40 nations formalizing telemedicine frameworks. EU cross-border health initiatives aim to harmonize reimbursement, but data privacy directives present compliance complexity. Telepsychiatry solutions proliferate as mental-health waitlists lengthen. Satellite-enabled trials in the UK extend connectivity to remote GP practices, while Nordic countries pioneer national tele-monitoring registries that integrate with electronic health cards. Consolidation accelerates as valuations normalize post-pandemic, with acquirers prioritizing AI-enhanced triage capabilities to counter margin compression.

Regulatory Landscape
Virtual care regulation continues to be shaped by reimbursement and coverage rules in the United States and data governance frameworks in Europe. In the United States, CMS telehealth policy supports broad beneficiary access through December 31, 2027. From January 1, 2026, CMS permanently removed frequency limits on certain subsequent inpatient and nursing facility telehealth visits and critical care consultations, and it allows teaching physicians to be virtually present for Medicare telehealth services across teaching settings. At the same time, FDA digital health oversight remains central for software-enabled care pathways, with final guidances issued in January 2026 for Clinical Decision Support Software and General Wellness: Policy for Low Risk Devices, clarifying expectations for low-risk digital tools and CDS functionality used inside virtual care workflows.
In the European Union, Regulation (EU) 2025/327 establishing the European Health Data Space (EHDS) entered into force on March 26, 2025, setting out governance for primary and secondary use of health data. The EHDS requires Member States to designate digital health authorities and national contact points by March 26, 2027. It also introduces a structured compliance trajectory for EHR systems and cross-border data use, which affects product design, interoperability planning, and contracting due diligence for multinational virtual care deployments.
Value Chain Analysis
The virtual care value chain connects technology enablement and clinical operations with payer reimbursement and downstream continuity of care. Upstream inputs include cloud infrastructure, cybersecurity controls, identity and access management, interoperability tooling (including FHIR-aligned integration), and regulated digital health components such as clinical decision support modules and connected examination devices. Core solution layers cover virtual visit modalities (video, audio, messaging, asynchronous), care orchestration (scheduling, documentation, triage, and routing), and data services (remote monitoring ingestion, analytics, and quality reporting). Delivery and fulfillment also extend beyond software into clinical staffing networks, pharmacy benefit integration, and at-home diagnostic logistics, which increases the operational weight of last-mile coordination for virtual-first primary care and chronic-care programs.
Downstream, payers and employers influence scale through coverage policies, utilization management, and outcomes-based contracting, while hospitals and clinics increasingly consolidate point solutions into enterprise platforms to reduce operational friction. Quality and performance frameworks are also becoming part of commercial execution, with bodies such as NCQA publishing virtual care-focused materials to support standardized measurement in payer-provider agreements. Recent ecosystem activity reflects convergence across the chain, including provider-platform partnerships that embed clinical AI into EMR workflows, for example Novant Health's 24/7 hybrid virtual primary care partnership with K Health, plus capability expansion in remote examination and immersive therapy platforms that link regulated devices, software, and reimbursable care pathways.
Competitive Landscape
Market fragmentation persists, yet 2024 M&A activity rose 63% as private equity and strategic buyers sought scale and differentiated technology. Teladoc Health completed 18.4 million visits in 2023 and deepened vertical integration by acquiring Catapult Health (at-home diagnostics) and UpLift (mental health) for a combined USD 95 million in 2025. Transcarent’s merger with Accolade couples advocacy with provider navigation, illustrating convergence between care delivery and benefits management. AI differentiation remains paramount, with K Health’s chatbot outperforming physicians on antibiotic stewardship in clinical trials, prompting regional payers to subsidize its deployment.
White-space opportunities center on immersive therapies and satellite-connected rural outreach. Fabric’s four-acquisition spree expanded coverage to 100 million lives and built a national virtual urgent-care backbone. Specialist segments such as tele-cardiology attract new entrants leveraging FDA-cleared connected stethoscopes that synchronize with EHRs. Competitive pressure intensifies in primary care where commoditization depresses margins; hence multi-service ecosystems and employer channels increasingly determine defensibility. Vendors that package chronic-care, mental-health, and preventive bundles under one contract appeal to payers aiming to simplify vendor ecosystems.
The power balance also shifts as large health systems build proprietary platforms, sometimes white-labeling technology from established vendors but retaining branding and data ownership. Start-ups without clear differentiation face rising customer-acquisition costs and stricter hospital procurement standards that favor cybersecurity-certified suppliers. Over the forecast horizon, winners will combine AI-driven clinical pathways, robust payer contracts, and proven enterprise security postures to consolidate a greater slice of the virtual care market.
Global Virtual Care Industry Leaders
Teladoc Health, Inc.
CVS Health
American Well Corporation
MDLIVE
Oracle Corporation (Cerner)
- *Disclaimer: Major Players sorted in no particular order
Global Virtual Care Market Companies Covered in this Report
- Teladoc Health Inc
- Amwell
- MDLive (Evernorth)
- Doctor On Demand / Included Health
- Babylon Health
- Practo Technologies
- Ping An Good Doctor
- Doctor Anywhere
- 98point6
- Livongo Health
- Omada Health
- Hims & Hers Health
- Koninklijke Philips
- GE Healthcare
- Siemens Healthineers
- Medtronic
- Cisco Systems
- Google Cloud Healthcare
- Microsoft
- CVS Health

Market Opportunities and Future Outlook
One opportunity involves converting the current US reimbursement window into scaled enterprise deployments that move beyond episodic urgent care into longitudinal programs. CMS telehealth flexibilities extending through December 31, 2027, together with CMS policy changes effective January 1, 2026, including removal of certain inpatient and nursing facility frequency limits and expanded virtual supervision options for teaching settings, support broader normalization of virtual pathways across hospitals, academic health systems, and home-centric models. In Europe, EHDS (Regulation (EU) 2025/327, in force since March 26, 2025) creates whitespace for vendors that can operationalize interoperability, security, and governance requirements through implementation and managed services, particularly for cross-border deployments and multi-country payer-provider groups.
On the demand and product side, platform differentiation is increasingly tied to AI-enabled navigation, triage, and operational automation integrated into existing clinical and member-service workflows. CVS Health provides an example through initiatives that combine consumer engagement with service automation, including AI partnerships and expanded digital programs through MinuteClinic and Aetna. Health-system deployments also show this direction, such as Novant Health partnering with K Health to deliver AI-enabled 24/7 virtual primary care with EMR integration. Retail and payer distribution partnerships further expand access points, including Teladoc's availability through Walmart's Better Care Services, which reinforces go-to-market models that combine trusted consumer front doors with vertically integrated virtual clinical services.
Recent Industry Developments in Global Virtual Care Market
- June 2026: CVS Health expanded support around GLP-1 therapy through CVS Pharmacy and coupled it with a MinuteClinic digital program that includes virtual video visits for weight management and therapy evaluation. The change extends virtual care into higher-frequency longitudinal medication journeys, connecting virtual assessment, pharmacy support, and adherence services under one consumer-facing brand.
- August 2025: Teladoc Health acquired Australian virtual care provider Telecare to expand specialist and allied health access in public and private settings. The acquisition strengthens Teladoc's international footprint and adds localized delivery capability that supports multi-market scaling beyond North America.
- February 2024: Amwell expanded its presence in Australia through a partnership with Amplar Health. The agreement broadened Amwell's reach in a developed market where health systems are adopting hybrid care models, supporting regional platform utilization and reference deployments.


Global Virtual Care Market Report Scope and Research Methodology
Market Definition and Coverage
For this study, the virtual care market is defined as healthcare services delivered remotely through digital channels, where patients and clinicians interact via video, audio, or secure messaging, and where the service is used for clinical care.
Scope exclusions: We exclude general wellness apps that do not support clinician led care, as well as non clinical IT services that are not directly tied to delivering virtual visits.
Segments Covered in This Report
- By Component (Value)
- Hardware
- Software
- Services
- By Delivery Mode (Value)
- Video Consultation
- Audio Consultation
- Messaging
- Asynchronous (Store-and-Forward)
- VR / AR-Enabled Care
- Others
- By Application (Value)
- Primary Care
- Specialty Consultation
- Chronic Disease Management
- Mental Health Services
- Post-Acute & Rehabilitation
- Wellness & Preventive Care
- By End User (Value)
- Hospitals & Clinics
- Physician Practices
- Home-Care Settings
- Employers & Payers
- Government & Defense Facilities
- Patients
- By Geography (Value)
- North America
- United States
- Canada
- Mexico
- Europe
- Germany
- United Kingdom
- France
- Italy
- Spain
- Rest of Europe
- Asia-Pacific
- China
- India
- Japan
- South Korea
- Australia
- Rest of Asia-Pacific
- South America
- Brazil
- Argentina
- Rest of South America
- Middle East and Africa
- GCC
- South Africa
- Rest of Middle East and Africa
- North America
Data Sources, Market Sizing, and Validation
Desk Research
Desk work starts with aligning what is counted as virtual care and what is not, because similar terms like telehealth, remote care, and digital health are used differently in public data. We use public health spending and utilization signals to anchor the demand environment, and then match those signals to the virtual care delivery formats covered in the market definition.
Key references include public sources such as the World Health Organization, the OECD health statistics, the US Centers for Medicare and Medicaid Services, the US Centers for Disease Control and Prevention, and the US Food and Drug Administration for policy, adoption, and care delivery context. We also review company filings, investor presentations, reimbursement and coding guidance, and credible press, followed by selective use of paid subscriptions for company financials and intelligence, news and financials, patent databases, and global contracts and tenders where relevant to virtual care programs. These examples are not exhaustive, and many other public and proprietary sources were used to collect data, validate assumptions, and clarify gaps.
Primary Interviews and Surveys
Primary work focuses on validating how virtual care is being purchased and delivered across major regions, and then pressure testing the adoption and pricing assumptions used in the model. We speak with a mix of provider side leaders, payer and employer stakeholders, and solution side executives, followed by functional owners who can confirm utilization patterns, reimbursement realities, and expected shifts in visit mix and remote monitoring attachment.
Distribution of primary research fieldwork respondents
| Company type | Respondent position | Region |
|---|---|---|
| Top tier: 28% | CXOs: 16% | APAC: 48% |
| Mid tier: 50% | Functional/Unit leaders: 31% | EMEA: 31% |
| Smaller Players: 22% | Managers: 53% | Americas: 21% |
Market-Sizing & Forecasting
Sizing starts from a top-down build where care delivery and reimbursement signals are used to reconstruct the addressable pool for virtual visits and related remote care touchpoints, which is then mapped to value using realistic pricing and mix assumptions. The totals are corroborated through selective bottom-up approximations, such as sampled revenue disclosures, channel checks with provider groups, and a simple volume times average selling price cross-check for key delivery modes.
In the model, a few inputs do most of the heavy lifting, and they are kept transparent so they can be debated and updated. These include virtual visit volumes by delivery mode (video, audio, and messaging), reimbursement parity and coverage rules, clinician and patient adoption rates by setting of care, average price per visit and expected discounting over time, and the share of care shifted to home and chronic disease pathways. Where direct volume data is thin, gaps are handled through proxy metrics like outpatient visit bases, digital access indicators, and expert confirmed penetration rates, and then adjusted to avoid double counting across hybrid workflows.
Forecasting is done using scenario analysis supported by variable level expert consensus, because policy, reimbursement, and capacity constraints can move faster than historical time series. The base case is kept consistent across regions, and sensitivity checks are run on utilization growth, pricing, and coverage expansion to keep the final forecast practical.
Data Validation & Update Cycle
Outputs are validated through triangulation across demand signals, supply side capacity, and the pricing logic used in the market build. We run variance checks across regions, time periods, and delivery modes, and outliers are reviewed until the driver is understood (for example, a one time policy shift or a temporary utilization spike). A multi step analyst review is used before sign off, and respondents are re contacted when large deviations show up between modeled results and what is being seen in contracting or utilization.
Reports are refreshed annually, and interim updates are made when material events change coverage, reimbursement, or service delivery patterns. Before delivery, the analyst performs a fresh pass to capture the latest public updates and ensure the numbers remain aligned with the stated scope.
Mordor Intelligence's Virtual Care Market Size Compared With Other Published Estimates
Published market values for virtual care often vary because the underlying scope choices are not consistent, and because different studies treat pricing and utilization growth differently across regions. Variations also show up when adjacent categories are bundled together, or when the base year and currency timing do not match.
The main gap comes from whether remote patient monitoring hardware and broad digital health software are bundled into the same total, where Mordor Intelligence counts virtual care around clinician delivered interactions by video, audio, and messaging, and then keeps add on components from inflating the core service value. Differences can also come from using aggressive post pandemic utilization ramps, applying global average prices without payer mix adjustments, or not re checking assumptions against reimbursement and adoption signals as policies evolve.
Benchmark comparison
| Source | Market Size | Gaps in Research Methodology |
|---|---|---|
| Mordor Intelligence | USD 20.33 B (2026) | |
| Industry Publisher A | USD 16.20 B (2024) | Uses a different base year and a broader virtual healthcare delivery framing that can mix teleconsultation and remote monitoring components, which changes what is counted and how growth is applied. |
| Industry Publisher B | USD 8.86 B (2024) | Applies a shorter starting base and an alternate forecast window, and the scope description suggests a tighter included value pool that can undercount reimbursed visit volume when regional coverage and payer rules are not normalized. |
The spread across published figures is largely explained by what is included next to virtual visits, and by how fast utilization and pricing are allowed to move over time. By keeping the included services and conversion steps visible, the estimate stays traceable to practical demand and reimbursement drivers that can be checked and updated.


Key Questions Answered in the Report
What is the current virtual care market size and projected growth?
The virtual care market size stands at USD 20.33 billion in 2026 and is projected to reach USD 63.53 billion by 2031, growing at a 25.58% CAGR.
Which component leads the virtual care market share today?
Services lead with 53.84% of revenue in 2025, reflecting the labor intensity of clinical delivery.
Why is Asia-Pacific the fastest-growing regional market?
Asia-Pacific benefits from government investment, rapid digital adoption, and large underserved populations, driving a 29.44% CAGR forecast through 2031.
How are reimbursement changes affecting market expansion?
Permanent payment-parity laws and extended Medicare waivers guarantee sustainable revenue streams and encourage provider investment in virtual models.
Which application segment is expanding the quickest?
Mental health services are advancing at a 28.22% CAGR, propelled by ongoing demand for telepsychiatry and digital behavioral-health tools.
What restrains faster global adoption of virtual care?
Key barriers include uneven broadband access, evolving privacy regulations, interstate licensure constraints, and escalating cybersecurity threats.
Page last updated on:


 Your data is secure and never sold or shared.


