
Viral Vector Manufacturing Market Size and Share
Market Overview
| Study Period | 2020 - 2031 |
|---|---|
| Market Size (2026) | USD 3.55 Billion |
| Market Size (2031) | USD 9.02 Billion |
| Growth Rate (2026 - 2031) | 20.49 % |
| Fastest Growing Market | Asia-Pacific |
| Largest Market | North America |
| Market Concentration | Medium |
Major Players *Disclaimer: Major Players sorted in no particular order Image © Mordor Intelligence. Reuse requires attribution under CC BY 4.0. | |
Viral Vector Manufacturing Market Analysis by Mordor Intelligence
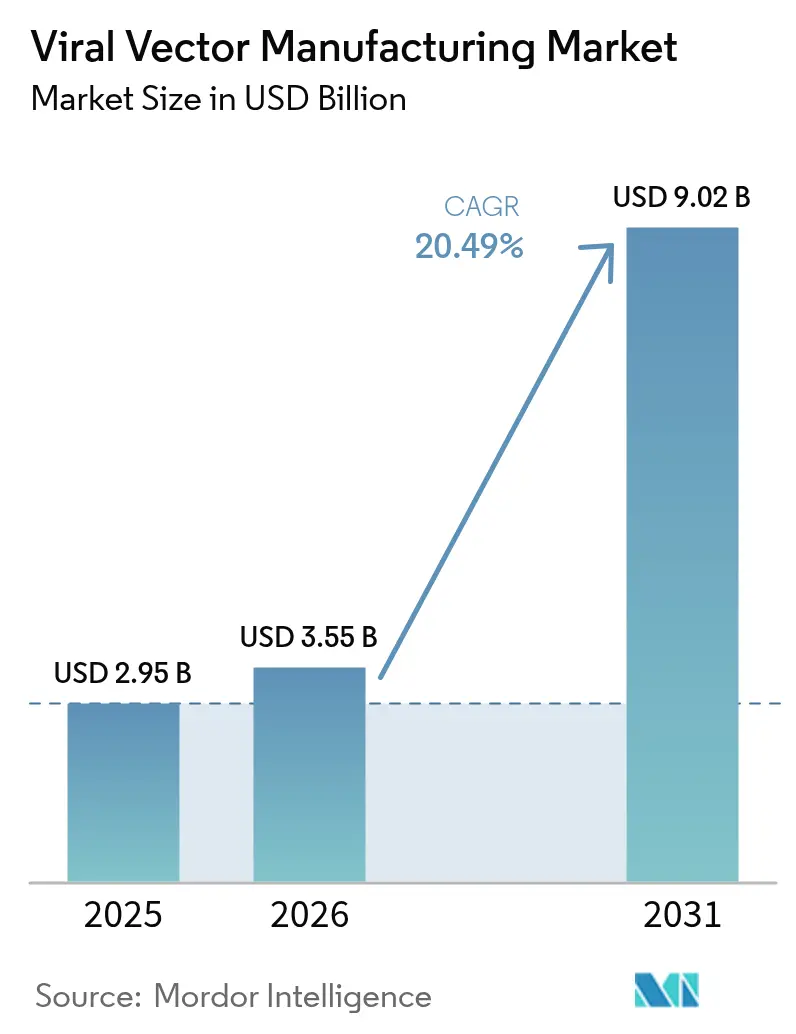
The Viral Vector Manufacturing market size is expected to grow from USD 2.95 billion in 2025 to USD 3.55 billion in 2026 and is forecast to reach USD 9.02 billion by 2031 at 20.49% CAGR over 2026-2031.
This trajectory mirrors the transformation of gene therapy from an experimental niche into a regulated treatment class as the tally of FDA-cleared products climbed to 14 in 2024. Breakthrough authorizations such as Casgevy for sickle cell disease and new indications for Elevidys in Duchenne muscular dystrophy validated commercial demand and accelerated funding for production infrastructure. More than USD 8 billion in green- and brown-field projects were announced by major CDMOs during 2024-2025, led by Fujifilm Diosynth and Lonza, yet many suites still run below 50% utilization because they were designed for early-phase work rather than sustained commercial output. Consolidation is intensifying as acquirers chase end-to-end capabilities, advanced analytics and regulatory know-how that shorten time to market.
Key Report Takeaways
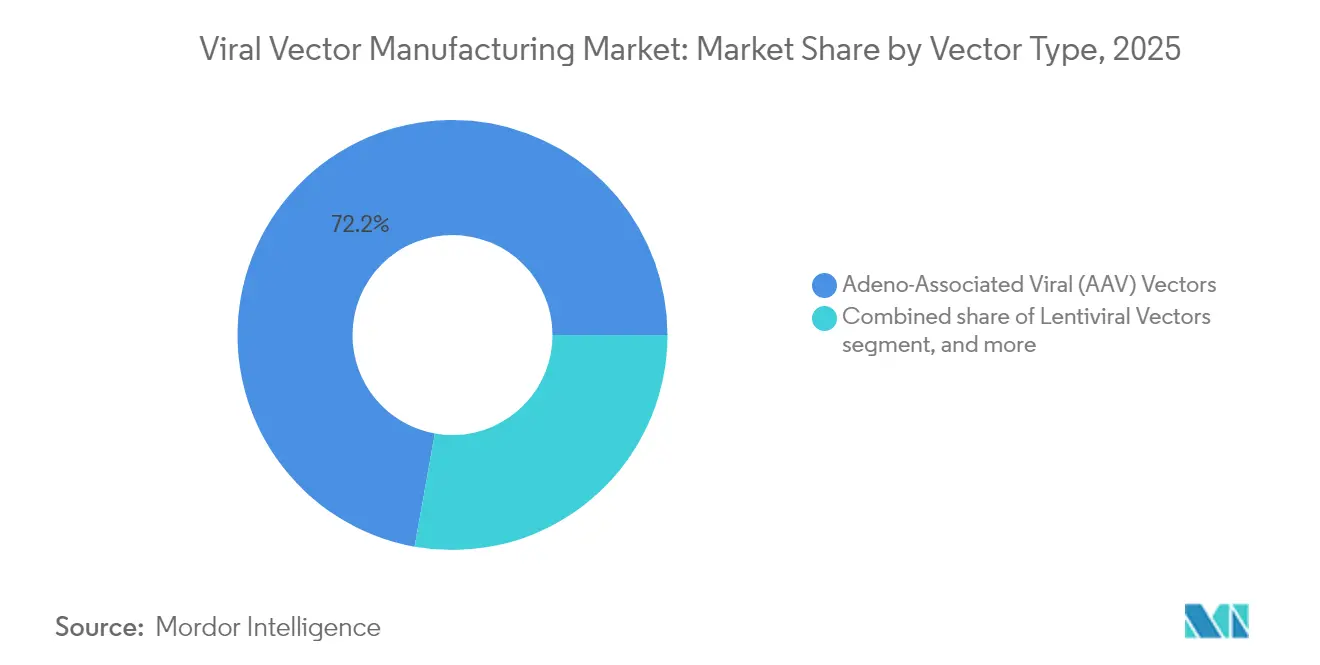
- By vector type, adeno-associated viral platforms accounted for 72.18% of 2025 revenue while adenoviral vectors are projected to grow at a 22.9% CAGR to 2031.
- By disease, genetic disorders represented 48.10% of the viral vector manufacturing market share in 2025; neurological disorders are set to expand at 23.6% CAGR through 2031.
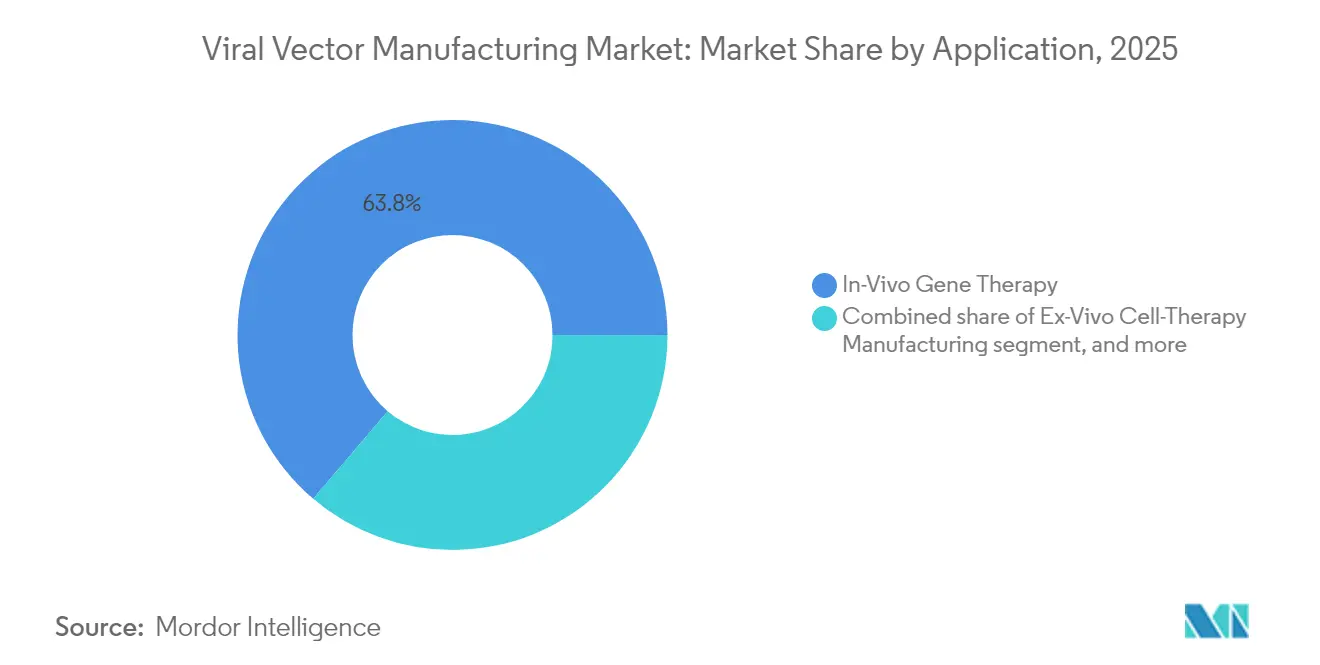
- By application, in-vivo therapies held 63.78% of the viral vector manufacturing market size in 2025 and ex-vivo cell therapies are advancing at a 22.9% CAGR to 2031.
- By mode of manufacturing, in-house production captured 61.70% of the viral vector manufacturing market revenue in 2025, whereas contract manufacturing is forecast to post a 23.4% CAGR to 2031.
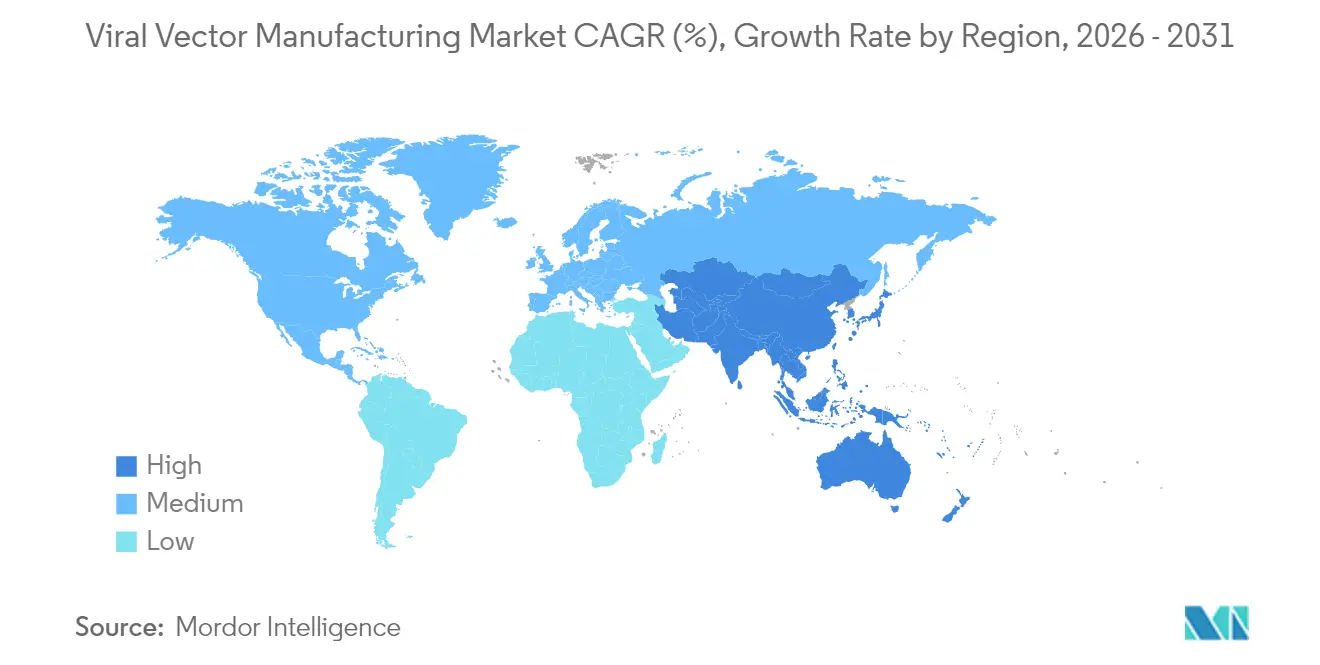
- By geography, North America commanded 46.95% of 2025 revenue and Asia-Pacific is projected to grow at 21.8% CAGR between 2026 and 2031.
Note: Market size and forecast figures in this report are generated using Mordor Intelligence’s proprietary estimation framework, updated with the latest available data and insights as of 2026.
Market Trends and Insights
Drivers Impact Analysis of Viral Vector Manufacturing Market*
| Driver | % Impact on CAGR Forecast | Geographic Relevance | Impact Timeline |
|---|---|---|---|
| Growing gene therapy pipeline and clinical successes | +4.2% | North America, EU, Asia-Pacific | Medium term (2-4 years) |
| Increasing CDMO outsourcing and capacity expansions | +3.8% | North America, Asia-Pacific | Short term (≤ 2 years) |
| Strong venture capital and government funding | +3.1% | North America, EU, China, Singapore | Medium term (2-4 years) |
| Transition to suspension cell culture platforms | +2.9% | Global hubs | Long term (≥ 4 years) |
| Adoption of single-use bioreactors | +2.7% | Global | Short term (≤ 2 years) |
| Emerging AI-guided capsid engineering | +2.4% | North America, EU, select APAC | Long term (≥ 4 years) |
| Source: Mordor Intelligence | |||


Growing Gene Therapy Pipeline and Clinical Successes
More than 2,000 gene therapies were under development by 2024, underscoring the breadth of indications progressing toward commercialization[1]Food and Drug Administration, “Novel Gene Therapy Approvals and Guidance Documents,” fda.gov. Approval of Kebilidi for aromatic L-amino acid decarboxylase deficiency marked the first therapeutic option for this rare neurologic disorder and established a regulatory precedent for intraparenchymal AAV delivery. The BENEGENE-2 trial reported a 71% fall in bleeding episodes for hemophilia B, confirming durable factor IX expression. Such clinical milestones strengthen payer confidence and stimulate larger patient cohort studies, which in turn expand batch-volume requirements inside the viral vector manufacturing market. As process know-how improves, average AAV dose costs have dropped into the tens of thousands of dollars, enabling exploration of common diseases without sacrificing economic viability.
Increasing CDMO Outsourcing and Capacity Expansions
CDMOs and hybrid manufacturers are expected to own 54% of global biologics capacity by 2028—up from 43% in 2024—reflecting a decisive move toward asset-light models among therapy developers. Charles River’s partnership with the Gates Institute for lentiviral services and Takara Bio’s deployment of 5,000 L single-use reactors illustrate the specialized scale sponsors now rent instead of build. UniQure sold its Lexington plant and outsourced Hemgenix manufacturing to Genezen, demonstrating the economic calculus that favors external production for high-complexity vectors. Resilience invested USD 225 million to boost output beyond 200 million units by 2025, showing how fast demand is rising in the viral vector manufacturing market.
Strong Venture Capital and Government Funding in Cell & Gene Therapies
Despite a wider biotech funding cooldown, investors poured capital into manufacturable platforms. VectorBuilder secured USD 76 million for a 30-suite Guangzhou facility, while China earmarked USD 4.17 billion for biomanufacturing projects starting in 2025. Germany’s national strategy backed Roche’s EUR 90 million gene therapy center in Penzberg. Venture financing for gene-editing companies dipped to USD 280 million in 2024 but early-2025 rounds point to renewed confidence as programs reach pivotal trials. Capital allocation now favors ventures that demonstrate scalable, quality-assured production paths within the viral vector manufacturing market.
Emerging AI-Guided Capsid Engineering Strategies
Machine-learning frameworks such as CAP-PLM predict AAV capsid fitness with high accuracy, allowing developers to narrow experimental libraries and cut discovery cycle[2]Phys.org Editors, “Machine Learning Elevates AAV Capsid Design,” phys.org. Better-designed capsids can halve vector dose requirements, easing cost pressures and freeing fermenter space. Early adopters in the United States and Europe have integrated AI platforms into process development, signalling long-term efficiency gains for the viral vector manufacturing market.
Restraints Impact Analysis of Viral Vector Manufacturing Market*
| Restraints Impact Analysis | (~) % Impact on CAGR Forecast | Geographic Relevance | Impact Timeline |
|---|---|---|---|
| High cost of goods and therapy pricing concerns | –2.8% | Global, with emphasis on price-sensitive markets | Medium term (2-4 years) |
| Regulatory complexity and batch-release delays | –2.1% | Global, varying by regulatory jurisdiction | Short term (≤ 2 years) |
| Supply chain constraints for GMP-grade plasmids | –1.9% | North America, Europe, Asia-Pacific manufacturing hubs | Short term (≤ 2 years) |
| Competition from non-viral delivery technologies | –1.7% | Global, notably in advanced therapy innovation clusters | Long term (≥ 4 years) |
| Source: Mordor Intelligence | |||
High Cost of Goods and Therapy Pricing Concerns
AAV production still spans around three weeks and costs roughly USD 50,000 per construct, with empty capsids inflating volumes and complicating titer calculations[3]Form Bio Product Team, “AI-Enabled Vector Design Platform,” formbio.com. Commercial prices remain high—Casgevy lists at USD 2.2 million and Hemgenix at USD 3.5 million per patient—raising payer concerns about affordability. Ethical debates over equitable access limit market penetration in low-income regions. Platform manufacturing, higher cell densities and in-line analytics are reducing waste, yet major savings will appear only as late-stage portfolios mature and volumes rise inside the viral vector manufacturing market.
Regulatory Complexity and Batch-Release Delays
The FDA’s Q5A(R2) revision deepened viral safety requirements and lengthened validation packages. Distinguishing full from empty capsids demands analytical ultracentrifugation or mass photometry that many plants lack. Workforce shortages for these niche skills add further lags. The EMA is harmonizing guidelines, yet staggered national timelines force manufacturers to navigate parallel pathways. These hurdles slow product launches and dampen growth prospects for the viral vector manufacturing market.
*Our forecasts treat driver/restraint impacts as directional, not additive. The impact forecasts reflect baseline growth, mix effects, and variable interactions.
Viral Vector Manufacturing Market Segment Analysis
By Vector Type:
AAV Dominance Drives Market ExpansionAAV vectors delivered 72.18% of the viral vector manufacturing market revenue in 2025 as favorable safety, tissue tropism and six FDA-approved therapies anchored demand. The viral vector manufacturing market size for AAV products is expected to increase sharply as hemophilia and muscular dystrophy treatments scale commercial volumes. More than 225 active trials rely on AAV backbones, cementing multiyear capacity needs. CDMOs are commissioning AAV-dedicated suites that leverage suspension bioreactors to lift productivity.
Adenoviral vectors hold the fastest growth outlook at 22.9% CAGR through 2031. Novel serotype engineering mitigates pre-existing immunity, opening repeat-dose vaccine and oncolytic applications. Lentiviral vectors remain essential for autologous CAR-T workflows; improved pH control and competitive inhibition now curb 62.1% functional-particle loss once common in manufacturing. Retroviral and oncolytic platforms serve niche oncology uses, often in combination with checkpoint inhibitors, and benefit from proprietary cell-line partnerships that enhance yield.


By Disease:
Genetic Disorders Lead Therapeutic ApplicationsGenetic disorders accounted for 48.10% of the viral vector manufacturing market revenue in 2025, among all indications as curative outcomes justified premium pricing structures. Long-term data in hemophilia A, hemophilia B and sickle cell disease incentivized payers to adopt outcome-based payment schemes. The viral vector manufacturing market size for these rare conditions remains sizable due to pent-up demand, newborn screening programs and expanded label use.
Neurological disorders are slated to record a 23.6% CAGR through 2031. Intrathecal and intraparenchymal delivery methods overcame earlier barriers posed by the blood-brain barrier. Positive safety and efficacy readouts in spinal muscular atrophy and inherited retinal diseases are driving new Parkinson’s and ALS candidates. Oncology retains a stable share via CAR-T therapies that depend on lentiviral backbones, while infectious disease projects pivot toward adenoviral vectors during outbreak scenarios.
By Application:
In-Vivo Therapies Drive Market GrowthIn-vivo therapies captured 63.78% of the viral vector manufacturing market revenue in 2025 because they require only vector manufacture instead of individualized cell manipulation. Recent capsid innovations raised transduction efficiency, allowing lower doses and shortening infusion times. Two intramuscular AAV candidates filed in 2025 highlight the widening substrate for direct administration.
Ex-vivo cell therapy programs hold the highest growth rate at 22.9% CAGR, propelled by edits for sickle cell disease and beta-thalassemia that validated manufacturing economics. Engineered producer lines such as NuPro-2S reduce DNA impurities by 89%, improving consistency. Preventive vaccinology leverages adenoviral vectors for pandemic preparedness but faces competitive pressure from rapidly adaptable mRNA platforms.
By Mode of Manufacturing:
Contract Manufacturing AcceleratesIn-house suites still generated 61.70% of 2025 revenue as firms safeguarded process knowledge. However, capacity limits and escalating CapEx have led numerous sponsors to shift toward external partners. The viral vector manufacturing market is therefore tilting toward CDMOs that supply turn-key analytics, process validation and regulatory support.
Contract services are expected to grow at 23.4% CAGR to 2031. Lonza’s USD 1.2 billion Vacaville acquisition and Fujifilm Diosynth’s USD 1.2 billion North Carolina expansion each added more than 300,000 L of bioreactor volume. Hybrid strategies are gaining favor as developers keep small-scale R&D internal while outsourcing commercial lots, giving flexibility without foregoing core intellectual property control.
Geography Analysis
North America Viral Vector Manufacturing Market
North America held 46.95% of 2025 revenue, driven by the FDA’s clear regulatory road map and dense biotechnology clusters in Boston, Research Triangle Park and the San Francisco Bay Area. Resilience’s USD 225 million capacity build in Ohio and GenScript ProBio’s 128,000 ft² New Jersey site underline investor faith in domestic infrastructure. The region also benefits from the deepest labor pool of vector-skilled specialists.
Europe Viral Vector Manufacturing Market
Europe ranked second and received a boost from Germany’s EUR 90 million Penzberg center and Novartis’ fully robotized USD 43 million facility in Slovenia. Harmonized EMA guidelines streamline filings, although Brexit still imposes dual-site quality reviews for products crossing the Channel. Environmental regulations in the EU encourage single-use systems that lower water usage and carbon footprints, influencing procurement policies across the viral vector manufacturing market.
APAC Viral Vector Manufacturing Market
Asia-Pacific is projected to register a 21.8% CAGR through 2031. China reserved USD 4.17 billion for biomanufacturing lines beginning in 2025, while Japan, India and South Korea upgrade regulatory frameworks to attract multinational trials. WuXi Biologics reported 2024 revenue growth that funds additional vector lines in Wuxi and Suzhou. Large treatment-naïve patient pools and competitive operating costs make the region a preferred launchpad for late-phase outsourcing.

Regulatory Landscape
Viral vectors for gene and cell therapies are regulated under stringent GMP regimes, with manufacturing expectations shaped by regulators such as the US FDA (CBER) and the European Medicines Agency (EMA). A recurring compliance theme across markets is viral safety and adventitious agent control, anchored by the harmonized ICH Q5A(R2) framework, which guides cell line testing, process-related viral clearance expectations, and final product testing packages for biologics, including viral-vector-based products.
Regulatory friction persists across jurisdictions because classification and documentation requirements can diverge, for example, FDA treatment of vectors as drug substances versus EMA approaches that can position vectors as starting materials in some contexts. This divergence increases the burden for sponsors running parallel CMC strategies. In 2026, US trade policy also became a relevant external factor for supply chains: an April 2, 2026 proclamation introduced tariffs on imported patented pharmaceuticals and associated ingredients, and the US Department of Commerce published procedures in May 2026 for companies to apply for Onshoring Agreements, with applications due by June 12, 2026, adding another compliance-driven consideration for where critical inputs and manufacturing steps are located.
Value Chain Analysis
The viral vector manufacturing value chain starts with critical inputs and enabling platforms, including GMP-grade plasmid DNA, producer cell lines (for example, 293-derived systems), cell culture media and single-use components, and a specialized analytics toolset used to characterize identity, genome titer, infectivity, and potency. Upstream processing is still often based on transient transfection for AAV and lentiviral vectors, while the industry shift toward stable producer systems reflects the need for higher consistency and better scalable economics. Technology providers also contribute yield-enhancing and process-acceleration tools that can be integrated into CDMO workflows.
Core value creation occurs at GMP manufacturers and CDMOs that perform upstream production, downstream purification, and quality control and release testing for clinical and commercial supply. Downstream purification remains a prominent bottleneck, and industry technical literature points to processing-related rAAV yield loss, alongside scale-up constraints concentrated in chromatography and tangential flow filtration capacity and know-how. Manufacturers increasingly pursue integrated end-to-end service models and alliances that link upstream and downstream capabilities, illustrated by collaborations such as Ginkgo Bioworks with Virica Biotech (October 2024) to enhance AAV production titers, VectorBuilder with EurekaBio (February 2025) to integrate a stable lentiviral production system into GMP workflows, and Wacker Biotech with Expression Manufacturing (May 2025) to provide an end-to-end lentiviral vector solution.
Competitive Landscape
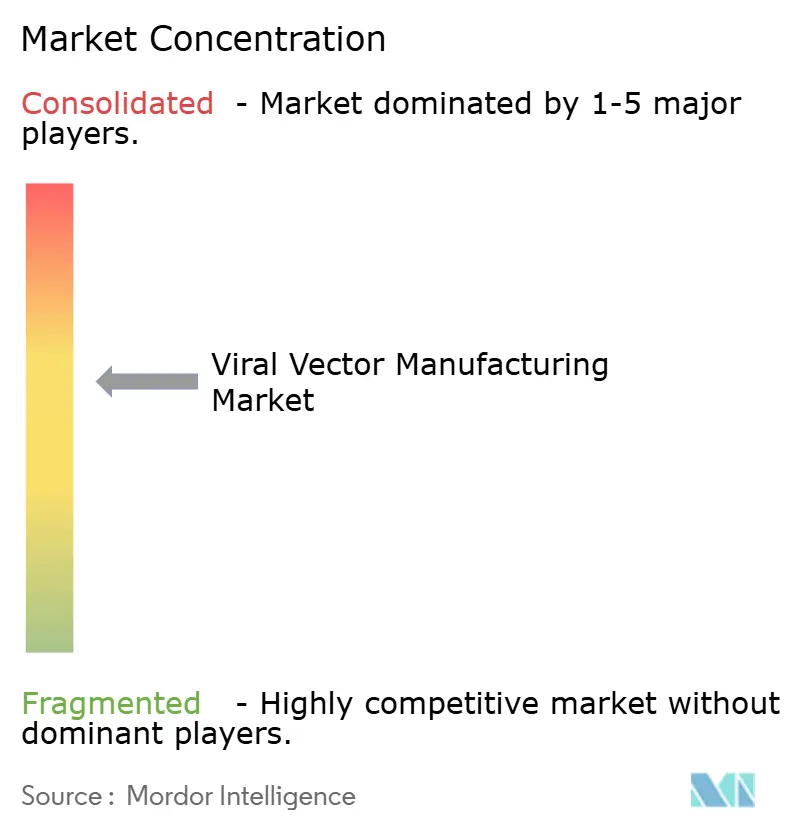
The viral vector manufacturing market shows moderate concentration as leading CDMOs acquire specialty firms to integrate cell-line development, analytical assays and fill-finish under one roof. Charles River’s USD 292.5 million purchase of Vigene Biosciences, Merck KGaA’s USD 600 million acquisition of Mirus Bio and Lonza’s USD 1.2 billion buyout of Genentech’s Vacaville plant illustrate the premiums paid for proven scalability.
Technology differentiation is now essential. Form Bio’s AI engine predicts optimal AAV capsids, reducing trial-and-error loops and shaving months off development timelines. Engineered cell lines that cut residual DNA below regulatory thresholds and AI-driven digital twins that forecast batch yields provide measurable performance gains. Operators without such toolsets risk competing on price rather than value-added science.
White-space prospects lie in emerging markets and niche vectors. VIVEbiotech raised fresh capital to expand lentiviral services for neuro-oncology programs. ViroCell Biologics completed oversubscribed financing to accelerate clinical-stage production in the United Kingdom. New entrants can still gain traction by specializing in rare serotypes, regional fill-finish, or next-generation analytics.
Viral Vector Manufacturing Industry Leaders
Lonza
Thermo Fisher Scientific, Inc.
Charles River Laboratories
Fujifilm Diosynth Biotechnologies
Catalent
- *Disclaimer: Major Players sorted in no particular order
Viral Vector Manufacturing Market Companies Covered in this Report
- Lonza Group
- Thermo Fisher Scientific
- Charles River
- FUJIFILM
- Catalent
- Kaneka
- Merck KGaA (MilliporeSigma)
- Oxford Biomedica
- UniQure
- Spark Therapeutics (Roche)
- Cytiva
- Yposkesi (Servier)
- Viralgen Vector Core
- Aldevron
- Vibalogics
- Waisman Biomanufacturing
- Novasep
- Genezen
- bluebird Bio

Market Opportunities and Future Outlook
Commercial-scale qualification and targeted greenfield and brownfield buildouts are expanding the addressable pool of viral-vector capacity for late-stage and marketed therapies, creating opportunity for CDMOs that can demonstrate validated suites, robust QC, and reproducible tech transfer. A recent example is SK pharmteco announcing in March 2026 the successful cGMP qualification of its commercial-scale viral vector manufacturing facility in Corbeil-Essonnes, France, designed with 12 single-use bioreactors totaling 5,000 liters of upstream capacity. At the same time, sponsors are still prioritizing suppliers that can de-risk raw materials and process changes through regulator interaction, which sustains demand for providers with mature CMC and comparability playbooks.
Another opportunity area is cost and throughput improvement tied to persistent constraints in purification yield, analytics, and batch-release timelines. Shifting away from transient transfection toward stable producer cell lines, along with more standardized assay packages, can reduce variability and compress process development cycles. Co-locating plasmid and viral vector manufacturing can also improve coordination and reduce scheduling risk. The 128,000 square foot ProBio Center of Excellence opened in Hopewell, New Jersey (June 2025), and Oxford Biomedica’s acquisition of a commercial-scale viral vector facility in Durham, North Carolina (October 2025) further point to market pull for integrated capabilities near major US and EU clinical and commercialization hubs.
Recent Industry Developments in Viral Vector Manufacturing Market
- July 2026: Arcturus Therapeutics entered a strategic collaboration with Thermo Fisher Scientific for Phase 3 manufacturing and potential commercialization of ARCT-032. The arrangement includes Thermo Fisher receiving exclusive commercial manufacturing rights upon regulatory approval, tightening long-term capacity access and supply security for a late-stage program.
- March 2025: WuXi Biologics highlighted additions to viral vector capacity in Asia-Pacific while communicating its 2024 results and 2025 growth outlook. The update signaled continued regional investment by large-scale biomanufacturers, supporting outsourcing options for developers seeking time-to-clinic and cost advantages.
- December 2024: VIVEbiotech secured growth investment from Ampersand Capital Partners to expand its lentiviral vector services footprint. The financing supported further scaling of specialized LVV capacity, a key dependency for ex-vivo cell therapy manufacturing supply chains.


Viral Vector Manufacturing Market Report Scope and Research Methodology
Market Definition and Coverage
This market covers revenue generated from cGMP viral vector manufacturing used to supply clinical and commercial programs, where viral vectors are produced, purified, tested, and released for use in gene and cell therapy development and commercialization.
Scope exclusions: Research-grade non-GMP vector batches, plasmid DNA backbones, and single-use bioprocess equipment are excluded from the market value.
Segments Covered in This Report
- By Vector Type
- Adeno-Associated Viral (AAV) Vectors
- Lentiviral Vectors
- Adenoviral Vectors
- Retroviral & ?-Retroviral Vectors
- Oncolytic & Other Engineered Viruses
- By Disease
- Cancer
- Genetic Disorders
- Infectious Diseases
- Neurological Disorders
- Other Therapeutic Areas
- By Application
- In-Vivo Gene Therapy
- Ex-Vivo Cell-Therapy Manufacturing (CAR-T, TCR-T, Etc.)
- Preventive & Therapeutic Vaccinology
- By Mode Of Manufacturing
- In-House Manufacturing
- Contract Manufacturing (CDMOs)
- Geography
- North America
- United States
- Canada
- Mexico
- Europe
- Germany
- United Kingdom
- France
- Italy
- Spain
- Rest of Europe
- Asia-Pacific
- China
- Japan
- India
- Australia
- South Korea
- Rest of Asia-Pacific
- Middle East & Africa
- GCC
- South Africa
- Rest of Middle East & Africa
- South America
- Brazil
- Argentina
- Rest of South America
- North America
Data Sources, Market Sizing, and Validation
Desk Research
Desk work starts with public science and regulatory signals so we can size demand grounded in real development activity. Key sources include FDA and EMA public databases for gene therapy activity and approvals, ClinicalTrials.gov for pipeline counts and phases, and peer-reviewed manufacturing and analytics literature accessed through PubMed.
We also use association websites and public conference materials that describe capacity expansions, quality requirements, and process changes that affect manufacturing cost and output. For cross-checking company presence and scale, we review annual reports, investor presentations, and business press coverage, and we selectively use paid subscriptions that consolidate company financials, news, and patent filings to keep timelines and technology shifts consistent. These desk sources are not exhaustive, and additional public references are used for data collection, validation, and clarification during the work.
Primary Interviews and Surveys
Primary inputs are collected through expert interviews and structured surveys with CDMOs, in-house manufacturing teams, quality and regulatory specialists, and upstream and downstream process owners. Because the market is global, we also capture demand and capacity signals across APAC, EMEA, and the Americas to confirm utilization patterns, typical batch strategies, and where constraints are tightening or easing over time.
Distribution of primary research fieldwork respondents
| Company type | Respondent position | Region |
|---|---|---|
| Top tier: 27% | CXOs: 13% | APAC: 48% |
| Mid tier: 52% | Functional/Unit leaders: 40% | EMEA: 32% |
| Smaller Players: 21% | Managers: 47% | Americas: 20% |
Market-Sizing & Forecasting
Sizing is built mainly using a top-down model where clinical and commercial vector demand is reconstructed from the active gene and cell therapy pipeline, expected manufacturing intensity by phase, and the typical production footprint needed to supply programs over a year. To keep the inputs consistent, we map demand using a small set of repeatable variables, such as trial and program counts by phase, expected shift from preclinical to GMP supply, average batch sizes, yield and success assumptions for upstream and downstream steps, and testing and release requirements that add measurable manufacturing value.
After those totals are formed, we corroborate them with selective bottom-up approximations, including checks on sampled price per batch or price per dose, capacity and utilization discussions with manufacturers, and channel checks on outsourcing share between in-house sites and CDMOs. When bottom-up views are incomplete, we handle gaps through conservative interpolation tied to the closest observable signals, such as known capacity additions, announced suite expansions, and typical ramp-up times.
For the forecast, we run scenario analysis using expert consensus on what changes first and what changes more slowly in this market, including clinical graduation rates, outsourcing preference shifts, facility commissioning timelines, and expected efficiency gains from process improvements.
Data Validation & Update Cycle
Validation is done by comparing model outputs with independent signals, including pipeline growth, manufacturing capacity announcements, and expected utilization patterns by region, then checking whether implied pricing and output appear reasonable. Outliers are reviewed, assumptions are revisited, and re-contacts are triggered when a change can materially move the demand pool, such as a major approval, a site expansion, or a funding shift that alters manufacturing plans.
Each report is reviewed in multiple steps before sign-off, and the logic is checked for year-to-year consistency so any jumps are tied to real market events rather than spreadsheet noise. The study is refreshed annually, and interim updates are made when material events occur. Before delivery, we do a final pass to ensure clients receive the latest updated view.
Mordor Intelligence's Viral Vector Manufacturing Market Size Measured Against Other Published Estimates
Published market sizes for viral vector manufacturing can look far apart even when the growth story sounds similar, because the counted revenue pool is not always the same. Differences usually come from what is included in the manufacturing value, the year used for sizing, and how pricing and utilization are treated.
The main gap often comes from whether plasmid DNA and non-viral vector work are bundled into the same revenue number. In the Mordor Intelligence approach, only cGMP viral vector manufacturing value is counted, while plasmid DNA backbones and non-GMP research-grade batches are excluded, which can cause some broader estimates to appear higher for the same period.
Benchmark comparison
| Source | Market Size | Gaps in Research Methodology |
|---|---|---|
| Mordor Intelligence | USD 3.55 B (2026) | |
| Industry Research House A | USD 0.80 B (2025) | Uses a narrower revenue capture focused on manufacturer landscape reporting and may undercount full cGMP clinical and commercial manufacturing value, while also mixing in non-viral vector mentions that create scope ambiguity. |
| Trade Media Digest B | USD 1.50 B (2024) | Often relies on headline valuation snapshots and generalized CAGR narratives, with limited visibility on whether figures include research-grade work, adjacent inputs, or how currency timing and inflation adjustments were handled. |
Across the three figures, most of the spread is explained by scope choices and by how directly pricing and utilization are tied back to a defined GMP demand pool. By keeping the input variables visible and cross-checking them with capacity and pipeline signals, our estimate stays easier to reconcile and repeat when the market shifts.


Key Questions Answered in the Report
What is the current size of the viral vector manufacturing market?
The market is valued at USD 3.55 billion in 2026 and is projected to reach USD 9.02 billion by 2031 at a 20.49% CAGR.
Which vector type dominates the viral vector manufacturing market?
Adeno-associated viral platforms lead with a 72.18% revenue share thanks to favorable safety profiles and multiple FDA-approved therapies.
Why are CDMOs gaining importance in the viral vector manufacturing industry?
Developers prefer specialized CDMOs for their validated processes, advanced analytics and ready capacity, avoiding the high CapEx of building proprietary plants.
Which region is growing fastest in the viral vector manufacturing market?
Asia-Pacific is forecast to grow at a 21.8% CAGR through 2031, supported by China’s multi-billion-dollar biomanufacturing initiatives and expanding regional capabilities.
What is the main cost barrier for wider adoption of gene therapies?
High production expenses keep therapy prices in the USD 2 million–USD 3.5 million range, but process optimization is slowly reducing cost per dose.
How concentrated is competition in the viral vector manufacturing market?
The top five suppliers control about 60% of global commercial capacity, indicating moderate concentration that still allows new entrants to gain share.
Page last updated on:


 Your data is secure and never sold or shared.


