
Market Overview
| Study Period | 2020 - 2031 |
|---|---|
| Forecast Data Period | 2026 - 2031 |
| Base Year Market Size (2025) | USD 7.22 Billion |
| Market Size (2026) | USD 7.51 Billion |
| Market Size (2031) | USD 8.97 Billion |
| Growth Rate (2026 - 2031) | 3.62 % |
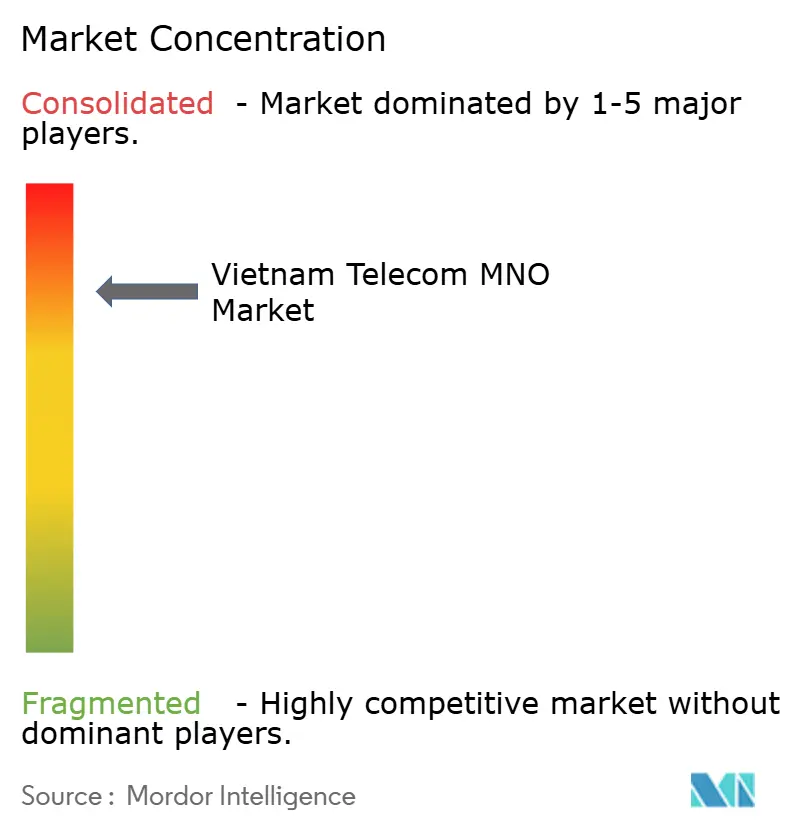
| Market Concentration | High |
Major Players *Disclaimer: Major Players sorted in no particular order Image © Mordor Intelligence. Reuse requires attribution under CC BY 4.0. | |
Vietnam Telecom MNO Market Analysis by Mordor Intelligence
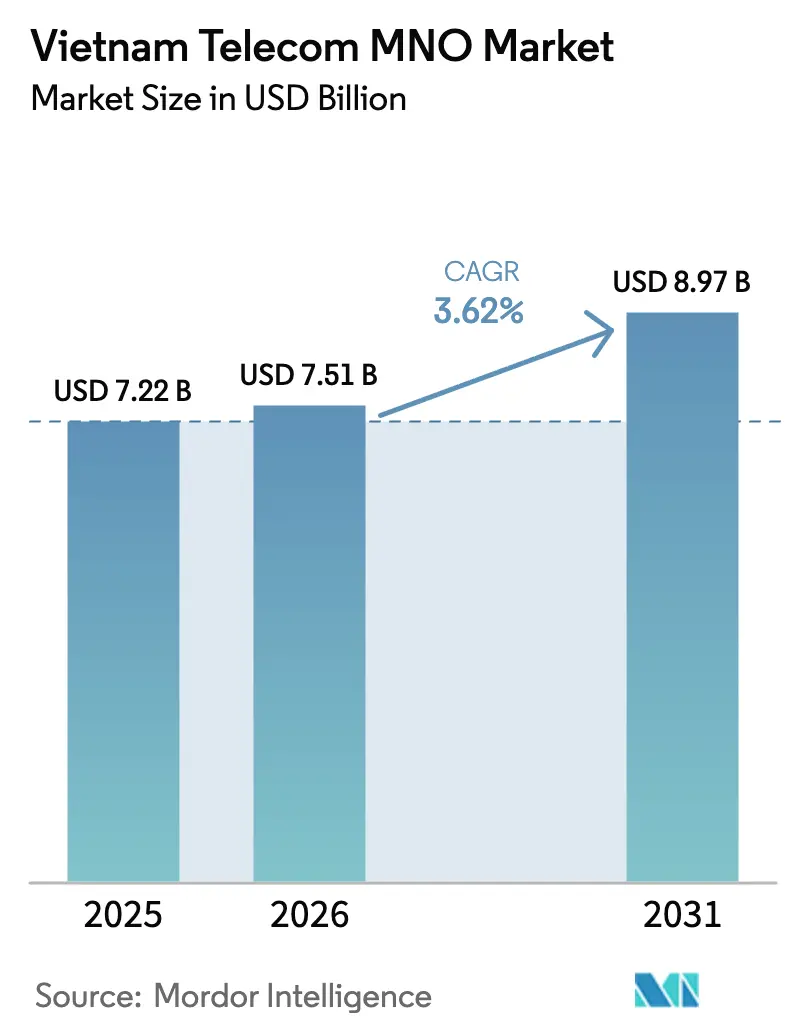
The Vietnam telecom MNO market size was valued at USD 7.22 billion in 2025 and was estimated to grow from USD 7.51 billion in 2026 to reach USD 8.97 billion by 2031, at a CAGR of 3.62% during the forecast period (2026-2031). Steady topline growth hides a fundamental pivot: voice is declining while mobile broadband already contributes nearly half of service revenue, and industrial IoT traffic is expanding faster than the sector average. Government incentives that subsidize 5G infrastructure, alongside the National Digital Transformation Program, are pushing operators to accelerate coverage, yet the same initiatives intensify rivalry because smaller carriers can now justify network rollouts in rural districts. Unlimited data packages keep average revenue per user in the USD 3-4 range, so scale efficiencies rather than pricing power determine profitability. At the same time, new data-sovereignty rules are forcing construction of edge data centers, lifting capital intensity but also opening enterprise opportunities in low-latency connectivity and private 5G slices.
Key Report Takeaways
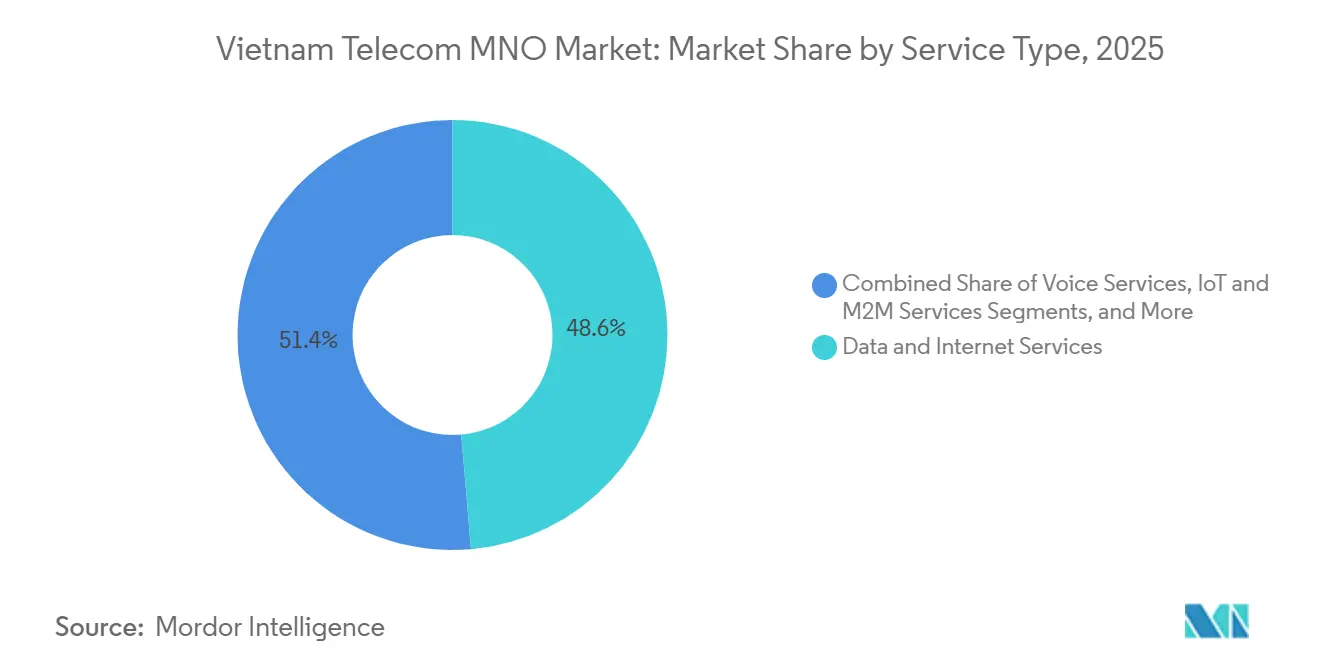
- By service type, data and internet services led with 48.62% of the Vietnam telecom MNO market share in 2025, while IoT and M2M are projected to post the fastest 4.12% CAGR through 2031.
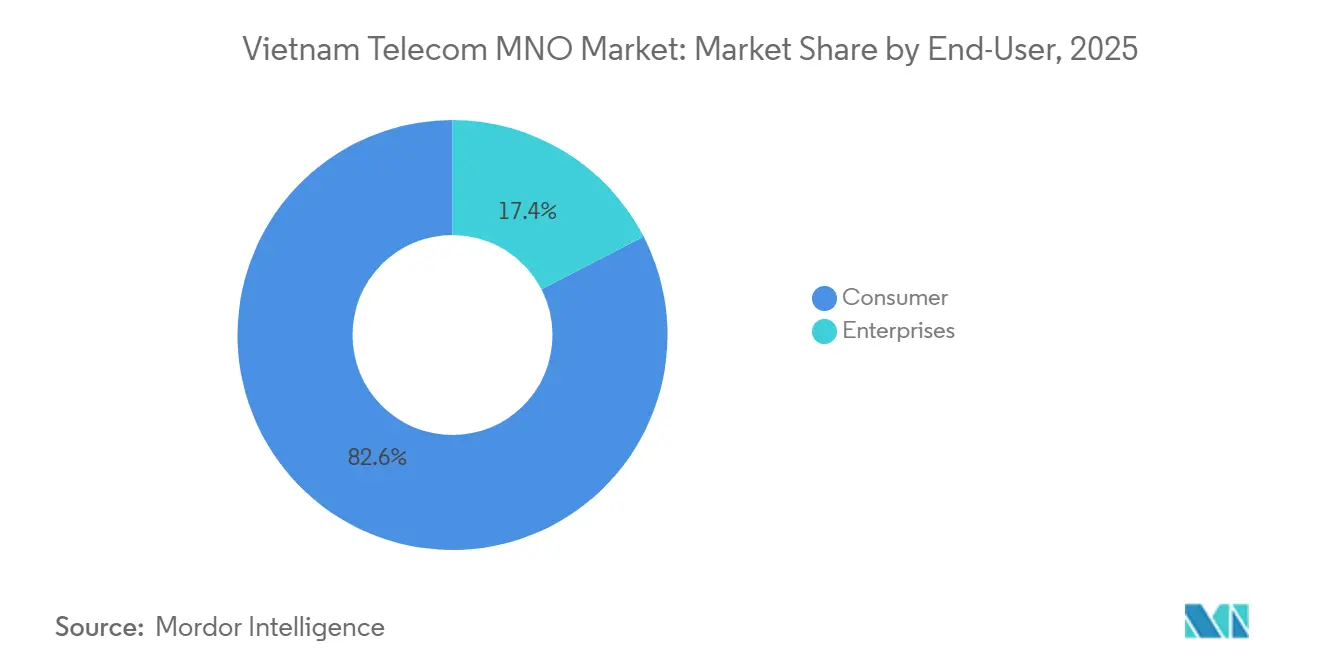
- By end-user, the consumer segment accounted for 82.57% of the Vietnam telecom MNO market size in 2025, whereas the enterprise segment is advancing at a 4.37% CAGR toward 2031.
Note: Market size and forecast figures in this report are generated using Mordor Intelligence’s proprietary estimation framework, updated with the latest available data and insights as of 2026.
Vietnam Telecom MNO Market Trends and Insights
Drivers Impact Analysis*
| Driver | (~) % Impact on CAGR Forecast | Geographic Relevance | Impact Timeline |
|---|---|---|---|
| Rapid 4G and 5G Rollout Driving Mobile-Data Surge | +1.2% | Hanoi, Ho Chi Minh City, Da Nang | Short term (≤ 2 years) |
| National Digital Transformation Program Accelerating Broadband Uptake | +0.9% | Rural and mountainous provinces nationwide | Medium term (2–4 years) |
| Rising Smartphone Affordability Boosting Data Consumption | +0.7% | Urban centers and Mekong Delta | Short term (≤ 2 years) |
| Government-Backed Industrial IoT Initiatives in Manufacturing Parks | +0.5% | Bac Ninh, Hai Phong, Binh Duong, Dong Nai | Medium term (2–4 years) |
| Cross-Border E-Commerce Traffic Spurring Data Demand Along Logistics Corridors | +0.3% | Border provinces and major ports | Long term (≥ 4 years) |
| Open RAN Trials Reducing Rural Coverage Cost Structures | +0.2% | Remote northern provinces | Long term (≥ 4 years) |
| Source: Mordor Intelligence | |||
Rapid 4G and 5G Rollout Driving Mobile-Data Surge
Operators added about 11,000 5G sites by mid-2025, lifting population coverage to 26% and quadrupling median download speeds compared with the prior year.[1] Viettel alone enrolled more than 5.5 million 5G users by early 2025, and its target of 10 million by December would push 5G penetration of its base toward 10%.[2] Unlimited data plans priced below USD 5, however, prevent proportional revenue gains, so profitability depends on shifting heavy-usage customers onto tiered quality-of-service bundles. Resolution 193 subsidizes 15% of the equipment bill once a carrier deploys at least 20,000 sites, effectively locking the industry into a capacity race that elevates depreciation charges.[3] The highest monetization upside sits in enterprise network slices, where guaranteed latency sells at a premium that is not feasible in the consumer mass market. The Vietnam telecom MNO market therefore remains scale-driven, with capital efficiency, rather than new subscriber acquisition, defining competitive advantage.
National Digital Transformation Program Accelerating Broadband Uptake
Policymakers aim for universal household fiber by end-2025, yet roughly 5.4 million homes, mainly in mountainous areas, still lack wired access. Where trenching costs exceed USD 300 per line, mobile broadband stands in as the practical substitute, supported by the government mandate that half of all traffic run over IPv6 by 2025. Operators upgraded core networks to comply, incidentally lowering incremental costs of onboarding IoT endpoints. The Vietnam telecom MNO market consequently gains a second growth engine because every new fiber-ready premise also requires reliable mobile back-up, and small businesses often adopt 4G or 5G fixed-wireless links before investing in optical connections. Higher enterprise broadband penetration translates into demand for cloud ERP and supply-chain tools, creating recurring traffic that is immune to consumer price wars.
Rising Smartphone Affordability Boosting Data Consumption
Smartphone penetration hit 84% nationwide by late 2025, helped by a drop in 5G-capable handset prices below USD 200. Chinese vendors that command over a third of shipments enabled many first-time data users in rural districts, where 4G now covers more than 96% of villages. New adopters cluster on prepaid plans with minimal spend, so revenue uplift is modest, yet device-financing bundles show promise. Viettel’s 24-month installment plus 12-month data commitment plan locks in higher lifetime value and pushes churn below the usual 2-3% monthly range seen in prepaid. Longer-term, ubiquitous smartphones will widen the addressable base for mobile payments, e-health, and precision-agriculture apps, each of which deepens engagement and raises megabyte consumption per subscriber, reinforcing the structural shift toward data-centric revenue in the Vietnam telecom MNO market.
Government-Backed Industrial IoT Initiatives in Manufacturing Parks
Fifteen pilot production parks now run private 5G trials, and early case studies already prove efficiency gains. Viettel’s slice in one electronics plant cut defect rates by 18% through real-time computer vision. The national target of 50 million cellular IoT links by 2025 implies annualized connection growth north of 25%, with the bulk originating in export-oriented industries that must meet multinational supply-chain visibility standards. While only a subset of factories can currently justify the capital spend, the precedent is clear: operators that design turnkey packages, bundling connectivity with edge compute and managed security, can convert a modest sub-segment into a high-margin business. The Vietnam telecom MNO market thus begins to pivot from pure connectivity to outcomes-based industrial solutions, a strategic hedge against flat consumer ARPU.
Restraints Impact Analysis*
| Restraint | (~) % Impact on CAGR Forecast | Geographic Relevance | Impact Timeline |
|---|---|---|---|
| Intensifying Price Wars Compressing ARPU | -0.8% | Urban markets nationwide | Short term (≤ 2 years) |
| High Spectrum Fees and Delayed Refarming Cycles | -0.5% | All licensed operators | Medium term (2–4 years) |
| Slow Fiber Backhaul Deployment in Mountainous Provinces | -0.3% | Northern mountains and Central Highlands | Long term (≥ 4 years) |
| Draft Data-Localization Rules Elevating Edge Infrastructure CAPEX | -0.2% | Major cities and industrial zones | Medium term (2–4 years) |
| Source: Mordor Intelligence | |||
Intensifying Price Wars Compressing ARPU
Unlimited 4G plans below USD 5 became the industry norm in 2024, and by mid-2025 more than two in five postpaid accounts had switched to these tariffs. Viettel’s EBITDA margin slipped even as revenue expanded because operating costs for a denser network outpaced top-line gains. Competitors hesitate to raise prices for fear of triggering subscriber churn, which still sits in the low single digits each month but would jump if any operator broke the informal pricing ceiling. Experiments with speed-guaranteed premium tiers remain niche at under 5% take-up, suggesting that a differentiated quality-of-service strategy will take time to gain traction. The Vietnam telecom MNO market therefore remains exposed to a revenue-per-gigabyte squeeze until carriers prove customers will pay meaningfully more for assured experience.
High Spectrum Fees and Delayed Refarming Cycles
The 2024 auctions for mid-band airwaves yielded about USD 400 million in state revenue, but the obligatory lump-sum payments drained cash that would otherwise fund network densification. Viettel’s additional low-band license stipulates 50% geographic reach within three years, accelerating capital spend even as the operator must still maintain legacy 2G and 3G infrastructure because refarming of the 900 MHz and 1800 MHz bands slipped to 2027. Running parallel networks inflates opex by an estimated 15-20% versus a clean-sheet 5G deployment. The regulatory latitude embedded in the 2023 telecommunications law means future timelines remain fluid, complicating multi-year financial planning across the Vietnam telecom MNO market.
*Our forecasts treat driver/restraint impacts as directional, not additive. The impact forecasts reflect baseline growth, mix effects, and variable interactions.
Segment Analysis
By Service Type: Data and IoT Propel Revenue Mix Evolution
Data and internet services captured 48.62% of 2025 revenue, underscoring how mobile broadband displaced voice as the primary cash engine inside the Vietnam telecom MNO market. Minutes of use fell by roughly 8% that same year, mirroring consumer migration to over-the-top calling tools. Messaging revenue dropped below 3% of the pie, while OTT video and pay-TV platforms became differentiation levers rather than material profit centers because content rights absorb up to half of subscription fees. Enterprise connectivity formats, from dedicated internet access to SD-WAN, now grow at mid-single-digit rates due to multinational firms anchoring regional supply chains in Vietnam. In this context, industrial IoT connections, though still a small share, expand at 4.12% CAGR through 2031, well ahead of the overall Vietnam telecom MNO market trajectory.
The long-tail opportunity lies in turning network capacity into platform plays. Operators built nationwide NB-IoT coverage by 2025 and already link two million smart meters, demonstrating a template for utilities and logistics. Roaming revenue benefited from the rebound in outbound tourism, increasing double digits in 2024 once pandemic barriers vanished. Future upside centers on bundling edge compute with connectivity, which transforms simple megabyte sales into managed services. As consumer voice and SMS decline further, sustained top-line health for the Vietnam telecom MNO market will rely on a diverse service stack anchored in data and IoT.

By End-User: Enterprise Upside Offsets Consumer Saturation
The consumer segment delivered 82.57% of 2025 revenue thanks to 137% mobile penetration across the population. Yet incremental growth is muted because almost every potential subscriber already owns a SIM, and heavy price competition caps ARPU at USD 3-4. Operators therefore court households with device-finance bundles and mobile money, yet regulatory caps on fees limit the margin these products can deliver. By contrast, the enterprise slice of the Vietnam telecom MNO market is on a 4.37% CAGR path, fueled by smart-factory 5G slices that carry annual contract values above USD 50,000. Private networks for electronics, automotive components and textiles deliver service-level guarantees that justify premium pricing, shielding operators from consumer-side discounting.
Small and medium enterprises, which represent more than nine in ten registered firms, remain under-addressed. Packaging broadband, cloud storage and basic cybersecurity into predictable monthly plans could unlock a sizeable but fragmented revenue pool. Viettel’s dedicated B2B division and VNPT’s enterprise reorganization both aim to capture that unresolved demand. In the long run, the relative growth of business accounts will gradually shift revenue mix away from mass-market voice and data. As a result, maintaining competitiveness in the Vietnam telecom MNO market now depends on mastering dual go-to-market models that serve both prepaid consumers and demanding industrial users.
Geography Analysis
Urban hubs dominate the Vietnam telecom MNO market, with Hanoi, Ho Chi Minh City and Da Nang generating 45% of mobile service revenue by 2025 despite accounting for only a quarter of the nation’s residents. Smartphone penetration tops 95% in these cities, and Viettel reached 80% 5G coverage across their districts by mid-2025. Sub-USD 5 unlimited plans contribute to heavy data consumption, yet elevated operating costs for dense networks compress margins unless carriers steer subscribers toward premium-speed tiers.
The Mekong Delta offers a different profile. Agriculture IoT deployments, such as over 50,000 soil and irrigation sensors across An Giang and Can Tho, are lifting data traffic even though ARPU there sits below USD 3.[4] Cross-border trade matters most in northern border provinces and seaport districts. Lang Son recorded a 35% surge in mobile data during 2024 as traders adopted real-time logistics tracking, while Hai Phong’s container terminals rely on private LTE for crane automation.[5] These specialized use cases create pockets of high-value traffic that partially offset the lower spending power of rural consumers.
Mountainous regions and the Central Highlands remain coverage laggards. Rough terrain leaves 761 villages without mobile service at the end of 2024, and fiber backhaul reaches only 60% of communes in parts of Gia Lai and Dak Lak. Government subsidies and open RAN pilots aim to cut rural radio costs by roughly one-third, yet the commercial breakeven still depends on further reductions in power and maintenance outlays. Until then, universal service obligations rather than market demand will drive additional towers, meaning investment returns in these zones trail the national average for the Vietnam telecom MNO market.
Regulatory Landscape
Vietnam's telecom MNO regulation is overseen by the Ministry of Information and Communications (MIC) and spectrum administration through the Authority of Radio Frequency Management (ARFM), with spectrum awards and coverage obligations influencing operator capex plans. Spectrum auctions for key 4G/5G bands (including 700 MHz, 2.6 GHz, and 3.5 GHz) remain an active policy lever, while government programs continue to support 5G deployment, including the 15% equipment subsidy framework tied to reaching 20,000 5G base stations (as referenced in the report scope).
In 2026, multiple circulars tightened operational compliance alongside network expansion. Circular 08/2026/TT-BKHCN (effective April 15, 2026) mandated stricter authentication of mobile subscriber information using national digital identification databases, raising KYC and data-governance requirements for MNOs. Circular 34/2026/TT-BKHCN (effective June 2026) updated rules for telecommunications numbering and internet resource planning, while Circular 28/2026/TT-BKHCN (effective July 15, 2026) established a mandatory list of telecom services subject to quality management, increasing accountability for service performance and measurement across operators.
Competitive Landscape
The Vietnam telecom MNO market is a concentrated oligopoly led by Viettel, VNPT and MobiFone, which together command more than 94% of subscribers. Viettel’s 56% share derives from advantages in capital access, vertical integration and a first-mover lead in rural 4G. The group manufactures some of its own network equipment, operates tower assets and runs mobile businesses in ten countries, creating economies of scale its domestic competitors cannot match. VNPT leverages its fixed-line footprint to bundle fiber with mobile for enterprises, whereas MobiFone positions itself in premium urban niches and invests in device financing to lock in postpaid users.
Smaller challengers Vietnamobile and Gmobile hold less than 6% share combined. Vietnamobile focuses on price-sensitive prepaid customers, while Gmobile has struggled to establish brand distinction. Regulatory policy that lowers 5G entry barriers could let these minnows grow, yet spectrum fees and data-localization rules still demand balance-sheet depth. As a result, scale remains the decisive factor.
Strategic differentiation is shifting toward technology. Viettel’s open RAN trials with Samsung and NEC promise 30% lower rural site costs. MobiFone’s commercial cloud-native RAN launch in Da Nang in November 2025 delivered a 28% capex saving per base station. Edge data centers compliant with the data-protection decree give carriers an advantage in winning multinational enterprise contracts, particularly those needing local residence for sensitive information. Satellite backhaul pilots further indicate that future competition will extend beyond terrestrial networks, underscoring the capital-heavy nature of leadership in the Vietnam telecom MNO market.
Vietnam Telecom MNO Industry Leaders
-
Viettel Group
-
Vinaphone
-
Mobifone Corporation
-
Vietnamobile
-
Gmobile
- *Disclaimer: Major Players sorted in no particular order
Market Opportunities and Future Outlook
Enterprise connectivity and industrial digitization create a more investable whitespace in Vietnam's MNO revenue mix, especially where 5G coverage rollout is being prioritized around manufacturing clusters. With data and internet already accounting for 48.62% of service revenue in 2025 and private 5G trials in industrial parks underway, operators can target higher-margin offerings that package connectivity with edge compute and managed security for factories, logistics hubs, and utilities. The government-backed 5G subsidy mechanism tied to large-scale base-station deployment also reduces the effective equipment burden for qualifying rollouts, supporting faster densification in areas where operators can monetize guaranteed performance.
Policy-driven changes also open monetization and efficiency levers beyond coverage expansion. The April 2026 effective timeline for stricter subscriber authentication under Circular 08/2026/TT-BKHCN requires database cleanup and supports migration toward higher-quality, identity-backed onboarding, which can underpin mobile financial services and enterprise-grade compliance needs. On the network side, ARFM-led spectrum assignments, including low-band 700 MHz, improve broader-area 4G/5G economics, strengthening fixed-wireless access propositions for underserved households and business sites where fiber backhaul is constrained. In parallel, Circular 34/2026/TT-BKHCN updates on numbering and internet resource planning, along with expanded quality-management requirements under Circular 28/2026/TT-BKHCN, raise the value of measurable SLAs, which helps enterprises and public-sector buyers justify premium-tier connectivity contracts that require auditable service quality.
Recent Industry Developments
- July 2026: Viettel and Qualcomm Technologies sign a 6G Early Access Program agreement to collaborate on 6G research, development, and base station production. The partnership places Viettel at the forefront of next generation mobile technology and could enable future domestic capability export. This collaboration broadens Viettel's technology leadership and strengthens its position in the global value chain.
- July 2026: Viettel launches a 5G mobile data package that bundles a CapCut account to expand digital service offerings. The new package diversifies Viettel's product mix by integrating digital services with connectivity. The initiative enhances ARPU through non-traditional services and accelerates the shift toward platform-based offerings.
- June 2026: Viettel commences one way service blocking for more than 5 million subscribers who did not complete mandatory biometric information verification by the June 15, 2026 deadline. The action reduces regulatory risk by ensuring subscriber data governance compliance. The move reshapes the active subscriber base in the near term and reinforces trust with regulators and enterprise clients.
Research Methodology Framework and Report Scope
Market Definition and Coverage
For this report, the market is defined as telecom service revenue generated in Vietnam by mobile network operators across consumer and enterprise users, captured in current USD for the study period.
Scope exclusions: This sizing excludes handset and network equipment sales, and it also excludes pure-play digital apps that do not generate telecom service revenue.
Segmentation Overview
- Overall Telecom Revenue and ARPU
- Service Type
- Voice Services
- Data and Internet Services
- Messaging Services
- IoT and M2M Services
- OTT and PayTV Services
- Other Services (VAS, Roaming and International Services, Enterprise and Wholesale Services, etc.)
- End-User
- Enterprises
- Consumer
Data Sources, Market Sizing, and Validation
Desk Research
Desk research was used to build the base structure of the model and to anchor Vietnam level demand signals before any interview based adjustments were applied. We referenced public statistics and policy documents that explain network rollout direction, service adoption, and user behavior, such as releases from the Ministry of Information and Communications, the General Statistics Office of Vietnam, and the International Telecommunication Union.
To translate demand into revenue, we also reviewed open sources such as operator annual reports and investor presentations, regulatory consultations, and credible press coverage of pricing shifts and technology milestones (including 4G and 5G commercialization). Where available, trade and shipment context was checked using an import and export shipment level database, and technical direction was cross-checked using a patent database to avoid missing emerging use cases. The sources listed here are illustrative only, and many other public and paid references were used to collect, validate, and clarify the final assumptions.
Primary Interviews and Surveys
Primary work was used to pressure test desk findings and to close gaps around service mix and pricing, especially where published figures lag market moves. We spoke with operator-side experts, telecom distributors and channel partners, enterprise connectivity buyers, and independent industry specialists, and then we checked how demand differs between major cities and secondary provinces.
These conversations also helped confirm practical assumptions such as multi SIM usage, plan migration speed from 4G to 5G, and how bundling affects reported service revenue, which is then reflected in the market model.
Distribution of primary research fieldwork respondents
| Company type | Respondent position |
|---|---|
| Top tier: 33% | CXOs: 15% |
| Mid tier: 50% | Functional/Unit leaders: 28% |
| Smaller Players: 17% | Managers: 57% |
Market-Sizing & Forecasting
Sizing started from a top-down build where Vietnam service revenue pools were reconstructed by service type using reported subscriber bases, active connections, and observed usage shifts, followed by ARPU and effective price realization checks. Once that structure was stable, selective bottom-up approximations were used to sanity check totals, such as sampled plan price points multiplied by implied subscriber volumes for key service bundles, and channel feedback on how prepaid and postpaid mixes are moving.
In this market, the inputs that mattered most were mobile broadband penetration, 4G and 5G coverage and adoption timing, average data consumption growth, bundling intensity (voice plus data plus entertainment), and enterprise demand for IoT and M2M connectivity. When a data point was missing or not consistent across sources, we used proxy indicators that can be tracked each year, such as connections trends, technology migration pace, and observed price corridors from major plans.
Forecasts were built using scenario analysis, since policy driven network expansion and pricing decisions can change year to year in Vietnam. The forward view was then aligned with expert expectations on demand growth, service mix changes, and realistic ARPU progression rather than assuming straight line growth.
Data Validation & Update Cycle
Validation was done through stepwise cross-checks so that one noisy indicator did not overdrive the total. We compared outputs against independent signals like connections trends, technology migration timing, and reported service revenue direction, and then flagged large variances for rework.
Before sign-off, the model went through an internal review where assumptions were traced back to inputs, and outliers were challenged until they were explained or removed. Reports are refreshed annually, and interim updates are made when material events occur, followed by a final pre-delivery pass to ensure the latest information is reflected.
Mordor Intelligence's Vietnam Telecom Market Estimate Compared With Other Published Estimates
Published market sizes for Vietnam telecom often look different because the studies may not be counting the same revenue lines, or they may be using different years, exchange-rate timing, and assumptions for ARPU change under bundling. Another common reason is that some publications mix operator service revenue with adjacent areas like device sales, tower leasing, or IT services, which changes the total quickly.
The table points to a spread that is largely explained by scope and how revenue is recognized. In Mordor Intelligence's model, the market is treated as Vietnam telecom MNO service revenue (not broader ICT), and the forecast builds from service type demand signals and validated ARPU corridors rather than applying a single growth rate to a high level total.
Benchmark comparison
| Source | Market Size | Gaps in Research Methodology |
|---|---|---|
| Mordor Intelligence | USD 7.22 B (2025) | |
| Industry Publisher A | USD 6.49 B (2024) | Uses a different base year and can undercount later 5G driven mix uplift when ARPU movement is modeled as a steady, flat progression rather than being adjusted for bundling and data usage growth. |
| Industry Publisher B | USD 6.30 B (2022) | Older reference year and a broader, lightly described scope can create mismatch, especially if some service lines are grouped differently and inflation and currency timing are not updated to the current cycle. |
Reading the three figures together, the main takeaway is that year selection and what is included as telecom revenue drive most of the gap. Our approach stays traceable to observable demand and pricing inputs, and it can be re-run each year as coverage, adoption, and plan structures change.
Key Questions Answered in the Report
What is the forecast value of the Vietnam telecom MNO market by 2031?
It is projected to reach USD 8.97 billion on the back of a 3.62% CAGR between 2026 and 2031.
Which service type currently leads revenue?
Data and internet services contribute 48.62% of 2025 revenue, outpacing all other categories.
How fast is the enterprise segment growing?
Enterprise accounts are expanding at a 4.37% CAGR to 2031, driven by private 5G networks and IoT demand.
Who is the largest operator in Vietnam mobile?
Viettel Group held about 56% of mobile subscribers in 2025, well ahead of Vietnam Posts and Telecommunications Group and MobiFone.
Why are operators investing in edge data centers?
Data-localization rules require sensitive information to stay on shore, so carriers are building edge facilities to meet enterprise compliance needs.
What technology is lowering rural network costs?
Open RAN trials show up to 30% site-level capex savings, making remote coverage more economical.