
Market Overview
| Study Period | 2021 - 2031 |
|---|---|
| Forecast Data Period | 2026 - 2031 |
| Base Year Market Size (2025) | 86.81 gigawatt |
| Market Volume (2026) | 95.46 gigawatt |
| Market Volume (2031) | 153.62 gigawatt |
| Growth Rate (2026 - 2031) | 9.98 % |
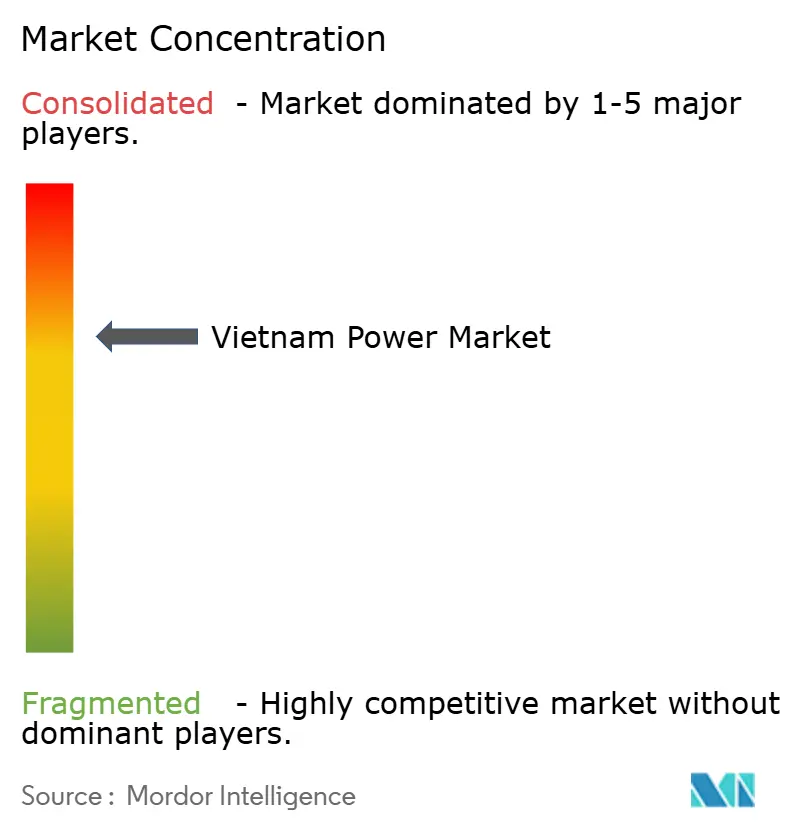
| Market Concentration | Medium |
Major Players *Disclaimer: Major Players sorted in no particular order Image © Mordor Intelligence. Reuse requires attribution under CC BY 4.0. | |
Vietnam Power Market Analysis by Mordor Intelligence
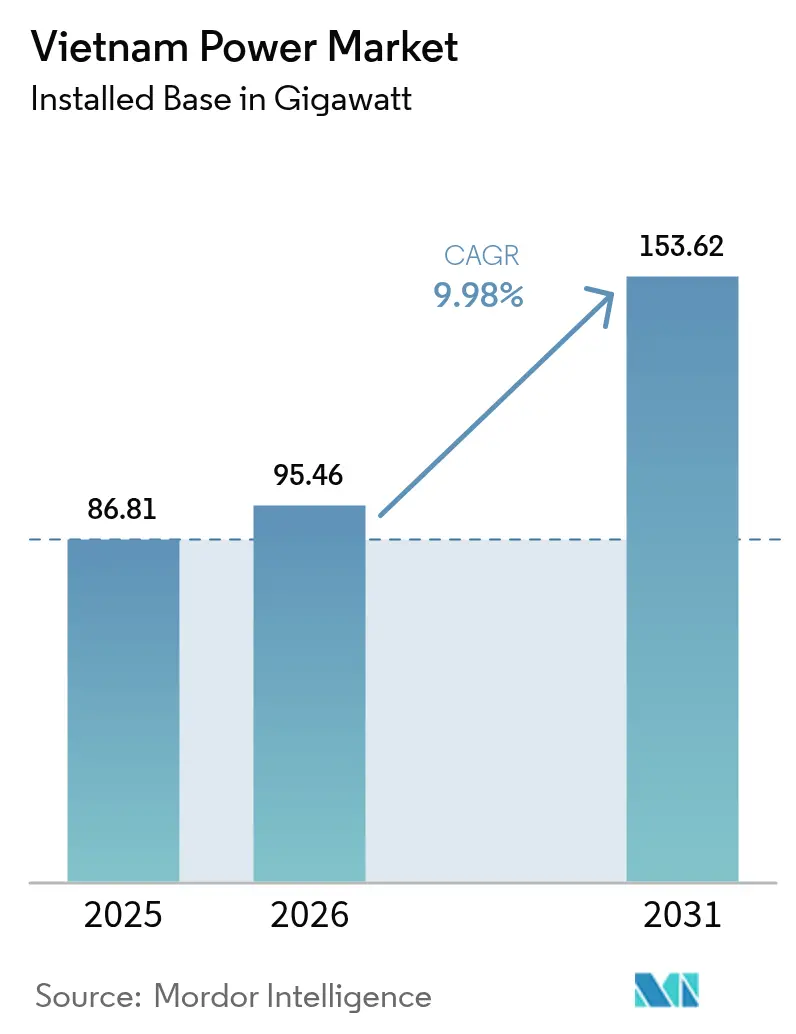
The Vietnam Power Market size is expected to grow from 86.81 gigawatt in 2025 to 95.46 gigawatt in 2026 and is forecast to reach 153.62 gigawatt by 2031 at 9.98% CAGR over 2026-2031.
The Vietnamese power market is on a rapid build trajectory. A USD 136 billion policy push under Power Development Plan 8 (PDP-8) underpins this acceleration, targeting 28–36% renewable energy by 2030 and 74–75% by 2050. Industrial electrification, data-center proliferation, and post-2023 blackout energy-security pledges are lifting capital spending, while new Direct Power Purchase Agreement (DPPA) rules open space for private renewable producers to transact directly with large users. Transmission upgrades, the above 500 kV backbone in particular, remove the grid bottlenecks that once stranded half of the installed capacity and forced 2.56 billion kWh of imports from China in 2024. A moderate competitive landscape dominated by state-owned EVN is evolving as international developers anchor offshore-wind pilots and LNG projects.
Key Report Takeaways
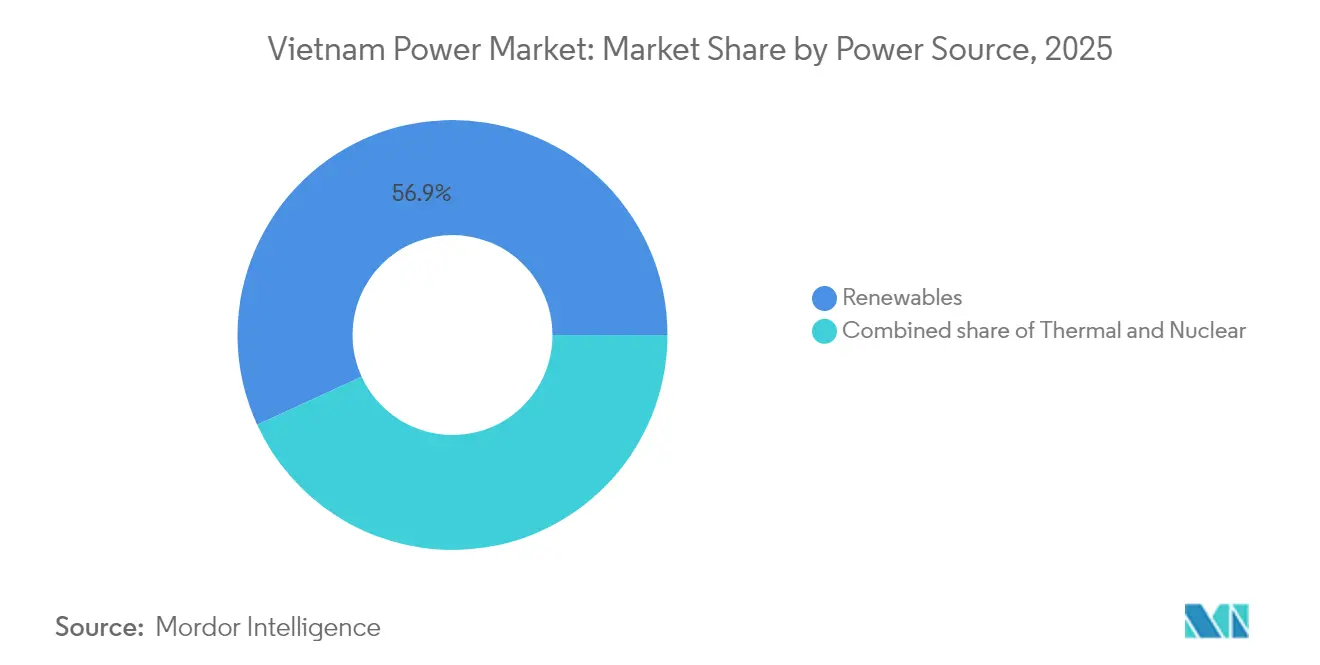
- By power source, renewables held 56.85% of the Vietnam power market share in 2025 and are projected to advance at an 11.46% CAGR through 2031.
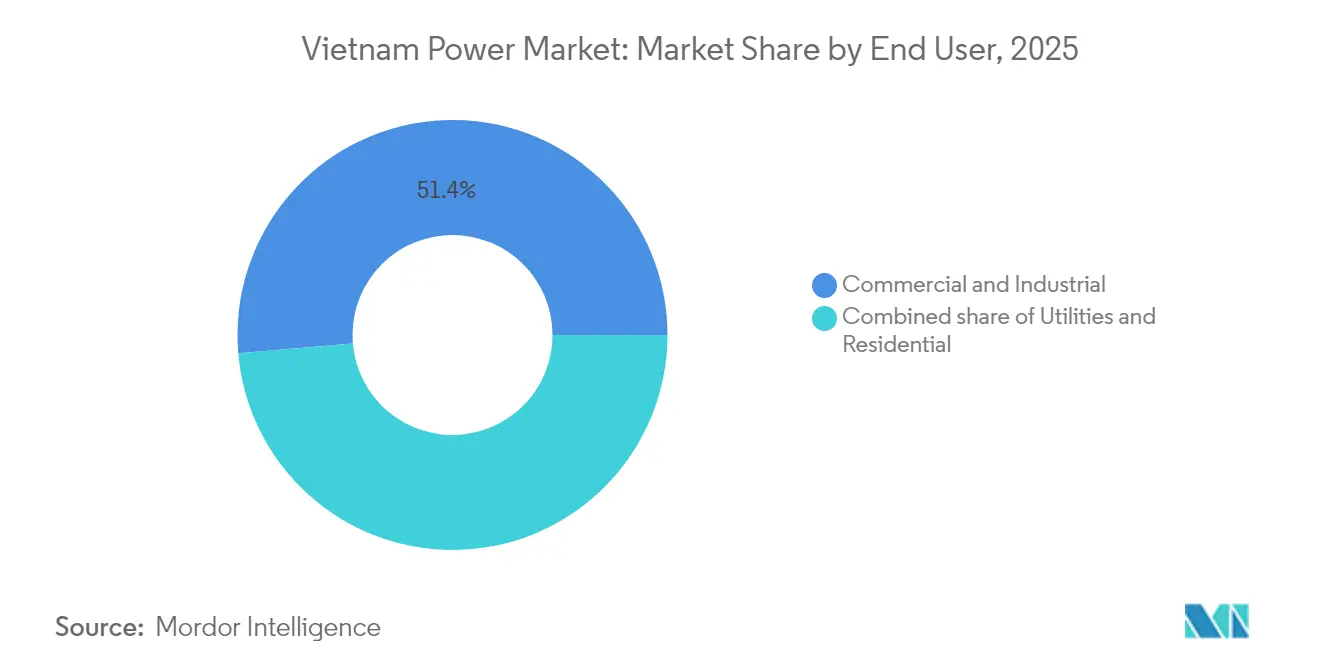
- By end user, commercial and industrial consumers accounted for 51.35% of the Vietnam power market size in 2025 and are tracking an 11.08% CAGR through 2031.
Note: Market size and forecast figures in this report are generated using Mordor Intelligence’s proprietary estimation framework, updated with the latest available data and insights as of 2026.
Vietnam Power Market Trends and Insights
Drivers Impact Analysis*
| Driver | (~)% Impact on CAGR Forecast | Geographic Relevance | Impact Timeline |
|---|---|---|---|
| Rapid industrialisation-led electricity demand surge | +3.20% | National, with concentration in southern industrial zones (Ho Chi Minh City, Binh Duong, Dong Nai) | Medium term (2-4 years) |
| Government renewable-energy targets & FITs | +2.80% | National, offshore wind concentrated in central and southern coastal provinces | Long term (≥ 4 years) |
| PDP-8-driven FDI inflow in generation & grid | +2.10% | National, with priority transmission corridors linking northern hydropower to southern demand centers | Medium term (2-4 years) |
| Grid-modernisation funding (ADB, JICA) | +1.80% | National, with smart-grid pilots in Hanoi and Ho Chi Minh City | Long term (≥ 4 years) |
| Offshore-wind auction pipeline unlock | +1.50% | Central and southern coastal provinces (Binh Thuan, Ba Ria-Vung Tau, Tra Vinh) | Long term (≥ 4 years) |
| Data-centre boom raising flexible-generation need | +1.30% | National, with clusters emerging in Hanoi, Ho Chi Minh City, and Da Nang | Short term (≤ 2 years) |
| Source: Mordor Intelligence | |||
Rapid Industrialisation-Led Electricity Demand Surge
Industrial production jumped 8.4% 2024, lifting nationwide electricity use to 1 billion kWh in late May and prompting EVN to deploy demand-response programs.(1)Nguyen Lan, “Manufacturing Output and Electricity Use Surge,” VietnamPlus, vietnamplus.vn The semiconductor sector alone is valued at USD 18.23 billion in 2024 and is expanding at 11.48% CAGR, an outcome of Vietnam’s “Silicon Delta” policy that targets 45% of output from high-tech goods by 2030. South Korea reclaimed the top-investor slot in early 2025, with SK Group allocating multibillion-dollar budgets to LNG and small-modular reactors. Meeting the government’s 8% GDP objective for 2025 requires 12–16% yearly additions to generation, magnifying the Vietnam power market dependency on fast-track grid projects. Foreign investors now cite a stable electricity supply as a precondition for high-tech plant siting.
Government Renewable-Energy Targets & FITs
The revised PDP-8 sets a 500.4–557.8 billion kWh consumption band for 2030 while mandating that renewables claim 28–36% of the mix, signaling a pivot away from coal dominance. New price caps place onshore wind at VND 1,959.4/kWh (USD 0.078) in the north and near-shore projects at VND 1,987.4/kWh (USD 0.079), restoring investor visibility after years of stalled guidance.(2)Nguyen Quang, “Vietnam Issues Wind FITs for 2025,” Ministry of Industry and Trade, moit.gov.vnYet simultaneous retroactive tariff cuts threaten USD 13 billion in operating solar and wind assets, sparking protests from international developers. Decree 57/2025 introduced DPPAs, allowing private generators to bypass EVN and transact directly with qualified consumers, a reform expected to lower state-budget strain and quicken renewable deployment. These shifts align Vietnam with the ASEAN Power Grid vision that foresees clean sources covering up to 50% of regional output by 2030.
PDP-8-Driven FDI Inflow in Generation & Grid
Total infrastructure outlays are projected to climb 40% to USD 36 billion in 2025, with more than four-fifths tagged for power generation and transmission upgrades. Flagship deals include Huadian’s USD 2.4 billion green-hydrogen hub in Quang Tri and Vingroup’s USD 5.5 billion LNG complex in Hai Phong. On the grid side, the VND 7,410 billion (USD 300 million) 500 kV Lào Cai–Vĩnh Yên line will move 3,000 MW of northern hydro output when it goes live in September 2025. Equipment localization is gathering momentum; CS Wind is spending USD 200 million on a wind-tower plant in Long An to meet local offshore wind demand. Storage has emerged as a parallel play, with T&T Group targeting 2 GWh of annual battery output by 2026.
Grid-Modernisation Funding (ADB, JICA)
ADB has earmarked USD 16.5 billion for climate-resilient infrastructure, and Prime Minister Pham Minh Chinh requested additional support for large energy schemes during the April 2025 meetings. Completed upgrades have added 1,000 MW of reactive compensation across 20 substations ahead of the 2025 dry-season peak. JICA co-finances the 1,500 MW Quang Ninh LNG station developed by PetroVietnam Power, Tokyo Gas, and Marubeni, due online in 2026-2027. EVN reports 100% online customer-service coverage and AI-enhanced monitoring, trimmed outage times by 320% year-on-year. Extra 500 kV corridors will also carry 9,360–12,100 MW of imports from Laos, priced at USD 0.0695/kWh for hydroelectric flows
Restraints Impact Analysis*
| Restraint | (~) % Impact on CAGR Forecast | Geographic Relevance | Impact Timeline |
|---|---|---|---|
| Slow PPA approval & regulatory uncertainty | -1.80% | National, with particular impact on renewable project development | Short term (≤ 2 years) |
| ESG-driven coal-financing squeeze | -1.30% | National coal-fired generation, with phase-out pressure by 2050 | Long term (≥ 4 years) |
| Land-acquisition conflicts for solar farms | -0.90% | Central and southern provinces with agricultural land competition | Medium term (2-4 years) |
| Import-dependency for high-voltage equipment | -0.70% | National transmission infrastructure development | Medium term (2-4 years) |
| Source: Mordor Intelligence | |||
Slow PPA Approval & Regulatory Uncertainty
Around USD 13 billion in wind and solar assets are at risk after auditors found misapplied FIT rules and suspended new PPAs pending review, prompting exits by Enel, Equinor, and Ørsted despite Vietnam’s headline plan to double capacity by 2030. A 6 GW offshore-wind zone was removed from the latest PDP-8 draft, deepening perceptions of policy volatility. Transmission approvals are equally sluggish; government data show only 2 of 16 mandated grid projects met 2024 timelines. These delays restrain the Vietnam power market’s tempo in the short run.
ESG-Driven Coal-Financing Squeeze
International lenders continue to tighten coal exposure, pressuring Vietnam’s plan to retire the fuel by 2050. Achieving net-zero requires USD 650 billion, much of it for biomass or ammonia conversions at existing coal sites. The JETP framework will channel concessional funds, but the gap remains wide; the Nam Dinh coal project is emblematic, losing ACWA Power in 2023 and now eyeing LNG repowering. Despite constraints, coal consumption set a record in 2024, revealing tensions between short-term reliability and long-term ESG compliance.
*Our forecasts treat driver/restraint impacts as directional, not additive. The impact forecasts reflect baseline growth, mix effects, and variable interactions.
Segment Analysis
By Power Source: Renewables Outpace Thermal Transition
Renewables delivered 56.85% of installed capacity in 2025, underscoring their status as the anchor of the Vietnam power market. The segment is forecast to compound at 11.46% annually through 2031 as solar rooftops scale, onshore wind spreads across the Central Highlands, and offshore wind turbines begin to populate typhoon-exposed coastal waters. Solar already totals 19.4 GW, yet curtailment surpasses 15% in Ninh Thuan and Binh Thuan during the dry season when local lines overload. High curtailment has prompted developers to pair new projects with battery storage, a trend facilitated by PDP-8’s target of 10–16 GW of batteries by decade-end. Offshore wind’s 6 GW 2030 target equates to 1.2 GW of annual installs starting in 2026, demanding prompt port upgrades and localized supply chains. Together, these trends point to an expanded Vietnam power market size at the segment level that will eclipse thermal additions within three years.
Thermal capacity remains relevant but is losing ground. Coal units ran at a 68% capacity factor in 2024 as merit-order rules favored cheaper wind and hydropower. New coal projects lack financing, and depleting offshore gas fields hinder gas-fired growth. The government, therefore, places nuclear back on the table with preliminary 4-6.4 GW plans for the 2030-2035 horizon, though finance and public acceptance remain hurdles. In the interim, combined-cycle gas and large-scale batteries are set to bridge the capacity gap and provide ramping support, shaping a technology mix that allows the Vietnam power market to continue its rapid growth while lowering emissions intensity.


By End User: Commercial and Industrial Dominance Persists
Commercial and industrial buyers consumed 51.35% of electricity in 2025 and are growing at 11.08% annually, making them the single most important demand center for the Vietnam power market. Semiconductor fabs run continuous processes and account for rising spot prices during industrial peak hours. Direct power purchase agreements now allow multinationals to lock in renewable electricity at fixed prices over 15-20 years, accelerating procurement pipelines that could reach 4 GW by 2028. Manufacturers are also installing rooftop arrays to hedge tariff hikes, further entwining production competitiveness with energy strategy.
Utilities and residential users occupy the remainder of demand but advance at a slower 7.95% CAGR. Household consumption per capita reached 2,400 kWh in 2024, a level now constrained by cross-subsidized tariffs and lingering distribution losses of 6.8%. Tariff reform is under ministerial review, and any upward adjustment would narrow the affordability gap between industrial and residential customers. Distribution-loss reduction programs, including smart meters and automated substations, are slated to shave technical losses toward a 5.5% regional benchmark, freeing capacity that can support the Vietnam power market without new generation.
Geography Analysis
Southern Vietnam, led by Ho Chi Minh City, Binh Duong, and Dong Nai, accounted for 47.85% of national electricity consumption in 2025 and registered the fastest peak-load growth. Local generation trails demand by around 2 GW, so the region draws heavily on 500 kV lines from northern hydropower plants. These corridors run at 92% utilization during evening peaks, forcing EVN to curtail central-region renewables to preserve grid stability. Upcoming transmission upgrades financed by ADB aim to relieve the choke point and unlock latent renewable capacity destined for the Vietnam power market.
The northern grid serves Hanoi, Hai Phong, and Quang Ninh. Coal plants supplied 57.35% of northern demand in 2025, but financing curbs and stricter emissions rules are accelerating a pivot to gas and cross-border imports. A 500 kV intertie with Laos, commissioned in June 2024, now enables up to 5,000 GWh of hydropower imports each year. Cross-border trade stabilizes supply during dry seasons when domestic hydropower recedes, illustrating the benefits of regional market integration for the Vietnamese power industry.
The central region hosts most of the nation’s solar and wind projects but suffers the highest curtailment rates. Transmission expansion is therefore synchronized with offshore wind rollout, ensuring that power produced along the coast can reach load centers inland and to the south. PDP-8 also contemplates subsea HVDC links that could shuttle surplus clean power to Malaysia and Thailand under the ASEAN Power Grid vision. Such infrastructure would position the Vietnam power market as both a net importer and net exporter at different times of the year, reinforcing energy security while monetizing renewable surpluses.
Regulatory Landscape
Vietnam's power sector regulatory framework is being reshaped around the revised Power Development Plan VIII approved by the Prime Minister in April 2025 (Decision 768/QD-TTg) and the Ministry of Industry and Trade (MoIT) implementation plan issued in May 2025 (Decision 1509/QD-BCT). These instruments support a long-cycle buildout program and set out priority generation and transmission corridors, while EVN continues to operate as the main transmission and distribution entity.
Market liberalization is also moving forward through formal workstreams led by MoIT, including a June 2026 technical consultation on reviewing and adjusting competitive electricity market design aimed at moving away from the sole-buyer model. In parallel, the DPPA mechanism for renewable generators and large consumers is anchored by Decree 80/2024/ND-CP (July 2024), complementing the Electricity Law reform direction referenced in the report scope and enabling private-to-private contracting alongside EVN's system role.
Competitive Landscape
The Vietnamese power market remains moderately concentrated. EVN controls transmission and distribution, but DPPA rules effective March 2025 allow private generators to strike direct deals with large users, lowering barriers for new entrants. Domestic groups such as T&T, Trung Nam, and Bamboo Capital scaled quickly on local financing and EPC know-how, yet technology partnerships drive true edge; PetroVietnam’s alliance with JERA on ammonia co-firing and Tokyo Gas-Marubeni’s Quang Ninh LNG consortium signal a shift toward integrated value chains.
European incumbents that once led offshore-wind pipelines have partially withdrawn over policy risk, opening doors for Asian investors and domestic utilities to capture acreage. Equipment localization reduces lead times: CS Wind’s Long An plant will supply regional tower demand, while Siemens Energy and GE bid to localize turbine assembly to meet PDP-8 local-content targets. The storage space is nascent but strategic; T&T aims to command a 40–50% national share with 2 GWh of annual battery output by 2026, competing with Chinese and Korean suppliers.
Digitalization now differentiates incumbents. EVN Southern Power’s AI roll-out lifted customer engagement metrics by 320% year-on-year, and the utility is piloting blockchain-based DPPA settlement for rooftop producers. New entrants that marry technology with project execution, such as Sigenergy in behind-the-meter storage, could capture emerging niches as the Vietnam power market matures.(4)Vietnam Electricity, “Annual Report 2025,” evn.com.vn
Vietnam Power Industry Leaders
Vietnam Electricity
General Electric
AES Mong Duong Power Company Limited
Mekong Energy Company Ltd
Jera Co Inc.
- *Disclaimer: Major Players sorted in no particular order

Market Opportunities and Future Outlook
Utility-scale renewable approvals are increasingly influenced by provincial investor-selection and investment-policy decisions, which creates near-term whitespace for developers and EPCs that can deliver bankable grid-connection solutions. In 2026, multiple provinces advanced new solar and wind capacity, including Gia Lai's 230 MW Nhon Hoa project cluster (approved in April 2026) and Lâm Đồng's approval of two solar projects totaling 280 MW (July 2026), indicating a more active pipeline beyond the earlier FIT-driven boom-bust cycle.
Grid-firming and flexibility are becoming more prominent as new projects start embedding storage requirements and hybrid configurations. Bac Ninh's July 2026 approval for Da Ong Lake and Cau Re Lake solar projects (50 MW total) includes a 5 MW/10 MWh BESS component, which aligns with PDP-8 targets for large-scale batteries in high-curtailment provinces such as Ninh Thuan and Binh Thuan. On the demand side, DPPA-enabled procurement and the concentration of commercial and industrial load (51.35% share in 2025) expand opportunities for renewable generators, aggregators, and behind-the-meter storage providers serving factories and data centers seeking contractable clean supply and peak-shaving solutions.
Recent Industry Developments
- June 2026: GE Vernova announced it secured an equipment order for the Quang Trach II LNG power plant, including two 9HA.02 gas turbines and two H78 generators. The order strengthens Vietnam's large-frame gas turbine supply chain for the LNG buildout and supports higher-efficiency flexible generation needed to balance rising renewable penetration.
- May 2026: Vietnam Electricity (EVN) reported Quang Trach I thermal power plant entered commercial operation, adding roughly 9 billion kWh per year to the national grid. New firm capacity helps maintain reliability during peak-season demand and reduces reliance on emergency imports when transmission corridors are congested.
- June 2024: A 500 kV interconnection with Laos was commissioned, enabling up to 5,000 GWh of hydropower imports annually. This cross-border link expands dispatchable supply options during dry seasons and reinforces the ASEAN Power Grid integration pathway referenced in PDP-8 planning.


Research Methodology Framework and Report Scope
Market Definition and Coverage
For this methodology, the Vietnam power market covers electricity supply from generation through delivery, focusing on the installed capacity base and how it expands over time across the country.
Scope exclusions: We exclude energy fuels as traded commodities and exclude downstream retail bill components such as taxes, levies, and subsidy pass-throughs.
Segmentation Overview
- By Power Source
- Thermal (Coal, Natural Gas, Oil and Diesel)
- Nuclear
- Renewables (Solar, Wind, Hydro, Geothermal, Biomass & Waste, Tidal)
- By End User
- Utilities
- Commercial and Industrial
- Residential
- By T&D Voltage Level (Qualitative Analysis only)
- High-Voltage Transmission (Above 230 kV)
- Sub-Transmission (69 to 161 kV)
- Medium-Voltage Distribution (13.2 to 34.5 kV)
- Low-Voltage Distribution (Up to 1 kV)
Data Sources, Market Sizing, and Validation
Desk Research
Desk research was used to anchor the model with consistent national power statistics and policy signals, and then to cross-check the timing of capacity additions and retirements. We leaned on public sources such as Vietnam government energy planning documents, the General Statistics Office of Vietnam, international energy statistics (such as IEA and IRENA), and grid and generation reporting from recognized system and utility publications.
To avoid relying on a single series, the figures were compared against items like power generation (TWh), peak demand discussions, and announced project pipelines reported in reputable press and association websites. Company filings and investor presentations were also referenced to validate technology mix shifts and commissioning timelines, and a paid subscription for company financials and news helped keep the project and policy timeline consistent. The desk sources listed here are illustrative only, and many other public documents were reviewed for data collection, validation, and clarification.
Primary Interviews and Surveys
Primary work focused on interviews and short surveys with developers, EPC-related stakeholders, utility and large buyer-side energy teams, and domain experts who track generation and grid constraints. We used these discussions to verify commissioning slippage, likely retirements, and practical utilization assumptions, and then to sanity-check the outlook across Vietnam with input that reflects different customer cohorts and technology views.
Distribution of primary research fieldwork respondents
| Company type | Respondent position |
|---|---|
| Top tier: 29% | CXOs: 19% |
| Mid tier: 50% | Functional/Unit leaders: 31% |
| Smaller Players: 21% | Managers: 50% |
Market-Sizing & Forecasting
Sizing was built using a top-down approach where national installed capacity is reconstructed by technology based on official capacity statistics and the project pipeline, and then rolled forward year by year with additions, retirements, and commissioning delays. To keep the totals realistic, selective bottom-up approximations were used, such as sampling planned projects and applying typical nameplate sizes, and then cross-checking with public disclosures and channel feedback.
Key inputs we tracked included installed capacity by source (coal, gas, hydro, solar, wind, biomass and other renewables), planned capacity additions and expected commissioning dates, retirement or life-extension signals for older plants, grid readiness constraints that can slow new connections, and demand indicators like generation output trends and electrification momentum. Forecasting relied on scenario analysis, where a base case is informed by primary expert consensus on project timing and policy follow-through, and upside or downside cases adjust slippage and execution rates. Where project-level details were missing, gaps were handled by applying conservative assumptions on average project size and typical construction lead times, followed by a review against the national plan totals.
Data Validation & Update Cycle
Model outputs were checked against independent signals such as reported generation output, technology mix direction, and well-covered project milestones, and then any variances were reviewed before sign-off. When an outlier appeared, we revisited the underlying assumptions, and respondents were re-contacted if the variance could be driven by timing or policy changes.
The report is refreshed on an annual cycle, and interim updates are triggered when material events occur, such as major plan revisions, project cancellations, or large commissioning shifts. Before delivery, a fresh analyst pass is completed so clients receive the most current view available at the time of publication.
Mordor Intelligence's Vietnam Power Market Sizing Compared With Other Published Estimates
Published market estimates for Vietnam power can look far apart because they are not always measuring the same thing, and the unit of measurement is often different. Some sources state market value in USD, while others describe market size using power-sector capacity or output, which changes what the number represents.
T&D buildout, retail tariff assumptions, and how renewables are counted (nameplate capacity versus delivered generation) are common drivers of gaps, and the base year also shifts when analysts update project timelines. Installed capacity series tend to move quickly when large plants connect to the grid, so a slower refresh cadence can leave older assumptions in place, even when the project pipeline has already changed.
Benchmark comparison
| Source | Market Size | Gaps in Research Methodology |
|---|---|---|
| Mordor Intelligence | USD 86.81 B (2025) | |
| Global Consultancy A | USD 17.97 B (2023) | Uses a USD value view that typically bundles generation, grid, and consumption economics, which is not directly comparable to a capacity-based sizing logic and can be sensitive to tariff and currency timing. |
| Industry Publisher B | USD 18.90 B (2024) | Frames the market as a value pool by generation types, so the total can move with price and revenue assumptions, and it may not fully reflect commissioning slippage that shifts capacity additions across years. |
Retail electricity tariffs and bill components sit outside Mordor Intelligence's scope, which is why the core market size is tied to installed capacity movements rather than an implied revenue pool. Taken together, the spread mainly comes from unit choice and scope boundaries, so aligning on what is being measured is the first step before using any estimate for planning.


Key Questions Answered in the Report
How large is the Vietnam power market today?
Installed capacity reached 95.46 GW in 2026 and is forecast to climb to 153.62 GW by 2031, reflecting a 9.98% CAGR.
Which segment holds the largest slice of national demand?
Commercial and industrial customers consumed 51.35% of electricity in 2025 and remain the dominant demand center through 2031.
What role will offshore wind play in future supply?
PDP-8 sets a 6 GW offshore wind target for 2030, requiring about 1.2 GW of annual installations from 2026 onward.
How is grid congestion being resolved?
ADB-financed 500 kV lines and JICA-backed smart-grid pilots aim to ease bottlenecks and cut curtailment, especially between central solar hubs and southern load centers.
What new procurement option is available to large power users?
The Electricity Law of 2024 authorizes direct power purchase agreements that allow industrial buyers to contract renewable generators outside EVN’s retail tariff.
Why is coal capacity shrinking?
ESG-driven financing restrictions have stranded nearly 10 GW of planned coal projects, prompting a pivot to gas, renewables, and batteries.
Page last updated on:


 Your data is secure and never sold or shared.


