
Market Overview
| Study Period | 2021 - 2031 |
|---|---|
| Forecast Data Period | 2026 - 2031 |
| Historical Data Period | 2021 - 2024 |
| Market Size (2026) | USD 7.79 Billion |
| Market Size (2031) | USD 14.89 Billion |
| Growth Rate (2026 - 2031) | 13.83 % |
| Market Concentration | Medium |
Major Players *Disclaimer: Major Players sorted in no particular order Image © Mordor Intelligence. Reuse requires attribution under CC BY 4.0. | |
Vietnam Power EPC Market Analysis by Mordor Intelligence
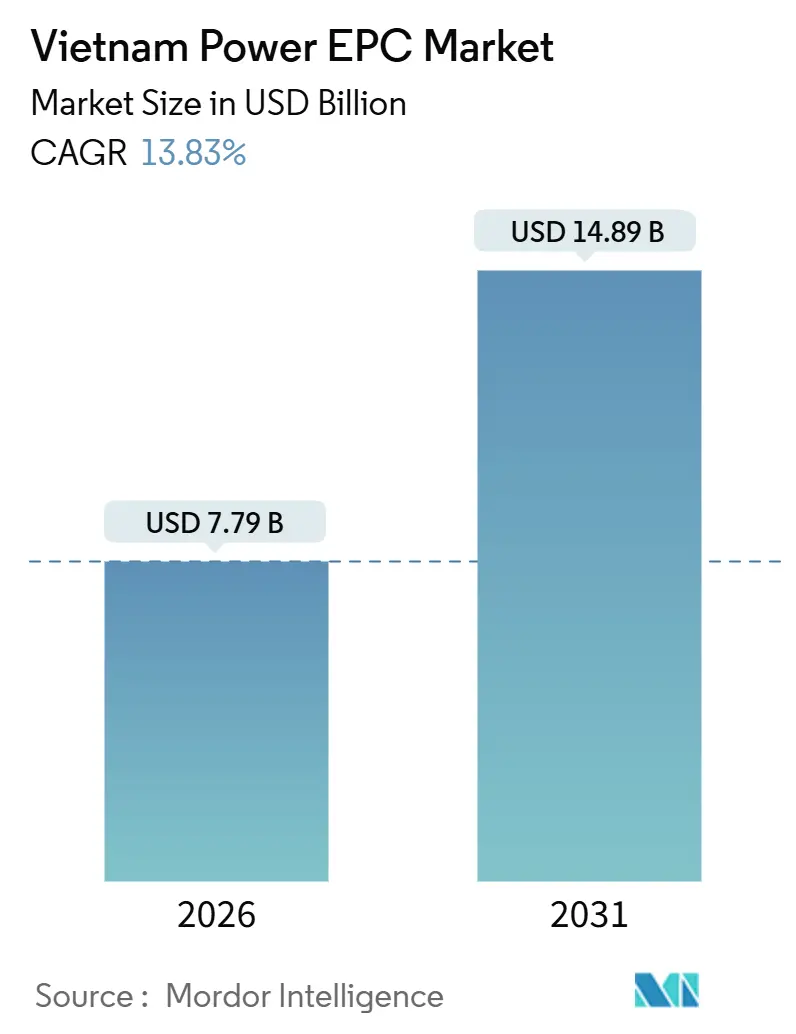
The Vietnam Power EPC Market size is estimated at USD 7.79 billion in 2026, and is expected to reach USD 14.89 billion by 2031, at a CAGR of 13.83% during the forecast period (2026-2031).
Demand acceleration stems from the revised Power Development Plan 8, an 8.6 GW coal retirement schedule, and a 150 GW generation-capacity target for 2030, all of which redirect capital toward gas and renewable engineering-procurement-construction contracts.[1]Vietnam Government Portal, “Power Development Plan 8 Summary,” vietnam.gov.vn Industrial electricity consumption rose 8.7% year-on-year in 2025 as semiconductor fabs, data centers, and export-oriented manufacturers ramped operations, while three new LNG import terminals unlocked a USD 12 billion backlog of combined-cycle gas-turbine work. Direct power-purchase agreements (DPPAs) that debuted in 2025 now allow large commercial and industrial buyers to sign 10- to 20-year renewable PPAs, catalyzing a rooftop-solar surge and supporting the Vietnam power EPC market’s near-term growth path. Mandatory battery-storage add-ons equal to 10% of project capacity further expand EPC scopes, lifting balance-of-plant spending and deepening supplier ecosystems.
Key Report Takeaways
- Vietnam's power EPC market is segmented into power generation EPC and power transmission and distribution (T&D) EPC. Power generation EPC accounted for 61.7% of the market in 2025, while power transmission and distribution (T&D) EPC is projected to grow at a 16.14% CAGR through 2031.
- By technology, renewables led with 68.5% of Vietnam's power generation EPC market share in 2025, whereas offshore wind is forecast to expand at a 15.3% CAGR through 2031.
- By capacity band, the 100 – 499 MW range captured 61.9% of the Vietnam power generation EPC market size in 2025, while the sub-100 MW distributed-energy-resource segment is poised to grow at a 16.5% CAGR to 2031.
- By end user, industrial captive power accounted for 53.1% of Vietnam's power generation EPC market size in 2025; independent power producers are advancing at a 16.1% CAGR over 2026-2031.
Note: Market size and forecast figures in this report are generated using Mordor Intelligence’s proprietary estimation framework, updated with the latest available data and insights as of January 2026.
Vietnam Power EPC Market Trends and Insights
Drivers Impact Analysis*
| Driver | (~) % Impact on CAGR Forecast | Geographic Relevance | Impact Timeline |
|---|---|---|---|
| Rapid industrial & residential load growth | 2.8% | National, with concentration in Hanoi, Ho Chi Minh City, and Hai Phong industrial zones | Short term (≤ 2 years) |
| Revised PDP 8 upsizing generation & grid CAPEX pipeline | 3.2% | National, prioritizing northern coal-to-gas conversion and southern offshore wind zones | Medium term (2-4 years) |
| Surge in LNG-to-power projects unlocking gas EPC backlog | 2.1% | Southern provinces (Ba Ria-Vung Tau, Binh Thuan) and central coast (Quang Tri) | Short term (≤ 2 years) |
| DPPA framework catalysing C&I renewable build-outs | 1.9% | Industrial parks in Bac Ninh, Dong Nai, Binh Duong | Medium term (2-4 years) |
| Mandatory storage add-ons (>10% / 2-h) boosting BESS EPC scope | 1.5% | Renewable-rich provinces (Ninh Thuan, Binh Thuan, Tra Vinh) | Medium term (2-4 years) |
| Local content incentives for wind/solar equipment & EPC services | 0.9% | National, with manufacturing hubs in Hai Phong and Da Nang | Long term (≥ 4 years) |
| Source: Mordor Intelligence | |||
Rapid Industrial & Residential Load Growth
Vietnam’s electricity consumption climbed to 280 TWh in 2025, up from 257 TWh in 2024, with industrial users supplying 58% of incremental demand as new fabrication plants and data centers came online in northern provinces. Residential demand expanded 6.2% on air-conditioning penetration topping 70% in Hanoi and Ho Chi Minh City, and on 1.2 GW of evening-peak charging load from electric two-wheelers.[2]International Energy Agency, “Southeast Asia Energy Outlook 2025,” iea.org Sustained load growth forces utilities and IPPs to fast-track baseload additions, yet transmission constraints push industrial parks toward captive generation, fragmenting the Vietnam power EPC market into utility-scale and behind-the-meter segments. Export-processing zones in Bac Ninh and Hai Phong logged 47 unplanned outages in 2025, prompting multinationals to stipulate on-site backup capacity in lease contracts. The government plans to electrify all rural households by 2027, adding 3.5 GW of distribution upgrades, creating auxiliary EPC demand for low-voltage equipment.
Revised PDP 8 Upsizing Generation & Grid CAPEX Pipeline
The final Power Development Plan 8, approved in 2024, lifts the 2030 installed-capacity target to 150 GW, 30 GW more than the draft, and earmarks USD 18 billion for 500 kV corridors that will move offshore wind from the south-central coast to the Red River Delta. The policy retires 8.6 GW of subcritical coal by 2030 and sets a 15 GW LNG target, sustaining a double-digit EPC trajectory for cleaner thermal assets. Offshore wind allocation climbs from 6 GW to 10 GW, reflecting lower levelized costs in shallow-water sites once grid costs are socialized. A new “grid-first” rule means generation projects cannot reach financial close until EVN confirms substation availability, front-loading T&D EPC awards, and lengthening generation timelines. An Asian Development Bank USD 2.5 billion concessional loan package, signed in 2025, lowers weighted-average capital costs for 500 kV projects to 7.2%, allowing contractors to bid more aggressively. [3]Asian Development Bank, “Vietnam Grid Expansion Loan,” adb.org
Surge in LNG-to-Power Projects Unlocking Gas EPC Backlog
Three regasification terminals, Thi Vai, Son My, and Quang Tri, began service between January 2024 and September 2025, clearing the fuel bottleneck that had stalled 6.8 GW of combined-cycle projects. PetroVietnam Power and Samsung C&T’s 1,624 MW Nhon Trach 3 & 4 plant entered commercial operation in June 2025, using GE 9HA.02 turbines at 64% net efficiency, the region’s highest thermal benchmark. Quang Trach II broke ground in March 2025 under a USD 1.9 billion contract that features Siemens Energy SGT5-8000H turbines and air-cooled condensers to curb freshwater use. Indexing LNG tariffs to Henry Hub prices instead of oil benchmarks reduces offtaker risk, enabling 4.2 GW of new CCGT PPAs in 2025. OEMs secure 40-50% of lifecycle EPC value through long-term service agreements, exemplified by GE Vernova’s 20-year LTSA that guarantees 95% availability at Nhon Trach 3 & 4.
DPPA Framework Catalyzing C&I Renewable Build-Outs
Decree 57/2025 permits customers using more than 30 GWh annually to sign bilateral PPAs of up to 20 years, bypassing EVN and unlocking rooftop and ground-mount solar previously constrained by net-metering caps. By October 2025, 127 contracts totaling 890 MW had been registered, with textiles, steel, and electronics accounting for 73% of offtake. World Bank partial-risk guarantees launched in June 2025 cut solar borrowing costs by roughly 200 basis points, enabling non-recourse finance for projects as small as 5 MW. Rooftop-solar EPC margins eased to 8-9% as 34 domestic contractors entered the segment, yet the sub-100 MW band will post a 16.5% CAGR on the back of continued industrial-park expansion. Decree 135/2024’s removal of the 20% net-metering ceiling lets factories size solar to full daytime load, tripling the distributed-generation opportunity set.
Restraints Impact Analysis*
| Restraint | (~) % Impact on CAGR Forecast | Geographic Relevance | Impact Timeline |
|---|---|---|---|
| Grid congestion & curtailment risk inflating project IRRs | -1.8% | Southern provinces (Ninh Thuan, Binh Thuan, Tra Vinh) and central coast | Short term (≤ 2 years) |
| Retroactive FIT revisions eroding investor confidence | -1.2% | National, affecting projects commissioned 2019-2021 | Medium term (2-4 years) |
| Skilled EPC labour shortages for high-voltage & offshore works | -0.9% | Offshore wind zones and 500 kV transmission corridors | Medium term (2-4 years) |
| EVN credit-risk overhang on long-term PPAs | -1.4% | National, most acute for IPP-developed renewable projects | Short term (≤ 2 years) |
| Source: Mordor Intelligence | |||
Grid Congestion & Curtailment Risk Inflating Project IRRs
Solar and wind curtailment averaged 18% in southern provinces during H1 2025, equal to 1,240 GWh of lost output as 500 kV lines operated above rated capacity. Delays to the Thuan Nam-Phuoc Long upgrade forced operators to trim 2.1 GW of solar on 87 days, wiping USD 31 million from generator revenues. Developers now model 12-15% curtailment when pricing PPAs, pushing LCOE up USD 6-8 per MWh and squeezing equity IRRs below regional benchmarks. Land near spare-capacity substations trades 40-60% higher than parcels in congested zones, fragmenting the pipeline into smaller deals. EVN’s USD 6.2 billion southern transmission plan will not relieve congestion until 2028-2029, suppressing annual EPC awards in the interim.
Retroactive FIT Revisions Eroding Investor Confidence
Circular 02/2024 cut tariffs for 1,247 MW of 2019-2020 solar projects from USD 93.5 to USD 71.2 per MWh, prompting 23 arbitration claims and an 80-120 basis-point rise in borrowing spreads for new deals. Moody’s downgraded Vietnam’s regulatory-stability score to Ba1 in 2025, while lenders now require 20-year revenue floors or World Bank risk coverage, adding six to nine months to development timelines.[4]Moody’s Investors Service, “EVN Credit Opinion,” moodys.com Even projects with signed PPAs struggle to close; 340 MW of solar commissioned in 2025 remains unfinanced due to tariff-revision fears.
*Our forecasts treat driver/restraint impacts as directional, not additive. The impact forecasts reflect baseline growth, mix effects, and variable interactions.
Segment Analysis
By Technology: Offshore Wind Drives Renewable Dominance
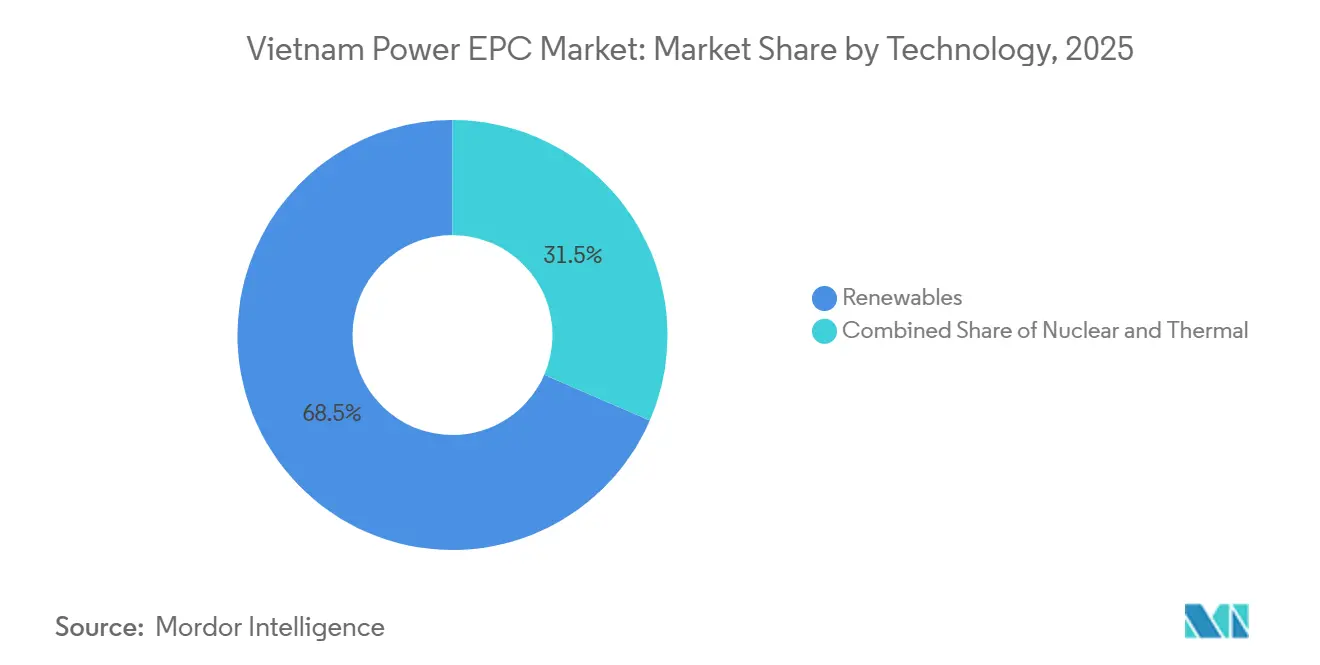
Renewables commanded 68.5% of Vietnam's power generation EPC market share in 2025 and are set to expand at a 15.3% CAGR through 2031 as offshore wind shifts from study to execution, led by the 3.5 GW La Gan and 2.1 GW Hai Long blocks valued at USD 13.6 billion. Thermal capacity, primarily LNG-fired CCGT, occupied the remaining 31.5% but still anchors baseload with 9HA.02 turbines delivering 64% efficiency at Nhon Trach 3 & 4.
Offshore wind's engineering complexity, monopile foundations in 25-40 meter depths, and 220 kV subsea links of 80-120 kilometers, keep EPC costs at USD 3,200-3,800 per kW, far above utility-scale solar at USD 650-750 per kW. Thermal EPC share slips as financiers exit coal; 17 global banks adopted coal-exclusion policies during 2024-2025, forcing the 600 MW Quang Trach I upgrade to convert from coal to LNG mid-design. Still, PDP 8 caps renewable penetration at 47% by 2030 for grid stability, ensuring thermal EPC holds at least one-quarter of Vietnam's power generation EPC market value through 2031.


By Capacity Band: DER Segment Surges on DPPA Momentum
Projects sized 100-499 MW secured 61.9% of Vietnam's power generation EPC market size in 2025, the sweet spot for provincial auctions that balance scale with grid-connection feasibility. Sub-100 MW distributed resources, underpinned by DPPAs and net-metering reforms, will grow at a 16.5% CAGR, reflecting factory demand for rooftop solar and BESS hedges against future tariff hikes.
Above-500 MW ventures, namely offshore wind and LNG CCGT, accounted for 23% of the 2025 EPC value but require 54 months on average from feasibility to commercial operation due to complex environmental and guarantee procedures. The government's 2025 exemption of sub-30 MW projects from mandatory storage cut capital intensity 18-22%, lifting distributed-generation IRRs to 13-15% and spurring a wave of rooftop financings in H2 2025.
By End-User: Industrial Captive Power Leads, IPPs Accelerate
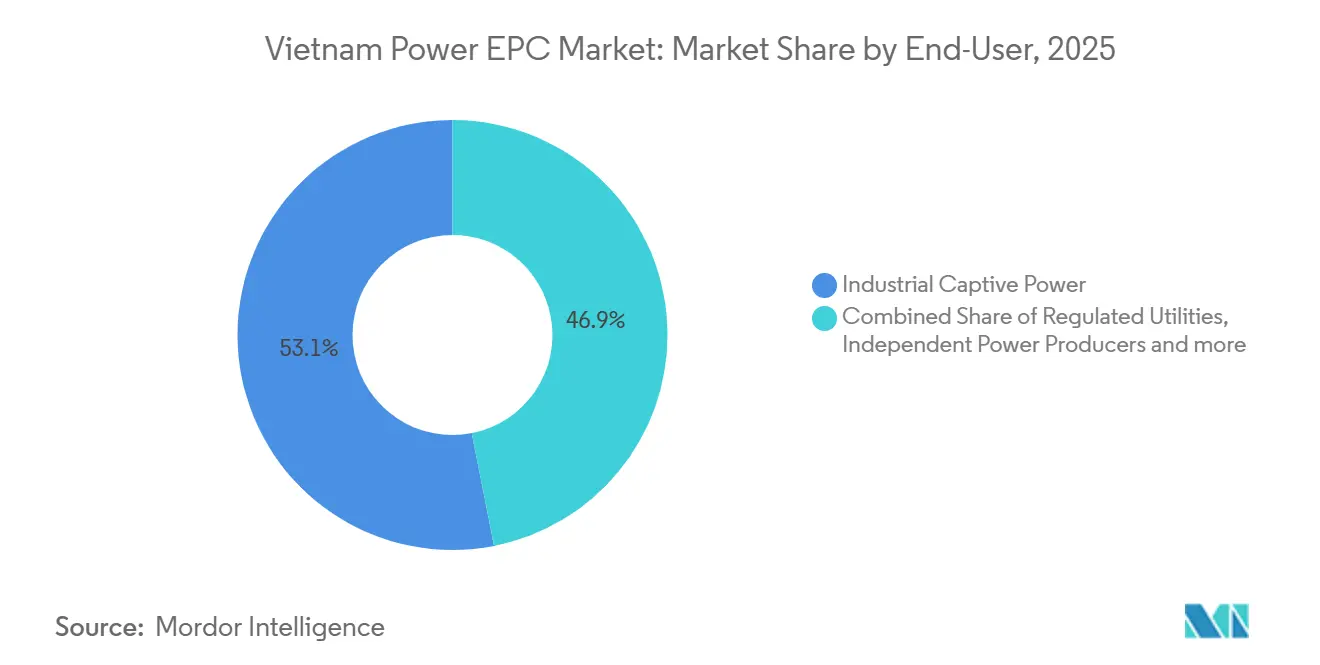
Industrial captive schemes held 53.1% of the Vietnam power generation EPC market size in 2025, as export zones faced 47 grid outages per site and mandated on-site generation for 99.99% uptime. Independent power producers will grow at a 16.1% CAGR, buoyed by an 8 GW renewable auction slated for 2026 and newfound ability to sell directly to C&I buyers under DPPAs.
Regulated utilities, mainly EVN subsidiaries, controlled 28% of EPC value in 2025 and are now prioritizing T&D assets, while SOEs such as PetroVietnam Power focus on strategic LNG and offshore wind projects requiring sovereign support. Captive power remains heterogeneous: 62% of 2025 spend was gas cogeneration, 28% rooftop solar plus BESS, and 10% diesel gensets converted to dual-fuel for emission compliance.
Geography Analysis
Southern Vietnam captured 48% of the 2025 EPC value thanks to industrial-park density and proximity to Thi Vai and Vung Tau LNG terminals. The south-central coast’s solar-and-wind cluster took 31%, though curtailment hit 18% because the Thuan Nam-Phuoc Long 500 kV line will not finish until mid-2026. Northern provinces held 21%, with a rooftop-solar tilt and coal-to-gas conversions on tap once north-south gas pipeline work begins in 2026.
Offshore wind priority zones in Binh Thuan and Tra Vinh enjoy expedited seabed leases, concentrating 4.8 GW of the national 10 GW target and attracting supply-chain clusters for monopile, cable, and vessel services. Northern rooftop solar benefits from higher industrial tariffs, USD 95 versus USD 82 per MWh in the south, shortening payback to 5.2 years despite 12% lower irradiation. The Mekong Delta remains underrepresented (below 3% of investment) due to land subsidence, raising foundation costs 30-40%.
Regulatory Landscape
Vietnam's power EPC activity operates under the Ministry of Industry and Trade (MOIT) and its Electricity Authority of Viet Nam (EAV), which oversee electricity licensing, planning and market and pricing mechanisms, alongside sector safety requirements. The legal backbone was refreshed through the Law on Electricity No. 61/2024/QH15 (effective February 1, 2025), which codifies power development planning, project investment, renewables and new energy, and competitive market operations, creating a clearer compliance baseline for EPC bidders and project owners.
Implementation and project award processes were further detailed in Decree 56/2025/ND-CP, tightening alignment between national and provincial power plans and investment bidding rules that shape how utility-scale generation packages are tendered and contracted. For 2026-2030, Resolution 253/2025/QH15 frames priority mechanisms for national energy development, including offshore wind and the direct power purchase agreement (DPPA) pathway. The Integrated Document 07/VBHN-VPQH (February 2026) consolidates the electricity legal framework after amendments from related laws passed in 2025, supporting more consistent interpretation during permitting, procurement, and construction execution.
Competitive Landscape
The top five contractors, Samsung C&T, Lilama, Doosan Enerbility, Siemens Energy, and GE Vernova, combined for 42% of the Vietnam power EPC market value in 2025, leaving the remainder to 17 domestic and 18 foreign rivals. Thermal EPC centers on incumbents with EVN ties; Samsung C&T secured three of five LNG contracts by pairing 6-8% margins with vendor financing that trims upfront capital 25-30%. Offshore wind alliances such as CIP-PetroVietnam corner early awards by mixing European know-how with state logistics assets.
Storage mandates open white space for integrators like Fluence and Wartsila, while Vietnamese steel makers Hoa Phat and Hoa Sen are backward-integrating into wind-tower fabrication to exploit 40% local-content incentives, undercutting imports by up to 18%. OEM differentiation hinges on efficiency patents: Vestas’ modular nacelle assembly trims on-site time 22%, and Siemens Energy’s hybrid cooling cuts auxiliary power 1.8 percentage points, protecting premium pricing amid margin compression.
Vietnam Power EPC Industry Leaders
IHI Infrastructure Systems Co.,Ltd.
Lilama Corporation
Doosan Enerbility Co. Ltd.
JGC Vietnam Co. Ltd
Power Engineering Consulting JSC 2 (PECC2)
- *Disclaimer: Major Players sorted in no particular order


Market Opportunities and Future Outlook
Execution of large, state-linked LNG-to-power packages is a near-term whitespace for EPC firms that can manage consortium delivery, complex procurement, and interfaces across regasification, pipelines, and combined-cycle blocks. A concrete signal is EVN's EPC signing for the 1,612.8 MW Quang Trach II LNG Thermal Power Plant with PowerChina and LILAMA in February 2026 (reported at over USD 962 million), which reinforces a pipeline of high-value balance-of-plant, electrical, and commissioning scopes for contractors positioned around gas-fired baseload additions.
Behind-the-meter and C&I renewable build-outs expand the addressable EPC pool where developers and industrial offtakers look for faster construction cycles and bankable contracting structures. Decree 57/2025 established the DPPA framework, and by October 2025, 127 DPPA contracts totaling 890 MW had been registered, keeping demand active for sub-100 MW solar plus storage and associated interconnection works, especially in industrial parks. In parallel, the adjusted PDP 8 pathway approved by the Prime Minister (Decision 768/QD-TTg, April 2025) and MOIT updates such as Decision 618/QD-BCT (March 2025) steer implementation toward integrated generation and grid readiness, creating an opening for EPC providers that can bundle grid-connection engineering, substation packages, and storage-ready designs to reduce curtailment exposure.
Recent Industry Developments
- April 2026: Doosan Enerbility signed MOUs with PetroVietnam Technical Services (PTSC) and PETROCONs to cooperate on new nuclear power projects and supply chain development, referencing the Ninh Thuan 2 project. The agreements show early positioning by a major equipment and EPC player in a potential new-build segment that would require high-spec civil, mechanical, and QA/QC capabilities beyond conventional thermal and renewables.
- February 2026: A consortium of Lilama Corporation and PowerChina signed an EPC contract with Vietnam Electricity (EVN) for Component 1 (power plant) of the Quang Trach II LNG Thermal Power Plant project, reported at about USD 974 million. The award underscores the role of large consortium EPC models in Vietnam's gas-to-power pipeline and increases competitive pressure on contractors that cannot match financing support, procurement scale, and schedule control.
- June 2025: A consortium of Doosan Enerbility and Power Engineering Consulting Joint Stock Company 2 (PECC2) signed an EPC contract with Petrovietnam for the O Mon 4 gas-fired combined cycle power plant, reported at around KRW 900 billion (about USD 664 million). The contract reinforces momentum in the Block B-O Mon gas-to-power chain and increases demand for EPC capabilities in CCGT integration, grid interconnection, and high-reliability commissioning in the Mekong Delta load corridor.


Research Methodology Framework and Report Scope
Market Definition and Coverage
This market is defined as the value of engineering, procurement, and construction work delivered for power generation projects located in Vietnam, counted as EPC contract value tied to new builds and major build phases.
Scope exclusions: This sizing excludes operations and maintenance revenue, contract amendments, and stand-alone transmission and distribution EPC packages.
Segmentation Overview
- Power Generation EPC
- By Technology
- Thermal
- Nuclear
- Renewables
- By Capacity Band
- Up to 100 MW (DER, micro-grid)
- 100 to 499 MW
- Above 500 MW
- By End-User
- Regulated Utilities
- Independent Power Producers
- Industrial Captive Power
- Public Sector and SOE
- By Technology
- Power Transmission and Distribution (T&D) EPC
Data Sources, Market Sizing, and Validation
Desk Research
Desk research was used to build the starting picture of Vietnam power additions and the practical EPC demand pool behind them. We referred to public sources such as Vietnam energy and power planning documents, the General Statistics Office for macro indicators, International Energy Agency country energy data, and IRENA renewable capacity statistics.
To make the inputs usable in a market model, project announcements and award notes from utility and ministry channels were cross-checked with company annual reports, investor presentations, and reputable press coverage. For consistency checks on contractor activity and timelines, we also used paid subscriptions that compile company financials and track news and project developments, plus a patent database only where it helped validate technology direction. The examples listed here are illustrative, and many other public sources were reviewed for collection, cross-checks, and clarification.
Primary Interviews and Surveys
Primary work focused on validating EPC scope assumptions that desk research often leaves unclear, such as what is bundled into turnkey packages and how progress billing maps to project milestones. We spoke with a mix of EPC-side leaders, procurement and project managers, and industry advisors across Vietnam-facing teams, covering different project types from thermal and gas to renewables.
These conversations helped confirm typical contract structures, schedule risk buffers, and the pace at which announced projects move into real construction activity, and then the assumptions were tightened before the final model was locked.
Distribution of primary research fieldwork respondents
| Company type | Respondent position |
|---|---|
| Top tier: 37% | CXOs: 14% |
| Mid tier: 44% | Functional/Unit leaders: 33% |
| Smaller Players: 19% | Managers: 53% |
Market-Sizing & Forecasting
Sizing started from a top-down build that reconstructs the EPC demand pool from Vietnam power project pipelines, capacity additions, and typical EPC cost intensity by plant type, and then converts that activity into annual contract value recognized through build-stage timing. To keep the totals realistic, selective bottom-up approximations were used as a check, such as sampled project values from public awards and a roll-up of active contractor participation in major announced builds.
Key inputs that shaped the model included planned and under-construction capacity by technology, expected commissioning schedules, policy-driven shifts in the generation mix, imported equipment intensity for large projects, and inflation effects on civil and electrical balance-of-plant costs. Where project data was incomplete, gaps were handled with conservative default ranges agreed in interviews, and then narrowed using comparable recent awards and schedule patterns.
Forecasting relied on scenario analysis supported by expert consensus on execution pace, grid readiness, and financing conditions, and the output was stress-tested by varying award slippage and cost escalation assumptions.
Data Validation & Update Cycle
Outputs were triangulated against independent signals like project award cadence, construction start patterns, and the implied EPC value per MW for the dominant technologies in Vietnam. Any sharp year-on-year jumps were reviewed, and the drivers were re-checked back to the project list and the input assumptions before internal sign-off.
The report is refreshed annually, and interim updates are triggered when there are material policy changes, major award announcements, or visible schedule shifts in large projects. Before delivery, we do a final review pass to ensure the latest public releases and validated primary feedback are reflected in the numbers.
Mordor Intelligence's Vietnam Power Epc Market Size Measured Against Other Published Estimates
Published market sizes for Vietnam power EPC do not always line up, and it usually comes down to what each study counts as EPC value and how project timing is converted into a single-year number. Differences also show up when forecasts assume faster or slower award conversion, or when currency timing is handled differently across years.
Some external estimates appear to bundle broader power infrastructure packages and treat the market more like a national power capex total. For Mordor Intelligence, the total is limited to EPC contract value tied to power generation build activity in Vietnam, and it excludes O&M revenue and stand-alone T&D packages so the number stays linked to executable EPC scope.
Benchmark comparison
| Source | Market Size | Gaps in Research Methodology |
|---|---|---|
| Mordor Intelligence | USD 7.79 B (2026) | |
| Industry Research Publisher A | USD 3.24 B (2025) | Uses an earlier base year and a slower growth path, and its scope presentation suggests a broader mix of power sector spending that may not isolate generation EPC recognition timing the same way. |
| Industry Research Publisher B | USD 3.20 B (2025) | Anchors the market in 2025 with a lower starting value, and the estimate can diverge if EPC is counted more as announced project spend rather than construction-linked contract value recognition. |
The comparison shows that the spread is mainly explained by year selection and what is counted inside EPC, not by a disagreement that Vietnam needs new capacity. By keeping the model tied to project execution timing and clearly stated inclusions and exclusions, the result is easier to reproduce and to use for planning decisions.


Key Questions Answered in the Report
What is the projected CAGR for power EPC spending in Vietnam from 2026 to 2031?
Spending is forecast to rise at a 13.83% CAGR, moving from USD 7.79 billion in 2026 to USD 14.89 billion by 2031.
Which generation technology is positioned to attract the most EPC capital during the forecast period?
Renewables, led by offshore wind, already held 68.5% of 2025 value and are expected to expand at a 15.3% CAGR through 2031.
How does the DPPA framework change corporate access to renewable electricity?
Decree 57/2025 lets commercial and industrial customers consuming more than 30 GWh per year sign 10- to 20-year power-purchase agreements directly with renewable generators, bypassing EVN and cutting financing costs by roughly 200 basis points.
Why is grid congestion a critical risk for developers in southern Vietnam?
Transmission delays pushed solar-and-wind curtailment to 18% of output in H1 2025, inflating levelized costs by USD 6-8 per MWh and lowering equity IRRs.
Which region currently accounts for the largest share of EPC spending and why?
The southern economic corridor captures 48% of generation EPC value thanks to dense industrial parks and nearby LNG terminals that support both captive gas power and large renewable builds.
Page last updated on:


 Your data is secure and never sold or shared.


