
Market Overview
| Study Period | 2020 - 2031 |
|---|---|
| Forecast Data Period | 2026 - 2031 |
| Base Year Market Size (2025) | USD 46.56 Billion |
| Market Size (2026) | USD 52.19 Billion |
| Market Size (2031) | USD 83.02 Billion |
| Growth Rate (2026 - 2031) | 9.73 % |
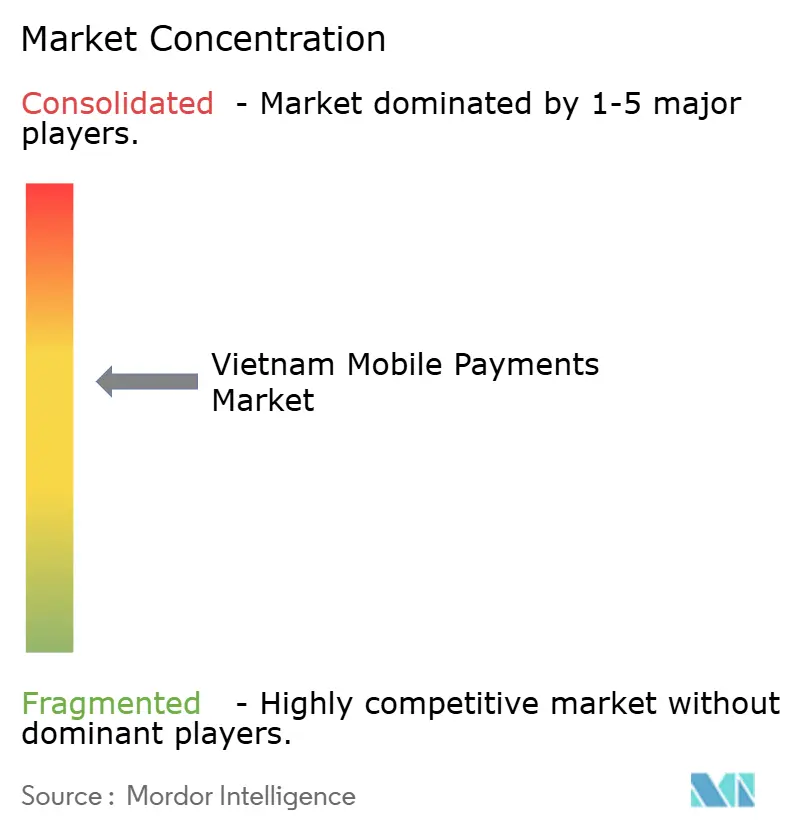
| Market Concentration | Medium |
Major Players *Disclaimer: Major Players sorted in no particular order Image © Mordor Intelligence. Reuse requires attribution under CC BY 4.0. | |
Vietnam Mobile Payments Market Analysis by Mordor Intelligence
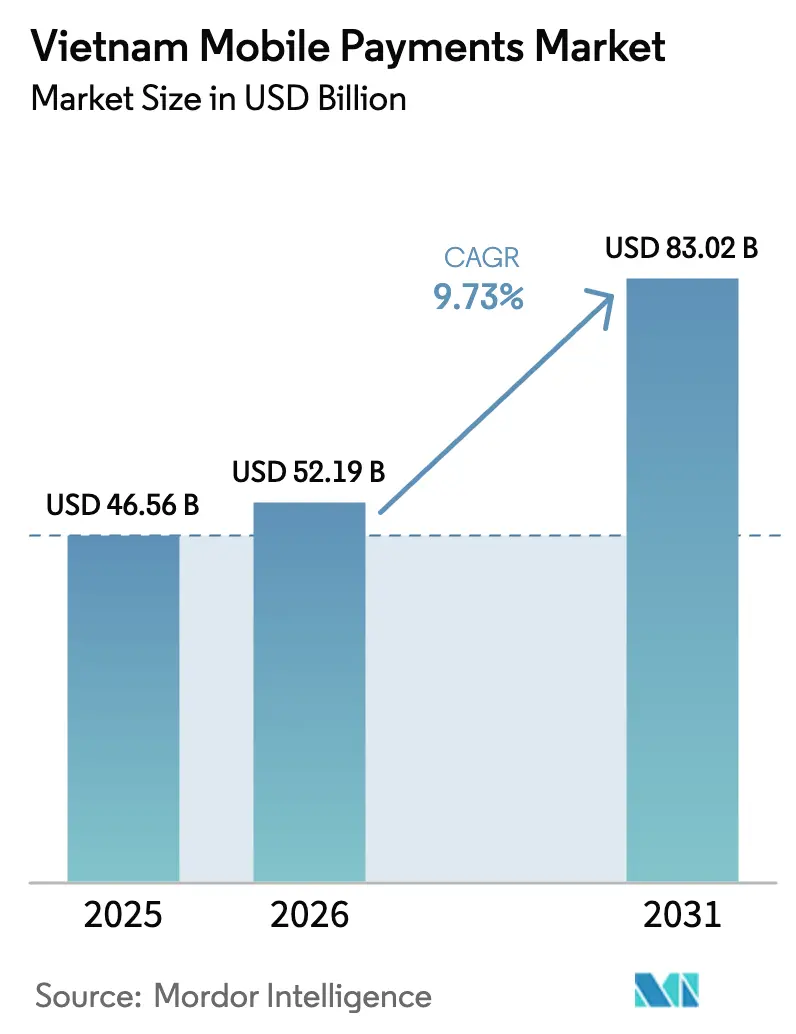
The Vietnam mobile payments market size was valued at USD 46.56 billion in 2025 and is estimated to grow from USD 52.19 billion in 2026 to reach USD 83.02 billion by 2031, at a CAGR of 9.73% during the forecast period (2026-2031). A policy goal to lift non-cash payments to 30 times GDP by 2030 is accelerating QR-code acceptance among micro-merchants and steering consumers away from cash. The cap on small-ticket QR fees, an 80% cash-free target for e-commerce transactions, and the rapid onboarding of VietQR codes together create structural momentum for the Vietnam mobile payments market. Platform convergence around super-apps, where wallets sit next to ride-hailing, food delivery, and shopping, is compressing customer-acquisition costs while raising switching barriers. Meanwhile, cross-border QR links with Thailand and Singapore provide new remittance corridors and make the Vietnam mobile payments market more attractive to migrant workers and tourists.
Key Report Takeaways
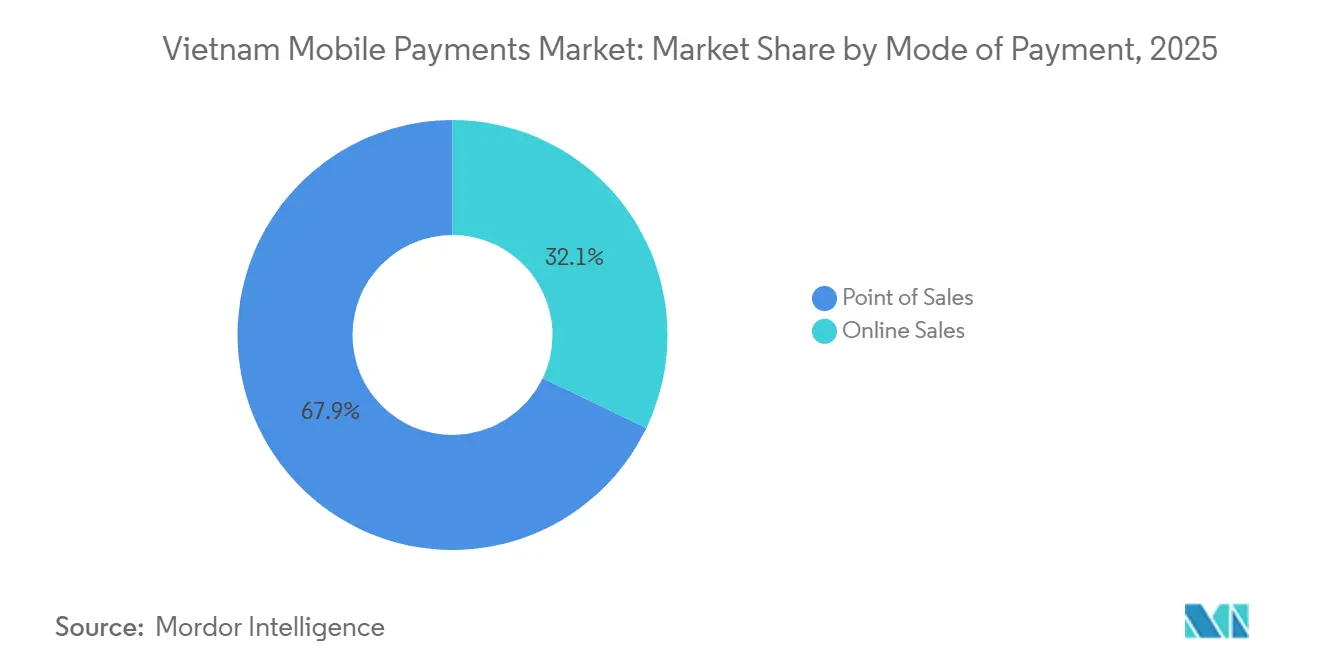
- By mode of payment, point-of-sale transactions led with 67.89 % revenue share in 2025, while online channels are projected to post the fastest 10.43 % CAGR through 2031.
- By payment type, QR codes held 54.67 % of the Vietnam mobile payments market share in 2025, whereas biometric and other tokenized methods are forecast to expand at an 11.24 % CAGR over 2026-2031.
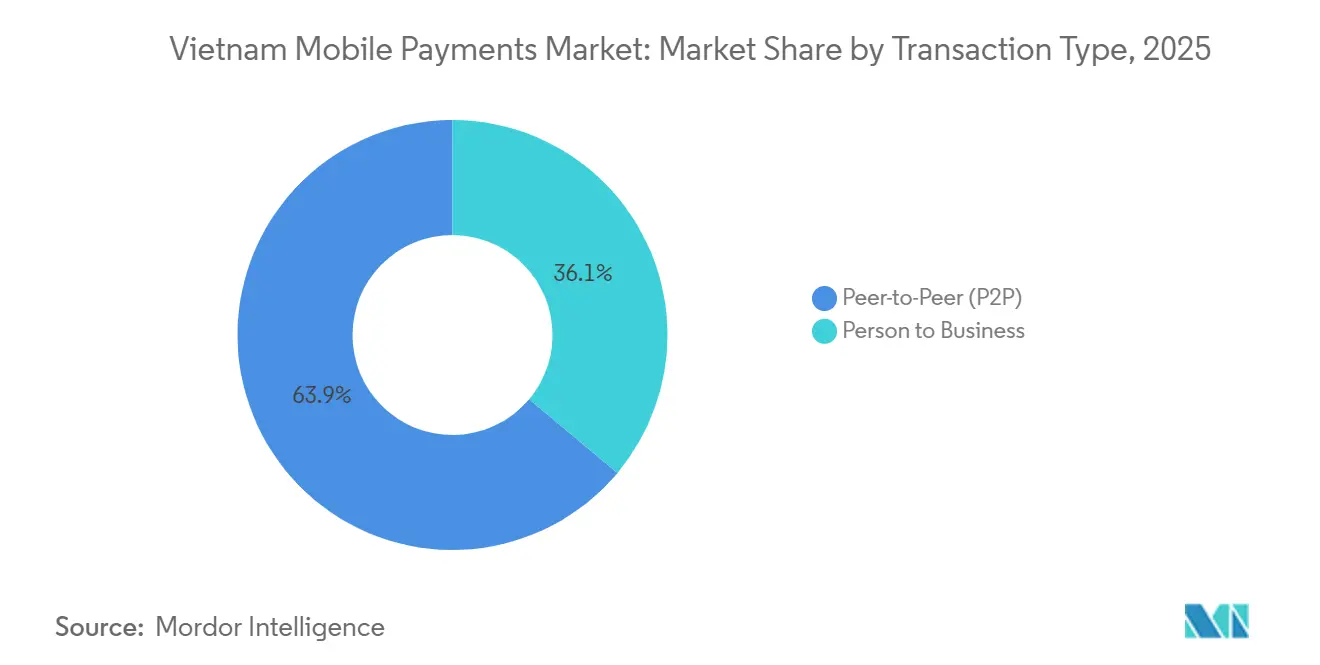
- By transaction type, peer-to-peer transfers accounted for 63.92 % of transaction volumes in 2025, yet person-to-business flows are set to grow at a 10.27 % CAGR in the same period.
- By application, retail and e-commerce captured 58.59 % of spending in 2025, but government and public-sector payments are anticipated to register the highest 11.16 % CAGR to 2031.
Note: Market size and forecast figures in this report are generated using Mordor Intelligence’s proprietary estimation framework, updated with the latest available data and insights as of 2026.
Market Trends and Insights
Drivers Impact Analysis of Vietnam Mobile Payments Market*
| Driver | (~) % Impact on CAGR Forecast | Geographic Relevance | Impact Timeline |
|---|---|---|---|
| Rising internet and smartphone penetration | +2.1% | National, with urban centers Hanoi and Ho Chi Minh City leading adoption | Short term (≤ 2 years) |
| Government push for cashless economy | +2.8% | National, driven by State Bank of Vietnam and Ministry of Finance mandates | Medium term (2-4 years) |
| Surge in e-commerce spend | +2.3% | National, concentrated in Southern Vietnam (Ho Chi Minh City, Dong Nai) | Medium term (2-4 years) |
| Super-app ecosystem partnerships | +1.9% | National, with spillover to Central Vietnam as platforms expand logistics | Short term (≤ 2 years) |
| Rapid QR-code merchant onboarding via VNPay24 | +1.2% | National, particularly in Northern Vietnam (Hanoi, Hai Phong) | Short term (≤ 2 years) |
| Cross-border QR linkage with Thailand and Singapore | +0.8% | Southern Vietnam (border provinces) and major cities with expatriate populations | Long term (≥ 4 years) |
| Source: Mordor Intelligence | |||
Rising Internet and Smartphone Penetration
Vietnam counted 127 million mobile connections in early 2025, a figure that exceeds the population due to dual-SIM usage and underpins ubiquitous wallet access.[1] Smartphone penetration climbed to 84 % as lower-priced Android handsets from local and Chinese brands made entry-level devices accessible nationwide. Expanded 4G coverage to 99.8 % of communes lowered transaction latency, enabling instant QR scans even in rural markets. High-speed coverage supports real-time confirmations that build user confidence and reduce checkout abandonment. Although just 12 % of connections were on 5G in early 2025, pilot zones in Hanoi and Ho Chi Minh City suggest advanced authentication features will scale quickly once spectrum auctions conclude.
Government Push for Cashless Economy
Decision 2345/QD-NHNN requires that 80 % of e-commerce transactions be non-cash by 2030, compelling online marketplaces to integrate bank transfer and wallet options by default.[2] Circular 25/2025, effective April 2025, eliminated QR-transaction fees for purchases below VND 500,000, removing a key barrier for street vendors and convenience stores. The National Public Service Portal now hosts 3,800 administrative services payable via MoMo, ZaloPay, and ViettelPay, normalizing wallet use for taxes, licensing fees, and utility bills. This public-sector digitization has shifted 96 % of tax payments to electronic channels, accelerating habitual wallet use beyond retail scenarios. Mandatory know-your-customer and real-time monitoring rules introduced in Circular 45/2025 raise compliance costs but simultaneously elevate trust in the Vietnam mobile payments market.
Surge in E-Commerce Spend
Vietnam’s e-commerce value reached USD 20.5 billion in 2024, with 70 % of checkouts initiated on mobile devices.[3] Platforms such as Shopee, Tiki, and Lazada embed native wallets to cut cash-on-delivery reliance, ramping same-day fulfillment in 12 cities to entice digital payments. Flash-sale events see wallet peaks of 50,000 transactions per second on MoMo, demonstrating that infrastructure can handle national shopping festivals.[4] Food-delivery incentives and social-commerce livestreams entice micro-merchants to prefer QR payments that settle within 24 hours. As checkout friction falls and loyalty ecosystems deepen, online spend continues to divert from cash channels.
Super-App Ecosystem Partnerships
MoMo’s tie-up with BIDV extended instant credit lines up to VND 50 million (USD 0.002 million)) to users with six months of activity, blurring the line between payment and lending services. Grab integrated GrabPay with Moca to enable wallet transfers and bill payments inside its ride-hailing and food-delivery app, giving 40 million users a single payment credential. ZaloPay exploits Zalo’s 75 million active users to introduce in-chat bill splitting and gifting features that reached 20 million active users by mid-2025. ViettelPay bundles telecom top-ups with 10 % bonus data, turning 15 million subscribers into wallet customers. These inter-linked ecosystems generate powerful network effects that create high switching costs for the Vietnam mobile payments market.
Restraints Impact Analysis of Vietnam Mobile Payments Market*
| Restraint | (~) % Impact on CAGR Forecast | Geographic Relevance | Impact Timeline |
|---|---|---|---|
| Cyber-fraud and phishing incidents | -1.4% | National, with higher incidence in urban areas due to greater digital exposure | Short term (≤ 2 years) |
| Low financial-literacy pockets in rural areas | -1.1% | Northern and Central Vietnam (upland provinces with limited infrastructure) | Medium term (2-4 years) |
| Fragmented QR-code standards pre-VietQR | -0.6% | National, legacy issue now mitigated by VietQR rollout | Short term (≤ 2 years) |
| High interchange fees on small-ticket proximity payments | -0.9% | National, affecting micro-merchants in informal sectors | Medium term (2-4 years) |
| Source: Mordor Intelligence | |||
Cyber-Fraud and Phishing Incidents
Vietnam logged 13,900 cyberattacks in 2024, with 38 % aimed at financial services and 1.4 million phishing attempts blocked in 1Q 2024 alone. Two-factor authentication is now compulsory for transfers above VND 10 million (USD 0.0004 million), yet smaller wallets face roughly VND 2 billion (USD 0.00008 billion) in compliance expenses to upgrade systems. 22 % cite security fears as their main objection to mobile payments versus 9 % in cities. Education campaigns and opt-in fraud insurance exist but suffer low uptake due to complicated claims.
Low Financial-Literacy Pockets in Rural Areas
While 87 % of adults have bank accounts, the remaining 13 % cluster in mountainous provinces where language and connectivity barriers impede wallet use. A State Bank survey found 41 % of rural respondents could not articulate the difference between a bank transfer and a wallet transaction. Mobile-money accounts, predominantly rural at 72 %, cap monthly transactions at VND 100 million (USD 0.004 million)), limiting their fit for farm-gate produce sales. New Ministry of Finance programs earmark VND 500 billion (USd 0.019 billion) for digital-literacy outreach, but trainer shortages and pandemic recovery priorities are causing slow rollouts.
*Our forecasts treat driver/restraint impacts as directional, not additive. The impact forecasts reflect baseline growth, mix effects, and variable interactions.
Vietnam Mobile Payments Market Segment Analysis
By Mode of Payment:
Online Channels Gain MomentumPoint-of-sale payments captured 67.89 % of the Vietnam mobile payments market share in 2025 as cash-replacement efforts focused on wet markets, convenience stores, and transit kiosks. Yet the online channel is projected to grow at a 10.43 % CAGR to 2031, reflecting aggressive one-click checkout adoption and QR interoperability that cut abandonment rates. VietQR lets any bank or wallet settle to a single code, halving countertop clutter and encouraging corner shops to digitize. Meanwhile, near-field communication readers in bus and metro systems already handle 28 % of fare payments in Ho Chi Minh City, a sign that contactless acceptance will coexist with QR for high-throughput environments.
The Vietnam mobile payments market size tied to online checkouts accelerates in product categories served by same-day delivery. ShopeePay grants priority fulfillment for wallet users, while MoMo offers installment plans without interest, widening ticket sizes for electronics and fashion. Cross-border shoppers benefit from VNPay’s multi-currency support, which locks exchange rates at the moment of purchase. Government portals reached 100 % online coverage in late 2024, pushing business registrations and land-title fees into the digital domain and guaranteeing baseline volume for online channels regardless of retail cycles.
By Payment Type:
QR Codes Dominate but Biometric Options RiseQR codes held 54.67 % of transactions in 2025 because a printed code and a phone camera cost nothing to deploy, essential for Vietnam’s millions of micro-merchants. VietQR standardized formats across 40 banks and reported 66.7 % volume growth in the first seven months of 2025. Cross-border links with Thailand and Singapore make domestic wallets usable abroad, shaving 1.2 percentage points off foreign-exchange spreads relative to card rails.
Other methods that include tokenized card-on-file, wearable devices, and biometric logins are forecast to expand at an 11.24 % CAGR, the fastest among payment types. Apple Pay and Samsung Pay ride on affluent segments who favor single-use tokens over static credentials. MoMo’s voice-activated payment pilot addresses older users and the visually impaired, while Hanoi’s metro ships 5 % fare discounts to anyone tapping an NFC card, reducing cash counting time for transport operators. A USD 300 terminal pays back only after 18 months for a small merchant, keeping QR the frontline choice for the Vietnam mobile payments market.
By Transaction Type:
Enterprises Fuel P2B UpswingPeer-to-peer flows represented 63.92 % of 2025 volumes, driven by social gifting and informal remittances; ZaloPay alone handled 12 million digital red envelopes during Lunar New Year. Yet person-to-business payments will rise at a 10.27 % CAGR as firms digitize payroll, vendor invoices, and tax remittances.
VNPay’s instant-settlement network pays merchants within 24 hours, replacing week-long bank clears and freeing up working capital. Ride-hailing fleets mandate wallets for corporate rides, funneling expense reporting data directly into enterprise systems and tightening audit trails. Circular 25/2025’s zero QR fee now allows corner shops to receive wallet funds without sacrificing margin, further tilting growth toward P2B.
By Application:
Public-Sector Digitization Outpaces RetailRetail and e-commerce still contributed 58.59 % of spending in 2025, underpinned by household consumption that exceeds 65 % of GDP. Cashback and loyalty points at convenience chains, plus QR pilots in Hanoi’s Dong Xuan and Ho Chi Minh City’s Ben Thanh wet markets, show how digital incentives can permeate traditional channels.
Yet government and public-sector payments will accelerate at an 11.16 % CAGR as the National Public Service Portal scales from 3,800 services in 2025 to 5,000 by 2027. Electronic tax payments already cover 96 % of settlements, while auto-debits for utilities cut late fees by 18 %. The Vietnam mobile payments market size tied to transit is also expanding as commuters embrace 5 % fare discounts for tapping phones on NFC gates.
Geography Analysis
Southern Vietnam commanded roughly 48 % of national transaction value in 2025 thanks to higher income levels, dense logistics networks, and deep e-commerce penetration. Ho Chi Minh City’s 9 million residents generated 35 % of online retail spend, and its proximity to Cambodia and Thailand makes it an early adopter of cross-border QR remittances. Growth, however, is moderating to an 8.9 % CAGR as wallet penetration approaches saturation among urban consumers.
Northern Vietnam, anchored by Hanoi and the Red River Delta, is projected to advance at a 10.1 % CAGR. Policy pilots often start here, including NFC fare readers across all metro stations that now process 1.2 million taps each month. The National Public Service Portal’s Hanoi headquarters means most government payments pivoted to digital earlier than in other regions, providing a dependable volume floor. Yet upland provinces still struggle with patchy coverage and financial-literacy deficits, leaving 18 % of adults unbanked and capping upside until infrastructure improves.
Central Vietnam is forecast to post the fastest 10.8 % CAGR, led by Da Nang’s tourism rebound, where QR-enabled merchants cater to 8.5 million visitors and accept Chinese yuan or Thai baht through local wallets. The Central Highlands are piloting blockchain settlement for coffee exports that clears in 24 hours, a sharp contrast to the week-long bank workflows. Lower population density means absolute volumes remain smaller, but the region’s catch-up trajectory makes it a priority for wallet providers seeking new growth corridors within the Vietnam mobile payments market.
Regulatory Landscape
Vietnam’s mobile payments ecosystem is overseen by the State Bank of Vietnam (SBV) through laws, decrees, and circulars that cover cashless payments, payment accounts, and intermediary payment services. The Law on Credit Institutions (Law No. 32/2024/QH15), effective July 1, 2024, modernized governance requirements for credit institutions, while Decree 52/2024/ND-CP (effective July 1, 2024) established a foundational framework for non-cash payments and intermediary payment activities.
SBV circulars also tightened operational and compliance expectations for wallets and account-based services, with a stronger focus on identity verification and standardized operations. Circular 15/2024/TT-NHNN on non-cash payment services was amended by Circular 30/2025/TT-NHNN, which requires payment service providers to verify customer identity against official electronic identification records (VNeID and Public Security agency data), with provisions taking effect from April 1, 2026. Circular 17/2024/TT-NHNN, as amended by Circular 25/2025/TT-NHNN, governs the opening and use of payment accounts, with operational provisions taking effect on March 1, 2026, and Circular 40/2024/TT-NHNN sets detailed requirements for payment intermediary services, including safety assurance processes and contract requirements with partner banks.
Value Chain Analysis
Vietnam’s mobile payments value chain begins with enabling infrastructure and rule-setting, led by the State Bank of Vietnam (SBV) and national standards that support QR interoperability. Banks provide accounts and settlement capabilities and connect into national switching and clearing, while wallets and payment intermediaries (such as MoMo, ZaloPay, ViettelPay, VNPay, and others) operate consumer and merchant-facing apps, handling onboarding and day-to-day transaction experiences across point of sale and online channels.
Switching and clearing function as the mid-stream layer that shapes reach, routing, and reliability across banks and intermediaries. NAPAS is central to domestic interoperability, and the March 2026 launch of MobiFone Digital Payment (MDP) as a second licensed switching and clearing operator adds redundancy and creates a multi-operator clearing environment. Downstream, merchants, marketplaces, ride-hailing and food delivery platforms, and government service portals drive payment acceptance and repeat usage, with VietQR serving as a key acceptance rail across banks and wallets. Cross-border QR links further extend the chain into tourism and remittance corridors.
Competitive Landscape
The top five providers, MoMo, ZaloPay, ViettelPay, ShopeePay, and VNPay, held roughly 65 % combined share in 2025, signaling a moderately concentrated yet contestable field. MoMo’s USD 300 million Series E round in January 2025 financed credit scoring, micro-insurance, and wealth modules, transitioning the app from payments utility to financial supermarket. ZaloPay exploits its parent’s messaging moat to drive in-chat payments that reached 20 million active users by mid-2025. ViettelPay leverages telecom penetration to cross-sell data bundles, while ShopeePay rides on Shopee’s 52 % e-commerce hold, embedding checkout directly in product listings. VNPay focuses on merchant acceptance, offering instant settlement to 150,000 points of sale and tapping the Vietnam mobile payments industry opportunity in healthcare and education where digital acceptance lags.
White-space niches include school tuition, where 70 % of payments still occur via cash or bank branch, and private clinics, of which only 15 % accepted digital payments in 2025. Gig-economy wallet beFinancial offers instant earnings disbursement to 200,000 drivers, a feature banks struggle to replicate due to risk constraints. Technology differentiation now emphasizes biometric authentication and tokenization. MoMo’s voice-pay pilot achieved 92 % accuracy among 50,000 users, targeting seniors and visually impaired customers. As QR standards converge, user experience and ancillary services such as credit, insurance, and savings will increasingly define leadership in the Vietnam mobile payments market.
Vietnam Mobile Payments Industry Leaders
-
National Payment Corporation of Vietnam
-
Grab Financial Group Vietnam Co., Ltd. (GrabPay by Moca)
-
Viettel Digital Services Corporation (ViettelPay)
-
ZION JSC (ZaloPay)
-
MoMo (M-Service JSC)
- *Disclaimer: Major Players sorted in no particular order
Vietnam Mobile Payments Market Companies Covered in this Report
- MoMo (M-Service JSC)
- Viettel Digital Services Corporation (ViettelPay)
- ZION JSC (ZaloPay)
- Grab Financial Group Vietnam Co., Ltd. (GrabPay by Moca)
- National Payments Corporation of Vietnam (NAPAS)
- OnePAY Payment Gateway JSC
- Vietnam Payment Solution JSC (VNPay)
- ShopeePay Vietnam (SeaMoney)
- Moca Technology and Service JSC
- VNPT Media Corporation (VNPT Pay)
- Viet Union Corporation (Payoo)
- G Payment Joint Stock Company (Gpay)
- Foxpay Joint Stock Company (Foxpay)
- Smartnet Joint Stock Company (SmartPay)
- VTC Technology and Digital Content Company (VTC Pay)
- 9Pay Joint Stock Company (9Pay)
- TrueMoney Vietnam Co., Ltd.
- Be Group Joint Stock Company (beFinancial)
- SenPay Payment Service Joint Stock Company (SenPay)
Market Opportunities and Future Outlook
Cross-border QR acceptance is a practical growth lane as NAPAS-linked services extend VietQR use beyond domestic commerce. In April 2026, a cross-border QR service between Vietnam and South Korea was officially launched with NAPAS, BIDV, Hana Bank, and GLN International, adding a real-time settlement corridor for travel and merchant payments alongside existing regional linkages highlighted in the market context. A second opportunity is expanding formal, auditable payments among SMEs and merchants through policy-linked incentives, supported by the December 2025 tax rule update that requires non-cash payment documentation for transactions above VND 5 million to be deductible for corporate income tax, which strengthens the value of digital receipts and traceable payment flows across B2B and B2C transactions.
Financial inclusion programs and Mobile Money regulation also open room in rural and remote areas where bank account access and literacy gaps still constrain wallet usage. The Government’s Decree 368/2025/ND-CP on Mobile Money (December 2025) and the National Comprehensive Financial Strategy for 2026-2030 approved under Decision 928/QD-TTg (May 2026) provide a structured policy backdrop for broader inclusion, including a 95% inclusion target for the population aged 15+ and a cashless volume target of 30 times GDP by 2030. The market is also building on near-term transaction momentum reported by the SBV, with non-cash transactions in Q1 2026 up 40.74% in volume and 13.41% in value year over year, supporting continued investment in fraud controls, eKYC/VNeID integration, and scalable QR and instant transfer experiences for both consumer and public-sector payment flows.
Recent Industry Developments in Vietnam Mobile Payments Market
- April 2026: NAPAS, Ant International, and Vietcombank announced the expansion of QR code payment connectivity between Vietnam and China, enabling Alipay users to scan VIETQRGlobal codes at merchants within the NAPAS network. The update expands inbound tourism payment acceptance at scale and strengthens cross-border wallet-to-merchant interoperability using QR rails.
- February 2026: NAPAS and Vietnam Payment Solution JSC (VNPAY) signed a comprehensive cooperation agreement to develop digital payment services, including cross-border QR code payments (VIETQRGlobal) and NAPAS 247 instant fund transfers. The agreement reinforces bank-wallet-merchant connectivity and supports broader merchant acceptance through standardized rails.
- July 2024: The Law on Credit Institutions (Law No. 32/2024/QH15) took effect, replacing the 2010 framework and tightening governance requirements across the banking system. The updated legal baseline influences how banks and payment-linked financial services are structured and supervised, shaping partnerships between wallets, intermediaries, and regulated institutions.
Vietnam Mobile Payments Market Report Scope and Research Methodology
Market Definition and Coverage
This market covers the value of payment transactions that are initiated and authorized through a mobile device in Vietnam, across in-store and online journeys. The sizing follows how consumers and merchants actually use mobile channels to complete payments, rather than focusing on app downloads or user counts.
Scope exclusions: We exclude pure cash transactions, card-present payments that do not use a mobile initiation step, and non-payment activities such as lending, savings, and insurance sold through apps.
Segments Covered in This Report
- By Mode of Payment
- Point of Sales
- Online Sales
- By Payment Type
- NFC
- QR-Based
- Other Payment Types
- By Transaction Type
- Peer-to-Peer (P2P)
- Person to Business
- By Application
- Retail and E-Commerce
- Transportation and Logistics
- Hospitality and Food-Service
- Government and Public Sector
- Other Applications (Education, Healthcare)
Data Sources, Market Sizing, and Validation
Desk Research
Desk research set the basic structure of the model and helped us anchor adoption, payment infrastructure, and policy direction in Vietnam. We referenced official publications and dashboards such as the State Bank of Vietnam releases, the General Statistics Office of Vietnam, the Ministry of Information and Communications, and State Bank aligned QR and payment standard updates, followed by global comparables from sources such as the World Bank and IMF for macro and digital access signals.
On the industry side, we reviewed public materials such as payment network and bank disclosures, annual reports, investor presentations, and product documentation that clarifies how QR, NFC, and wallet flows are routed. News and financials databases and company financials intelligence subscriptions were used selectively to cross-check timelines, corporate actions, and reported performance indicators. The desk sources listed here are illustrative, and many other public sources were also used for data collection, validation, and clarification during the study.
Primary Interviews and Surveys
Primary work was used to pressure-test desk assumptions and convert broad signals into usable sizing inputs, especially around transaction mix and value per active user. We spoke with a spread of stakeholders such as banks, payment intermediaries, merchants, and enabling technology providers, and the discussions were balanced between major cities and provincial adoption patterns so we could normalize for uneven acceptance density.
Distribution of primary research fieldwork respondents
| Company type | Respondent position |
|---|---|
| Top tier: 34% | CXOs: 16% |
| Mid tier: 44% | Functional/Unit leaders: 25% |
| Smaller Players: 22% | Managers: 59% |
Market-Sizing & Forecasting
Sizing starts with a top-down build where transaction value is reconstructed using mobile payment penetration across addressable consumers and merchants, and then multiplied by frequency and average ticket size for key use cases. Those totals are then corroborated using selective bottom-up approximations, such as sampled merchant category checks and channel-level splits (in-store versus online) to make sure the final number stays realistic.
To keep the model repeatable, we used practical inputs that can be refreshed each year, including smartphone and mobile internet reach, QR acceptance expansion, e-commerce order value growth, the share of retail spend shifting to cashless instruments, and the split of P2P versus person-to-business usage. Where bottom-up data was missing for smaller merchant cohorts, gaps were handled by applying conservative adoption bands and then revisiting the bands with interview feedback.
For forecasting, scenario analysis was used because payment volumes in Vietnam can move quickly when policy or fee rules change and when new cross-border QR linkages come into play. Growth paths were set using consensus ranges from primary experts, and then adjusted for expected changes in ticket size and usage intensity by application area.
Data Validation & Update Cycle
Outputs were checked against independent signals such as cashless policy targets, reported digital transaction growth patterns, and the pace of QR onboarding, before the totals were finalized. When a variance looked unusual, we re-ran the calculation using alternate assumptions, and then re-contacted relevant respondents to understand whether it was a data issue or a real market shift.
A multi-step internal review was followed so calculation logic, units, and currency handling were consistent across years. Reports are refreshed annually, and interim updates are made when material events change transaction behavior, regulation, or pricing. Before delivery, we do a fresh verification pass so clients receive an up-to-date view rather than an older snapshot.
Mordor Intelligence's Vietnam Mobile Payments Market Size Compared With Other Published Estimates
Published market sizes for Vietnam mobile payments can look far apart because authors may count different transaction buckets, use different exchange-rate timing, or mix value and revenue concepts. We kept the sizing tied to transaction value, with clear splits by payment type and channel, and then validated the result through repeated checks with market participants.
The main gap comes from whether the estimate counts only mobile-initiated payment transactions or also folds in adjacent digital payment flows that can be initiated outside the phone, and Mordor Intelligence treats the market as mobile-initiated value across POS and online, before being split by NFC, QR-based, and other mobile payment types.
Benchmark comparison
| Source | Market Size | Gaps in Research Methodology |
|---|---|---|
| Mordor Intelligence | USD 46.56 B (2025) | |
| Trade Journal A | USD 44.25 B (2024) | Uses a different base year and appears to rely on a faster historic growth curve for recent years, which can shift the implied 2025 value upward or downward depending on ticket-size and frequency assumptions. |
| Global Consultancy B | USD 40.50 B (2025) | Likely narrows scope toward e-wallet led payments and may undercount bank-led mobile channels, which reduces the total when POS QR and app-based bank transfers are treated as separate categories. |
The table shows that the spread is mostly explained by what gets counted as mobile payments and how the base year is framed. By keeping the unit as transaction value, separating POS and online flows, and rechecking key assumptions with primary respondents, our estimate stays traceable to simple variables that can be updated as adoption and ticket sizes change.
Key Questions Answered in the Report
How large will digital wallet spending be in Vietnam by 2031?
The Vietnam mobile payments market is projected to reach USD 83.02 billion by 2031, growing at a 9.73 % CAGR between 2026-2031.
What drives the rapid expansion of QR payments nationwide?
Zero-fee QR rules, VietQR interoperability, and the absence of costly terminals let even micro-merchants print a code and accept payments instantly.
Which region offers the fastest growth potential?
Central Vietnam is expected to post the quickest 10.8 % CAGR as tourism rebounds in Da Nang and agricultural exports digitize settlement.
Why are person-to-business transactions gaining share?
Enterprises digitize payroll and invoices to cut cash handling, while VNPay’s 24-hour settlement and Circular 25/2025’s zero fee make QR competitive.
What is the biggest security concern for first-time users?
Cyber-fraud incidents, particularly phishing scams, remain the top worry, prompting mandatory two-factor authentication for higher-value transfers.
How are super-apps impacting wallet competition?
Platforms that bundle payments with ride-hailing, food delivery, and shopping increase daily active usage, boosting loyalty and raising switching costs.