
Vietnam Fruits And Vegetables Market Analysis by Mordor Intelligence
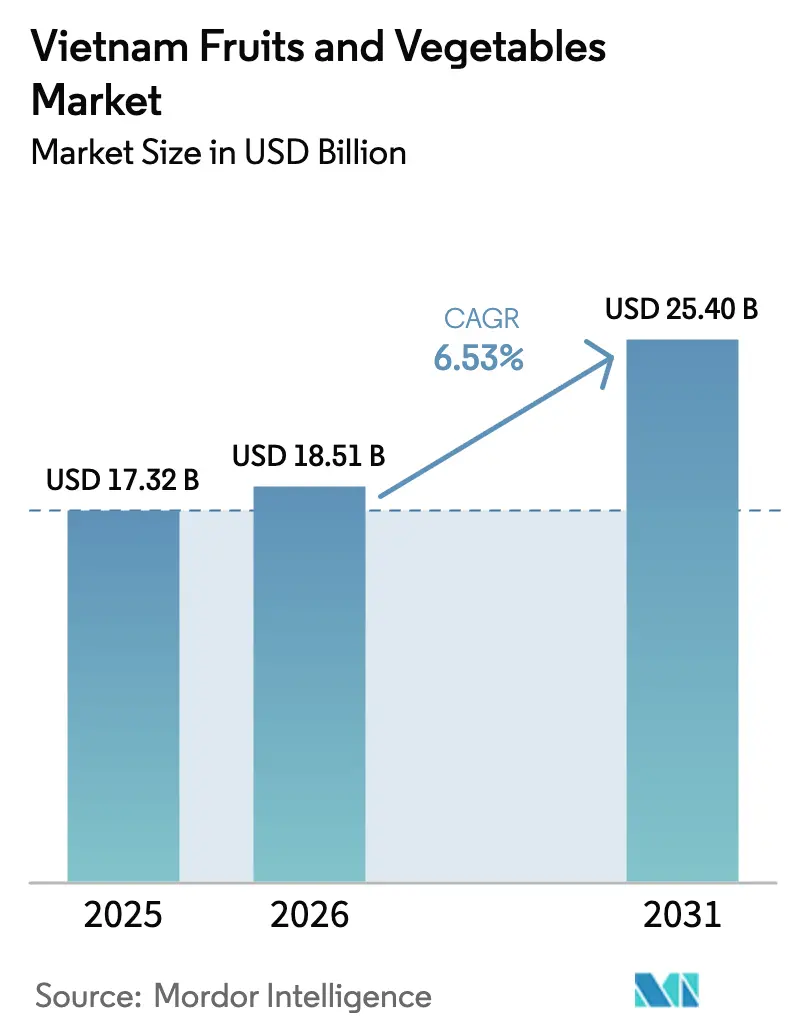
The Vietnam fruits and vegetables market is projected to expand from USD 17.32 billion in 2025 and USD 18.51 billion in 2026 to USD 25.40 billion by 2031, registering a CAGR of 6.53% between 2026 to 2031. Urban shoppers allocated a larger portion of their weekly household budgets to fresh items, accelerating the shift from smallholder plots to organized retail channels. Fruits dominate the market, with durian, dragon fruit, and mango leading in popularity, while berries have experienced the fastest growth due to highland growers utilizing temperate-zone hothouse technology. The European Union-Vietnam Free Trade Agreement (EVFTA) aims to eliminate nearly 99% of all tariffs over time, with the European Union set to remove its duties on Vietnamese goods by 2027. In parallel, investments in cold-chain logistics, packhouses, and quality certification systems are improving post-harvest handling and reducing spoilage rates, supporting both domestic distribution and export readiness. Export-oriented producers are increasingly aligning with GlobalG.A.P. and organic standards to meet the stringent requirements of premium markets, such as the European Union, Japan, and South Korea. At the same time, digital marketplaces and modern wholesale platforms are enhancing price transparency and farmer-market linkages, gradually professionalizing Vietnam’s fresh produce value chain.
Key Report Takeaways
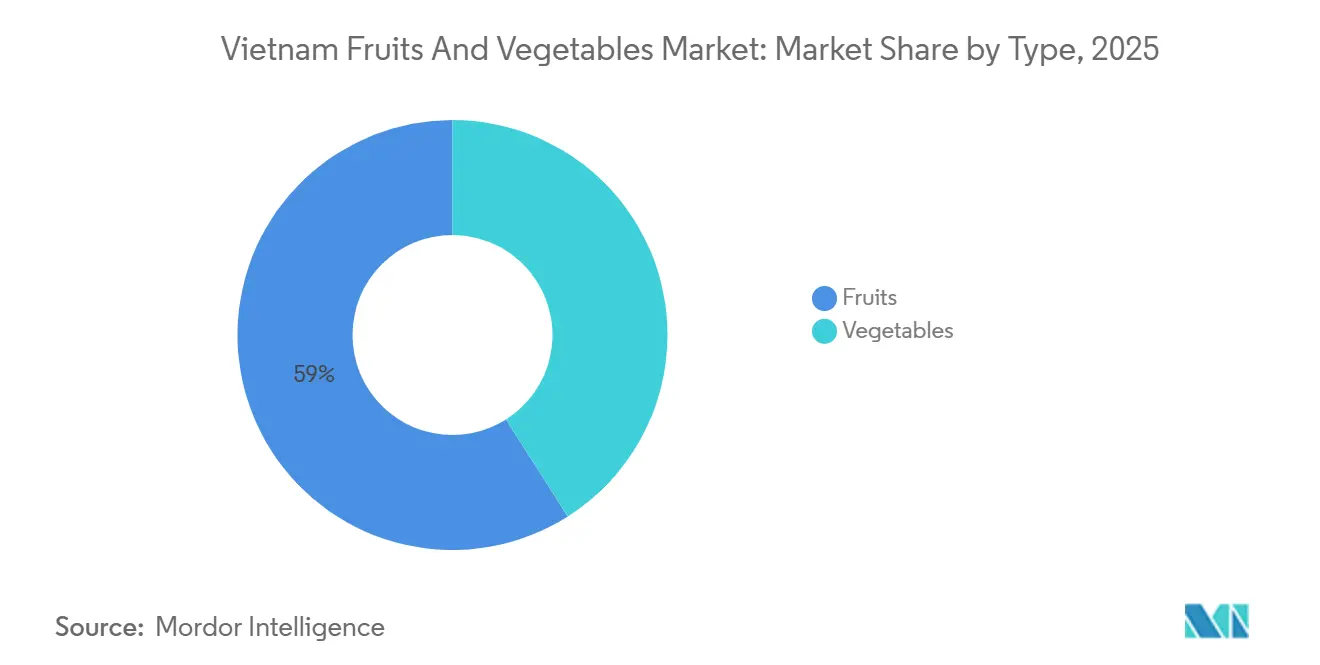
- By type, fruits accounted for 59% of the Vietnam fruits and vegetables market size in 2025 and are forecast to grow at a 7.2% CAGR through 2031.
Note: Market size and forecast figures in this report are generated using Mordor Intelligence’s proprietary estimation framework, updated with the latest available data and insights as of January 2026.
Vietnam Fruits And Vegetables Market Trends and Insights
Drivers Impact Analysis*
| Driver | (~) % Impact on CAGR Forecast | Geographic Relevance | Impact Timeline |
|---|---|---|---|
| Rising domestic per-capita intake of fresh produce | +1.2% | National, with the strongest gains in Hanoi, Ho Chi Minh City, and Da Nang | Medium term (2-4 years) |
| Shift from wet-markets to omnichannel retailing | +1.0% | Urban centers, spill over to provincial capitals | Medium term (2-4 years) |
| China-plus-One sourcing push by global buyers | +0.9% | Global, concentrated in the Mekong Delta and Central Highlands export zones | Short term (≤ 2 years) |
| European Union-Vietnam Free Trade Agreement tariff phase-outs | +0.8% | National, with direct gains for exporters in Southern Vietnam | Long term (≥ 4 years) |
| Precision-farming adoption in Mekong Delta | +0.7% | Mekong Delta, early pilots in the Central Highlands | Long term (≥ 4 years) |
| Carbon border adjustment risk for high-footprint crops | +0.6% | National, with urgency for European Union-facing exporters | Medium term (2-4 years) |
| Source: Mordor Intelligence | |||
Rising Domestic Per-Capita Intake of Fresh Produce
Urban Vietnamese households have increased their weekly spending on fresh fruits and vegetables, driven by a growing middle class that prioritizes convenience over price. This demand surge is reshaping supply chains, as supermarkets and app-based platforms require consistent quality and next-day delivery windows that traditional wet markets cannot match. Dalat Hasfarm reported that 40% of its highland vegetable output is now distributed through AEON MaxValu stores, which stock pre-washed salad mixes and portion-controlled packs tailored for two-person households. Protein intake is also rising, yet fresh produce remains the fastest-growing category in household food expenditure, suggesting that health-conscious consumers view fruits and vegetables as complements rather than substitutes to animal products.
Shift from Wet-Markets to Omnichannel Retailing
Modern retail formats, including supermarkets and e-commerce platforms, are investing in cold-chain infrastructure to sell fresh produce, a feature typically absent in wet markets. By 2025, AEON Vietnam planned to open 15 supermarkets and 45 medium-format stores, all equipped with walk-in chillers designed to maintain temperatures between 2 °C and 4 °C. This setup will reduce spoilage by 12 percentage points compared to ambient display conditions. Sumitomo has announced plans to expand Fuji Mart from 20 to 50 stores by 2028, focusing on affluent districts where consumers are willing to pay a 15% premium for traceable produce with QR codes linked to farm records. Additionally, the omnichannel model is facilitating direct-to-consumer sales. For example, cooperatives in Lam Dong Province are bypassing wholesalers and achieving 30% higher margins by selling strawberries through platforms like Shopee Fresh and Lazada.
China-Plus-One Sourcing Push by Global Buyers
Multinational retailers and food-service operators awarded Vietnamese exporters contracts worth an estimated USD 400 million in 2024 as they diversified procurement away from China, a strategy accelerated by geopolitical friction and the need for supply-chain redundancy. Nafoods Group secured a three-year agreement with a European juice processor to supply 12,000 metric tons of passion fruit annually, a volume that necessitated the company's expansion of its contract-farming network by 2,500 hectares in Gia Lai Province. Vina T&T reported that 60% of its coconut exports now serve buyers who previously sourced from Hainan, with monthly shipments reaching 500 metric tons by mid-2024 [1]Source: Vietnam Investment Review, “Vertical Farming Pilot in Hanoi,” vir.com.vn. Smaller exporters are forming consortia to meet minimum-order quantities, a tactic that allows them to compete for contracts that individual farms cannot fulfill.
European Union-Vietnam Free Trade Agreement Tariff Phase-Outs
The European Union-Vietnam Free Trade Agreement (EVFTA) will eliminate duties on 99% of agricultural tariff lines by 2027, reducing the landed cost of Vietnamese dragon fruit in European distribution centers by 12% and enabling price parity with suppliers from Thailand and Ecuador. Vietnam's fruit exports to the European Union reached USD 320 million in 2024, a 28% increase over 2023, with pomelo and passion fruit posting the sharpest gains. The agreement also harmonizes phytosanitary standards, allowing Vietnamese pack-houses that achieve GlobalG.A.P certification to bypass additional inspections at European Union ports, a procedural change that cuts clearance time from 5 days to 36 hours. The European Union market remains sensitive to pesticide residues, and Vietnamese exporters must comply with maximum residue limits that are 40% stricter than those enforced in the Asia-Pacific region. This gap has triggered 14 border rejections since 2024.
Restraints Impact Analysis*
| Restraint | (~) % Impact on CAGR Forecast | Geographic Relevance | Impact Timeline |
|---|---|---|---|
| Aging rural labor force | -0.8% | National, most acute in Northern Vietnam and the Mekong Delta | Long term (≥ 4 years) |
| High post-harvest loss | -0.9% | National, concentrated in regions lacking cold-chain infrastructure | Medium term (2-4 years) |
| Fragmented land-holding structure | -0.6% | National, with the highest fragmentation in the Red River Delta | Long term (≥ 4 years) |
| Escalating plant-health incidents | -0.7% | Central Highlands for TR4, Northern Vietnam for citrus greening | Short term (≤ 2 years) |
| Source: Mordor Intelligence | |||
Aging Rural Labor Force
Farmworkers over 45 years old accounted for 62% of Vietnam's agricultural labor pool in 2025, a demographic imbalance that is tightening harvest-season availability and pushing daily wages up by 8% annually[2]Source: General Statistics Office Vietnam, “Vietnam Household Food Expenditure Survey 2025,” gso.gov.vn. Youth migration to manufacturing hubs in Binh Duong and Dong Nai has left cooperatives scrambling to recruit seasonal workers, with some orchards reporting unfilled positions during peak mango and dragon fruit harvests. The gap is widening productivity differentials, as industrial estates operated by Hoang Anh Gia Lai Agricultural achieve yields 30% higher than neighboring family farms through mechanized pruning and automated irrigation. Training programs launched by the Ministry of Agriculture and Rural Development in 2024 enrolled 5,000 young farmers in precision agriculture courses and retention rates remain below 40%, as graduates opt for urban jobs that pay 50% more.
High Post-Harvest Loss
Vietnam loses 20 to 30% of its fruit and vegetable output between harvest and retail, a leakage driven by inadequate cold-chain coverage and the absence of pack-houses in remote growing areas. The Mekong Delta has only 120 cold-storage facilities with a combined capacity of 180,000 metric tons, which is insufficient to handle the region's annual fruit production of 2 million metric tons. Reefer trucks account for just 15% of the domestic transport fleet, forcing growers to ship produce in ambient containers that expose cargo to temperatures exceeding 35 degrees Celsius during summer months. Logistics costs represent a significant share of product value, which is twice the proportion observed in Thailand, where a more extensive network of cold hubs facilitates multi-stop consolidation.
*Our forecasts treat driver/restraint impacts as directional, not additive. The impact forecasts reflect baseline growth, mix effects, and variable interactions.
Segment Analysis
By Type: Fruits Dominate but Vegetables Gain Traction in Value-Added Formats
Fruits accounted for 59% of the Vietnam fruits and vegetables market size in 2025 and are forecast to grow at a 7.2% CAGR through 2031. Berries are projected to grow at the fastest rate among all product categories, as highland growers in Lam Dong Province implement hothouse systems that extend the strawberry season from 4 to 9 months and facilitate year-round blueberry production. According to the Ministry of Agriculture and Rural Development of Vietnam, durian acreage reached 112,000 hectares nationwide by late 2024, with annual output hitting 900,000 metric tons, yet frozen durian exports to China faced logistical bottlenecks as only 40 pack-houses held the required permits, constraining shipments to 60% of potential volume [3]Source: Ministry of Agriculture and Rural Development, “Regional Crop Conversion Report 2025,” mard.gov.vn.
The diverse climatic conditions in the country support the cultivation of a wide range of crops, including tropical fruits such as dragon fruit, mango, and litchi, as well as temperate vegetables like tomatoes and cabbage. In recent years, the harvest area for fruit and vegetable production has expanded as farmers increasingly adopt advanced agricultural techniques and technologies to enhance yield and quality. Vietnam is also investing in post-harvest infrastructure to minimize losses and improve export quality. Efforts include the development of cold chain logistics, innovative packaging solutions, and processing facilities to maintain freshness and meet international standards. With these advancements, Vietnam is well-positioned to strengthen its supply capabilities both regionally and globally.


Geography Analysis
The Mekong Delta held a significant market share in 2025, driven by its dominance in dragon fruit, mango, and coconut production, crops that thrive in the region's alluvial soils and year-round water access from the Mekong River's nine distributaries. The region's logistics advantage is eroding, as saltwater intrusion pushed 80 kilometers inland during the 2024 dry season, forcing farmers to invest in desalination ponds that add USD 600 per hectare to operating costs. The Mekong Delta also benefits from Cat Lai Port's reefer capacity, which expanded by 40% in 2025 to handle 180,000 twenty-foot equivalent units annually, cutting dwell time for export containers from 5 days to 48 hours.
The Central Highlands and Central Coast are projected to post the highest regional growth, driven by coffee estates converting marginal land to avocado, passion fruit, and temperate vegetables that command premiums in urban markets. The region's elevation, ranging from 800 to 1,500 meters, creates microclimates suitable for berries and stone fruits that cannot tolerate lowland heat, a geographic advantage that is drawing interest from Japanese and South Korean buyers seeking off-season supply. The Central Coast, centered around Binh Thuan and Ninh Thuan provinces, focuses on dragon fruit production for export.
Northern Vietnam remains a vegetable stronghold, supplying 60% of the leafy greens, tomatoes, and cucumbers consumed in Hanoi and surrounding provinces. Northern Vietnam's proximity to China offers a logistics edge for cross-border trade, with Lao Cai and Lang Son border gates processing 80,000 metric tons of fresh produce monthly, yet informal trade remains prevalent, undermining efforts to enforce phytosanitary standards.
Regulatory Landscape
Vietnam’s fruits and vegetables sector is governed by the plant protection, quarantine, and food safety framework led by the Ministry of Agriculture and Environment (MAE) and implemented through the Plant Protection Department (PPD), alongside other agencies involved in food safety oversight. In January 2026, Decree No. 33/2026/ND-CP (effective January 21, 2026) and Circular No. 07/2026/TT-BNNMT (effective January 23, 2026) amended regulations relevant to cultivation practices and plant protection compliance. The updates reinforce the use of documented inputs, pest management, and inspection protocols for both domestic channels and export-facing supply.
For trade compliance, exporters face increasing formalization through growing-area codes, packhouse eligibility, and residue compliance requirements set by major destinations. Customs digitization is also tightening process discipline, with 100% electronic procedures for agricultural shipments and commitments for faster clearance of perishables. This is pushing supply chains toward standardized documentation and traceability-ready operations that align with EVFTA-driven access and tighter SPS expectations in premium markets.
Value Chain Analysis
Vietnam’s fruits and vegetables value chain remains dominated by smallholder production and intermediary-led aggregation, typically moving from farmers to collectors and wholesalers, then to packhouses and processing firms and onward to modern retailers or export channels. Modern retail and e-commerce are raising requirements for consistent grading, cold handling, and traceable sourcing. Exporters are responding by aligning packhouses with GlobalG.A.P and destination-specific phytosanitary processes to reduce inspection friction and border risks.
Post-harvest handling is the main value leakage point, with losses commonly in the 20-30% range due to limited cold-chain coverage, low reefer penetration, and uneven packhouse access in production zones. Processing is expanding from a low base, with only about 10-15% of output processed using modern technology, while the export mix is starting to tilt toward higher-value formats. This is supported by investments in cold storage, processing lines, and digitized traceability systems. Oversight and facilitation span multiple ministries (MOH, MAE, and MOIT), with MAE taking a central role in traceability and processing development initiatives that connect production clusters to domestic modern retail and export logistics gateways.
Competitive Landscape
The Vietnam fruits and vegetables market, encompassing producers, importers, and exporters, is characterized by a high concentration of smallholder farms and the absence of vertically integrated players similar to Dole or Del Monte in other Asia-Pacific markets. Competition is intensifying along two key dimensions, efficiency driven by scale and premiums enabled by traceability. Hoang Anh Gia Lai Agricultural manages 7,000 hectares of bananas and 1,500 hectares of durians, achieving per-hectare yields 30% higher than the national average through mechanized pruning and drip fertigation. This productivity advantage enables the company to offer FOB prices 12% lower than those of smaller competitors.
Opportunities are emerging in organic certification and carbon-neutral supply chains, areas where Vietnamese producers lag behind their Thai and Philippine counterparts, despite benefiting from lower labor costs. Technology adoption is becoming a critical differentiator as buyers increasingly demand blockchain traceability and real-time cold-chain monitoring. In 2024, Vina T&T introduced a QR code system that links each durian shipment to its farm coordinates, harvest dates, and pesticide usage logs. This transparency helped the company secure a three-year contract with a Japanese retailer.
Smaller exporters are forming consortia to share the USD 50,000 cost of implementing IoT sensors and cloud-based inventory platforms. This collaborative approach enables them to compete for contracts that require a minimum monthly volume of 200 metric tons. Emerging disruptors include e-commerce platforms such as Kingfoodmart, which bypassed traditional wholesalers in urban fresh produce sales in 2024 by offering same-day delivery and direct farm-to-consumer pricing.
Market Opportunities and Future Outlook
Cold-chain and processing capacity sits at the center of near-term whitespace because post-harvest loss and uneven cold storage distribution limit both domestic modern retail service levels and export reliability. One of the clearest investment signals is the June 2026 groundbreaking of the Tan Tien Industrial Cluster in Dak Lak (about VND 471 billion), positioned as a logistics, processing, and export center for fruit. Another is the June 2026 groundbreaking of a KIND-backed smart logistics center in Amata City Long Thanh, Dong Nai (about KRW 56 billion, with 70% of the area dedicated to cold-chain facilities). Together, these projects point to a shift toward integrated nodes that combine sorting, cold storage, and processing closer to production and major transport corridors.
Digitization and compliance infrastructure also present a defined opportunity as export protocols increasingly require standardized documentation and end-to-end traceability. In June 2026, Vietnam officially launched a nationwide agricultural product traceability system following a durian export pilot, and MAE’s May 2026 science, technology, and innovation plan (2026-2030) prioritized digital infrastructure, AI, and big data for agriculture. As EVFTA tariff phase-outs progress and destination markets tighten SPS controls, suppliers that can operationalize growing-area codes, residue compliance, and digital traceability across cooperatives and contract farms gain access to higher-value channels and reduce the cost of non-compliance events such as inspection delays or border rejections.
Recent Industry Developments
- July 2026: THACO AGRI reported progress in building a closed-loop farm-to-export value chain across Vietnam, Laos, and Cambodia and outlined a 2026 investment plan of VND 10 trillion to expand banana cultivation to 15,800 hectares. The report strengthens supply assurance and scale economics for export programs that demand consistent volumes, standardized quality, and traceable sourcing.
- December 2025: The Vietnamese government designated bananas as a priority crop under the Project for the Development of Key Fruit Crops with a vision to 2030, targeting export momentum and production scale-up. The program formalizes crop prioritization and encourages larger, more organized plantation development aligned with export market requirements.
- November 2024: Hoang Anh Gia Lai Agricultural and Kingfoodmart signed a strategic partnership to distribute bananas and durians through Kingfoodmart’s store network and the OneLife app. By linking large plantations directly with an omnichannel retail platform, the partnership accelerates traceable, higher-margin distribution while reducing reliance on traditional wholesale pathways.


Research Methodology Framework and Report Scope
Market Definition and Coverage
This market is defined as the value of fruits and vegetables consumed and traded within Vietnam, covering fresh produce sold through main channels and linked export flows, measured in USD at prevailing prices for the year.
Scope exclusions: Food ingredients, beverages, and packaged ready-to-eat meals that only use fruit or vegetable derivatives are not counted as part of this market.
Segmentation Overview
- Type
- Vegetables
- Cucumbers
- Production Analysis
- Production Volume
- Area Harvested and Yield
- Consumption Analysis (Value and Volume)
- Trade Analysis (Value and Volume)
- Import Market Analysis
- Import Value and Volume
- Key Supplying Markets
- Export Market Analysis
- Export Value and Volume
- Key Destination Markets
- Import Market Analysis
- Wholesale Price Trend Analysis and Forecast
- Seasonality Analysis
- Production Analysis
- Tomatoes
- Production Analysis
- Production Volume
- Area Harvested and Yield
- Consumption Analysis (Value and Volume)
- Trade Analysis (Value and Volume)
- Import Market Analysis
- Import Value and Volume
- Key Supplying Markets
- Export Market Analysis
- Export Value and Volume
- Key Destination Markets
- Import Market Analysis
- Wholesale Price Trend Analysis and Forecast
- Seasonality Analysis
- Production Analysis
- Cabbage
- Production Analysis
- Production Volume
- Area Harvested and Yield
- Consumption Analysis (Value and Volume)
- Trade Analysis (Value and Volume)
- Import Market Analysis
- Import Value and Volume
- Key Supplying Markets
- Export Market Analysis
- Export Value and Volume
- Key Destination Markets
- Import Market Analysis
- Wholesale Price Trend Analysis and Forecast
- Seasonality Analysis
- Production Analysis
- Carrots
- Production Analysis
- Production Volume
- Area Harvested and Yield
- Consumption Analysis (Value and Volume)
- Trade Analysis (Value and Volume)
- Import Market Analysis
- Import Value and Volume
- Key Supplying Markets
- Export Market Analysis
- Export Value and Volume
- Key Destination Markets
- Import Market Analysis
- Wholesale Price Trend Analysis and Forecast
- Seasonality Analysis
- Production Analysis
- Cucumbers
- Fruits
- Grapes
- Production Analysis
- Production Volume
- Area Harvested and Yield
- Consumption Analysis (Value and Volume)
- Trade Analysis (Value and Volume)
- Import Market Analysis
- Import Value and Volume
- Key Supplying Markets
- Export Market Analysis
- Export Value and Volume
- Key Destination Markets
- Import Market Analysis
- Wholesale Price Trend Analysis and Forecast
- Seasonality Analysis
- Production Analysis
- Apples
- Production Analysis
- Production Volume
- Area Harvested and Yield
- Consumption Analysis (Value and Volume)
- Trade Analysis (Value and Volume)
- Import Market Analysis
- Import Value and Volume
- Key Supplying Markets
- Export Market Analysis
- Export Value and Volume
- Key Destination Markets
- Import Market Analysis
- Wholesale Price Trend Analysis and Forecast
- Seasonality Analysis
- Production Analysis
- Banana
- Production Analysis
- Production Volume
- Area Harvested and Yield
- Consumption Analysis (Value and Volume)
- Trade Analysis (Value and Volume)
- Import Market Analysis
- Import Value and Volume
- Key Supplying Markets
- Export Market Analysis
- Export Value and Volume
- Key Destination Markets
- Import Market Analysis
- Wholesale Price Trend Analysis and Forecast
- Seasonality Analysis
- Production Analysis
- Mango
- Production Analysis
- Production Volume
- Area Harvested and Yield
- Consumption Analysis (Value and Volume)
- Trade Analysis (Value and Volume)
- Import Market Analysis
- Import Value and Volume
- Key Supplying Markets
- Export Market Analysis
- Export Value and Volume
- Key Destination Markets
- Import Market Analysis
- Wholesale Price Trend Analysis and Forecast
- Seasonality Analysis
- Production Analysis
- Durian
- Production Analysis
- Production Volume
- Area Harvested and Yield
- Consumption Analysis (Value and Volume)
- Trade Analysis (Value and Volume)
- Import Market Analysis
- Import Value and Volume
- Key Supplying Markets
- Export Market Analysis
- Export Value and Volume
- Key Destination Markets
- Import Market Analysis
- Wholesale Price Trend Analysis and Forecast
- Seasonality Analysis
- Production Analysis
- Dragon Fruit
- Production Analysis
- Production Volume
- Area Harvested and Yield
- Consumption Analysis (Value and Volume)
- Trade Analysis (Value and Volume)
- Import Market Analysis
- Import Value and Volume
- Key Supplying Markets
- Export Market Analysis
- Export Value and Volume
- Key Destination Markets
- Import Market Analysis
- Wholesale Price Trend Analysis and Forecast
- Seasonality Analysis
- Production Analysis
- Grapes
- Vegetables
Data Sources, Market Sizing, and Validation
Desk Research
Desk research starts by mapping the supply and demand picture using public statistics and trade references, and then the initial assumptions are drafted before we speak to the market. We typically pull time series on planted area, yield, production, and wholesale price movements from sources such as Vietnam General Statistics Office (GSO), the Ministry of Agriculture and Rural Development (MARD), and FAOSTAT. Trade direction and unit values are checked using sources such as UN Comtrade and ITC Trade Map, and policy or SPS related changes are traced through official government notifications and association portals.
To translate volumes into value, we also review exporter updates, sector releases, and company filings where available, since these documents often explain price swings and destination mix changes. In parallel, a paid subscription for company financials and news is used selectively to cross-check revenue timing and major operational expansions, and a shipment-level import export database is used when we need a clearer view on product mix and declared values. These desk sources are illustrative, and we also consult other public and paid references during data collection, validation, and clarification.
Primary Interviews and Surveys
Primary work focuses on filling gaps that desk sources do not explain well, mainly around farmgate to wholesale price transmission, channel margins, export quality sorting, and how seasonality changes realized prices. We speak with growers, aggregators, packhouse and cold chain operators, wholesalers, exporters, retailers, and industry bodies. We also validate assumptions with experts who track Vietnam trade flows and domestic consumption behavior across regions.
Distribution of primary research fieldwork respondents
| Company type | Respondent position |
|---|---|
| Top tier: 32% | CXOs: 20% |
| Mid tier: 47% | Functional/Unit leaders: 24% |
| Smaller Players: 21% | Managers: 56% |
Market-Sizing & Forecasting
Sizing is built using a top-down approach where production and trade data are used to reconstruct the national demand pool and its value, and then it is stress tested with selective bottom-up approximations. On the supply side, we start with harvested area and yield patterns, convert them into output volumes, and then adjust for post-harvest losses and exportable grades based on what interviewees say is realistic for key crop groups. On the demand and trade side, export and import values are used as a control check, especially when destination mix changes can move prices faster than volumes.
Value is computed by applying price points that match the selling stage being modeled, so we track wholesale price trends, farmgate movements, and export unit value signals together before selecting the final ASP. For Vietnam, a few practical inputs that typically matter are seasonal harvest windows, export acceptance requirements (such as certifications and residue compliance), cold chain and packhouse availability, and the share of output moving through wet markets versus modern retail. Forecasting uses scenario analysis that links output, trade demand, and price direction to agreed macro and sector signals, and then the assumptions are refined using expert consensus from interviews. When data is missing for smaller crops or informal flows, gap handling is done by using proxy crops with similar seasonality and price behavior, followed by a reasonableness check against total production and trade balances.
Data Validation & Update Cycle
Validation is done by triangulating the modeled totals against independent signals such as production growth, export value trends, and reported wholesale price direction, and then investigating any large variances before sign-off. Outliers are reviewed at the assumption level, such as sudden yield jumps, unusual unit value movements, or trade spikes that do not align with seasonality, and we re-contact sources when the explanation is not clear.
Each report is refreshed annually, and interim updates are triggered when material events occur, such as major policy shifts, sharp currency moves, or export disruptions that can change realized prices. Before delivery, analysts perform a fresh pass to ensure the latest public data releases and interview learnings are reflected in the final view.
Mordor Intelligence's Vietnam Fruits and Vegetables Market Size Versus Other Published Estimates
It is normal to see different market values for Vietnam fruits and vegetables because publishers may not count the same product boundaries, and they also pick different years, price bases, and conversion timings. Some studies lean more on headline trade values, while others lean more on domestic consumption value, which can move the number in either direction.
In this study, the biggest gap drivers usually come from how fresh versus processed and dried items are treated, whether export values are counted gross or adjusted for re-exports and grading losses, and how average selling prices are updated when harvest season shifts within the year. Because currency timing and in-year price validation can materially change the USD value, the model refresh cycle matters, and those choices show up clearly in the spread across published figures.
Benchmark comparison
| Source | Market Size | Gaps in Research Methodology |
|---|---|---|
| Mordor Intelligence | USD 17.32 B (2025) | |
| Industry Publisher A | USD 16.70 B (2024) | Uses a different base year and a broader product form boundary that includes dried items, and the USD conversion timing is not clearly linked to in-year farmgate and wholesale price movements. |
| Market Research Firm B | USD 17.19 B (2024) | Appears to include processed categories alongside fresh, and the valuation is presented without clear reconciliation to Vietnam production totals and trade unit values for the same year. |
The table shows that even when the market is defined similarly, the year selected and the price update mechanics can shift the outcome by a meaningful margin. By rechecking wholesale price direction, trade unit values, and the FX conversion window during each refresh, Mordor Intelligence keeps the estimate tied to the same demand pool rather than letting temporary price spikes or scope creep inflate the total.


Key Questions Answered in the Report
What is the current and projected value of the Vietnam fruits and vegetables market?
The market was valued at USD 18.51 billion in 2026 and is projected to reach USD 25.40 billion by 2031.
Which region holds the largest share?
The Mekong Delta is considered of high value in 2025 owing to dragon fruit, mango, and coconut output.
How is retail changing the supply chain?
Modern and omnichannel retail captured 32% of fresh-produce sales in 2025, forcing suppliers to meet strict cold-chain and traceability standards.
What are the main export tailwinds?
Duty-free access under the European Union-Vietnam Free Trade Agreement and global China-plus-One sourcing have increased contracts for certified Vietnamese exporters.
Page last updated on:


 Your data is secure and never sold or shared.


